Why Australian shares are falling behind the world
Mark LaMonica, CFA | Morningstar Australia
The change came a long way back—but at first it didn’t show. The manner remains intact for some time after the morale cracks.
- F Scott Fitzgerald
The 2023 Credit Suisse Global Investment Returns Yearbook puts the Australian share market at the top of the global leaderboard for returns since 1900. Australia has the highest returns over the 123 years of the study in USD terms and the second highest in AUD terms.
This is an envious long-term historical track record of success for our local market. But things haven’t been great lately.
The question for investors today is whether the recent relative underperformance is an aberration or a harbinger of things to come. I set out to answer this question.
Australia against the world
I’ve looked at the returns of well-known passive ETFs covering global markets over one, three, five and ten-year periods.
If a hedged version was available from the same provider I included those ETFs as well. A hedged ETF removes the impact of currency changes. To represent the Australian market I picked Vanguard Australian Shares ETF which covers the ASX 300.
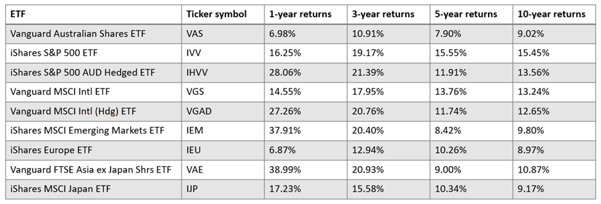
Source: Morningstar
The Australian market has universally underperformed with the exception of the European ETF IEU over one and ten years.
The returns include dividends but don’t incorporate the impact of franking credits. However, the only ETFs that outperformed by less than 2% per year on this chart are the emerging market ETF IEM over five and ten-year periods, the Japan ETF IJP over ten years and the Asia ETF VAE over five and ten-year periods. Historically franking credits have added approximately 2% to overall returns in Australia.
For investors with a goal to maximise returns the retrospective message is clear – all of your money should have been invested in a globally diversified non-Australian portfolio. The more allocated to Aussie shares the lower the returns.
It is easy to look at historic data and opine on what an investor should have done. It is harder to figure out a strategy for the future.
To try and determine if this pattern of underperformance will continue it is worthwhile exploring why the Australian market has been lagging global peers.
A good place to start is one of the biggest differences between local and global markets – how dividends are treated in Australia.
A different approach to dividends
To end the double taxation of dividends, franking credits were introduced on 1 July 1987. No other country in the world has such a generous system where full imputation is offered and franking credits are refundable.
Dividends are more attractive in Australia than they are in other markets. Unsurprisingly Australian companies responded and the amount of earnings dedicated to dividends rose from approximately 40% to around 80% within a decade.
This all makes a good deal of sense. In Australia dividends became more valuable and companies want to keep investors happy…so they paid higher dividends.
Other markets have gone in a different direction and companies are paying out less in dividends. For instance, the S&P 500 had an average dividend payout rate of 49% during the 1980s. In 2025 the S&P 500 dividend payout rate was roughly 32%.
It is clear the market in Australia is different from global markets. Whether that is good or bad depends on your perspective. But understanding how the Australian market works is a key input into making the right decisions to achieve your goals.
Dividends and returns in Australia
The following chart shows returns from a dividend focused ETF – Vanguard Australian High Yield - compared to the Vanguard Australian Shares ETF.
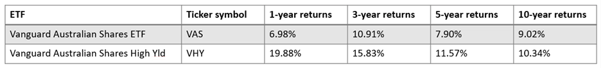
Source: Morningstar
The dividend-focused ETF outperformed the overall index. This is an anomaly in a period with strong returns. Investing theory and history suggests that high dividend payers – which the ETF is designed to capture - lag in bull markets while outperforming during periods of market turmoil.
To understand why requires an exploration of the three factors that contribute to returns – dividends, changes in valuation levels and earnings growth. In periods of above average returns the key return driver is often changes in valuation levels that anticipate the start, or continuation, of strong earnings growth.
As valuation levels increase earnings growth becomes more attractive. If a company can grow earnings by 10% a year and investors are willing to pay more for those earnings a share price can rapidly increase. Shares with high dividends often have lower growth and investors rotate away from them in bull markets.
During a bear market when valuation levels decrease, earnings growth becomes less valuable. In the face of a market contraction many investors gravitate to a more certain source of returns – dividends.
The following table for the S&P 500 is illustrative of this effect.
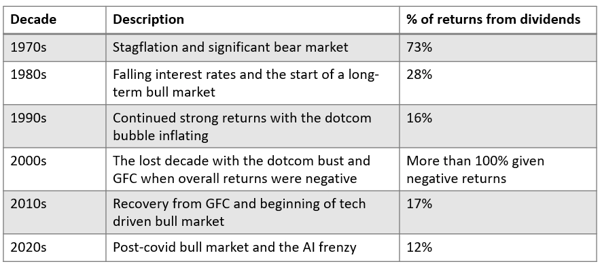
Source: Morningstar
A similar effect is not occurring in the Australian market
Over the last decade things look very different in Australia. About 55% of the returns came from reinvested dividends for VAS while 72% of returns for VHY came from reinvested dividends.
Investing $10,000 a decade ago resulting in $6,453 in total income for holders of VAS and $9,166 for holders of VHY. That income difference resulted in a higher return for VHY.
While overall valuation levels have increased in Australia over the last decade there has been little earnings growth.
The following table shows the ten largest companies in the ASX in 2016 along with their annual returns and annual net income growth rate over the last ten years.
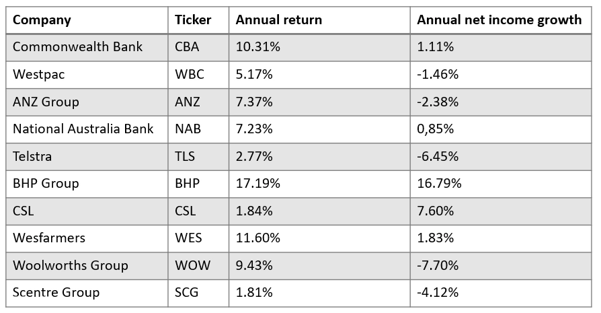
Source: Morningstar
Only two companies on the list grew annual net income at a rate higher than inflation. Most fell well short of inflation with four companies generating negative annual returns over the decade.
Three companies have been replaced on the list of the ten largest ASX companies. Woodside, Macquarie and Rio Tinto replaced Telstra, Woolworths and Scentre.
Looking at the US market shows the difference in growth rates. The following table shows the ten largest companies in the US in 2016.
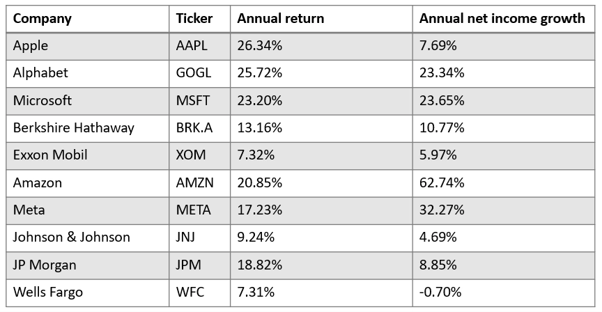
Source: Morningstar
Wells Fargo is an outlier as the last ten years has been marked by an ongoing reputational and regulatory crisis. But for the remaining companies, net income growth has been impressive. Returns have followed suit.
Five companies have been replaced on the list of the ten largest S&P 500 companies. NVIDIA, Broadcom, Tesla, Micron and Eli Lilly replaced Berkshire, Exxon Mobil, Johnson & Johnson, JP Morgan and Wells Fargo.
This same pattern is evident when looking at the overall index. The All Ordinaries Index in Australia has grown earnings at approximately a 4.50% annual rate over the last decade while the S&P 500 has grown earnings by around 13%.
There are several factors which may explain why growth is lower in Australia. The largest companies in Australia operate in slower growing sectors. Additionally, the higher dividend payout rate means less earnings are available to reinvest in growth. There is also a disturbing lack of productivity growth in the Australian economy.
These factors are related but they are all leading to lower overall growth for Australian companies. Valuation levels have increased in both the US and Australia but earnings growth hasn’t kept pace in Australia. Dividends haven’t been high enough to make up the difference. That is why returns are lower.
Will this change going forward?
There is little evidence to suggest that things will change. The top Australian companies still operate in industries with lower expected growth. Franking credits still make dividends more attractive for Australian investors. Productivity is still dropping.
There is reason to believe lower growth is structural and unless there is another commodity super cycle Australia may continue to lag. The new tax proposal may further embed slower growth.
The proposed tax changes to capital gains are not final but they will make dividends even more attractive on a relative basis than capital gains. There is even more incentive for Australian companies to reward shareholders with dividends.
Investors are already responding to the proposed change in taxation and seeking out income focused investments in Australia. Income ETFs had their best month ever of inflows in May according to Global X with $243 million going into yield focused share ETFs. This will further encourage companies to pay dividends.
Final thoughts
Each investor has a unique set of goals and portfolios should be aligned with what an investor is trying to achieve.
For income investors seeking the highest grossed up yields the Australian market remains attractive. For investors that are focused on capital gains global markets may be a better bet over the long-term.
More nuance is required for investors – like myself – that are seeking dividend growth. If earnings don’t grow over the long-term dividends can’t grow regardless of the payout rate.
This all comes down to the mix of investments in a portfolio. My portfolio is heavily weighted towards global shares for growth and I use the local market for grossed up yield. My plan is to continue to increase my allocation to the local market as I get older and yield becomes more attractive.
Too often commentary about investing is focused on declaring a particular investment good or bad. But that misses the point.
Markets and individual investments are just tools for investors. The key is picking the correct tools for the job you are trying to accomplish. For some investors Australian shares may no longer be the right fit.
First published on the Firstlinks Newsletter. A free subscription for nabtrade clients is available here.
All prices and analysis at 1 July 2026. This document was originally published on firstlinks.com.au on 9 June 2026 and has been prepared by Firstlinks, a Morningstar publication (Morningstar Australasia Pty Limited (“Morningstar”) ABN: 95 090 665 544 AFSL: 240 892). The content is distributed by WealthHub Securities Limited (WSL) (ABN 83 089 718 249)(AFSL No. 230704). WSL is a Market Participant under the ASIC Market Integrity Rules and a wholly owned subsidiary of National Australia Bank Limited (ABN 12 004 044 937)(AFSL No. 230686) (NAB). NAB doesn’t guarantee its subsidiaries’ obligations or performance, or the products or services its subsidiaries offer. This material is intended to provide general advice only. It has been prepared without having regard to or taking into account any particular investor’s objectives, financial situation and/or needs. All investors should therefore consider the appropriateness of the advice, in light of their own objectives, financial situation and/or needs, before acting on the advice. Past performance is not a reliable indicator of future performance. Any comments, suggestions or views presented do not reflect the views of WSL and/or NAB. Subject to any terms implied by law and which cannot be excluded, neither WSL nor NAB shall be liable for any errors, omissions, defects or misrepresentations in the information or general advice including any third party sourced data (including by reasons of negligence, negligent misstatement or otherwise) or for any loss or damage (whether direct or indirect) suffered by persons who use or rely on the general advice or information. If any law prohibits the exclusion of such liability, WSL and NAB limit its liability to the re-supply of the information, provided that such limitation is permitted by law and is fair and reasonable. For more information, please click here.