Unconventional wisdom: The best and worst performing ASX shares
Mark LaMonica, CFA | Morningstar
Conventional wisdom is a byproduct of groupthink that presents solutions good enough for the average person while simultaneously not being right for any individual. You follow it at your peril. Each Monday I will challenge the investing norms that just may be holding you back from living the life you want.
Unconventional wisdom: The best and worst performing ASX shares
The best argument against democracy is a five-minute conversation with the average voter.”
- Wiston Churchill
Several weeks ago I outlined new research by Professor Henrik Bessembinder showing an increasingly small number of shares drive overall wealth creation. Bessembinder’s data set is comprehensive and explores a century of US share market returns.
A natural question is if the Australian market exhibits the same concentration in successful investing outcomes from picking shares.
First, a reminder of Bessembinder’s conclusions:
- The median buy and hold return for an American share was -6.87% with overall average returns of 10.10% per year. Results were skewed by the outsized winners.
- Only 48.33% of shares generated a positive return with 41.17% beating the return on the cash equivalent of a short-term US Treasury bill. Most shares don’t have great outcomes.
Data on the Australian market
Bessembinder had a rich dataset to work with. Mine is more limited. I looked at the largest 333 companies listed on the ASX. This is roughly every company with a current market capitalisation higher than $1 billion. This represents just under 15% of the 2,261 listed shares.
I looked at return data over the previous 15 years. This disqualified 123 companies without a 15-year history of returns and leaves 210 companies. All return data assumes the reinvestment of dividends but does not include any impact from franking credits.
My data has a natural bias towards companies that have performed well. Most poor performers over the last 15 years likely wouldn’t make my list as their market capitalisation would have dropped below my cutoff. Conversely, smaller companies that did perform well likely made my list as their market capitalisation increased.
There is also a survivorship bias because companies that went bankrupt – which likely resulting in a 100% loss - would be excluded. An example is Virgin Airways 2020 bankruptcy. If I had data on every ASX listed share the survivorship bias would be more pronounced as small and micro-cap shares are more likely to go out of business.
The negative impact of the survivorship bias is somewhat offset by companies that were taken private or acquired by other public companies. These acquisitions often occur at a premium and those positive results wouldn’t be captured in my data.
The overall impact of the limited nature of my data is likely an increase in the median return by primarily eliminating poorly performing shares.
What the data shows
I want to establish a baseline to compare the results of individual shares. Over the past 15 years the return of the ASX 300 was 8.62% per year. If you invested $1,000 it would have grown to $3,456. Keeping the money in the bank would have earned an annual return of 2.67% a year meaning $1000 would have grown to $1,484.
The average return of the 210 shares with a 15-year track record was 7.11% a year. The last 15 years was a good time to invest in a market capitalisation weighted index. The higher index returns show large companies outperformed the average company.
The median return for the shares included in my dataset was 6.73%. Returns are somewhat positively skewed, but the degree was influenced by my data limitations. When the average is higher than the median, the data is considered positively skewed. This means a few outliers are pulling the average higher. The larger the skew the bigger the influence of outliers.
In Bessembinder’s data the returns were positively skewed to a significant degree with an average return of 10.10% and a median return of -6.87%. I assume there would be a similar pattern in Australia if I had a richer dataset.
How easy is it to beat the index and cash
Roughly 36% of shares outperformed the index return. This number would likely be meaningfully lower without the survivorship bias.
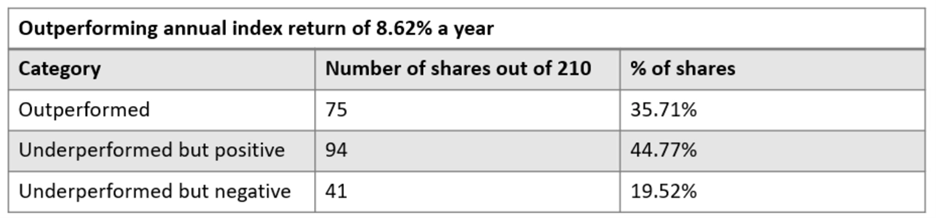 Source: Morningstar
More than 72% of shares beat the cash return which is also likely inflated by survivorship bias.
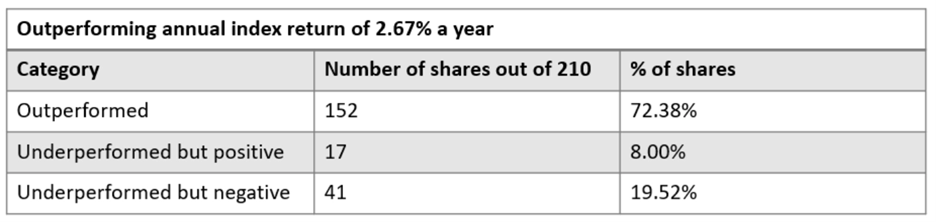 Source: Morningstar
What I found surprising about the data is the percentage of shares that had a negative annual return over 15 years even when survivorship bias is accounted for.
The downside of concentration gets a lot of attention with passive investing. What is underappreciated is how a market capitlisation weighted index reduces / eliminates the influence of shares with terrible returns.
Warren Buffett famously said his number one rule was to never lose money. Clearly this is an easier rule to break than many investors may suspect.
The worst performing shares
Below are the ten shares with the lowest annual returns over the last 15 years.
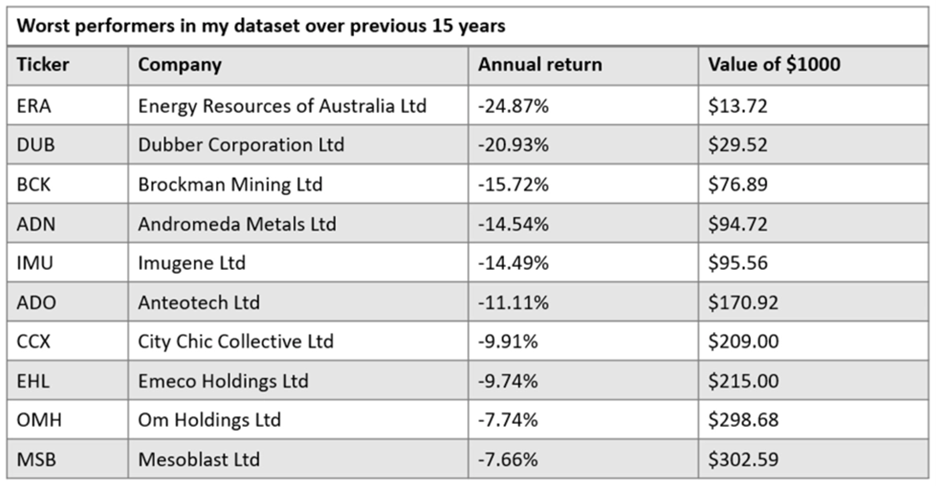 Source: Morningstar
If you have been holding uranium miner Energy Resources of Australia for the past 15 years you are a patient person. To have an annual return of close to -25% for a decade and a half is impressive.
What is remarkable about Energy Resources of Australia is the shares have doubled in the last year – and the long-term returns are still so poor.
The top performing shares
It is more interesting to look at which shares did well. Much like Bessembinder’s findings, the top performers generated a significant percentage of the total wealth generation of the 210 shares in my data.
The top ten performers were responsible for 56% of the total wealth generated. If you invested $1000 in each of the 210 shares and held for 15 years your $210,000 investment would be worth $1.8 million today. Just over $1 million would have been generated by the following list with Pro Medicus representing 27% of the total.
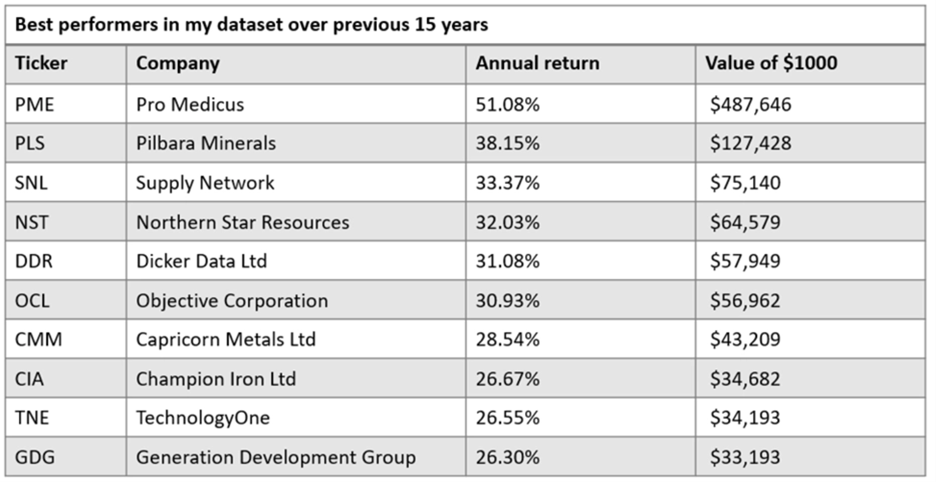 Source: Morningstar
How did popular shares do?
There are two sectors which dominate the market capitalisation weighted indexes in Australia – banks and miners. The fate of passive Australian indexes and many of the individual portfolios of investors in Australia are tied to the prospects of these two sectors.
For context, the Australian market has underperformed US market over the 15-year period I examined. While the ASX 300 returned 8.62% annually the S&P 500 returned 16.03% in Australian dollar terms. Much of this comes down to the performance of the miners and banks.
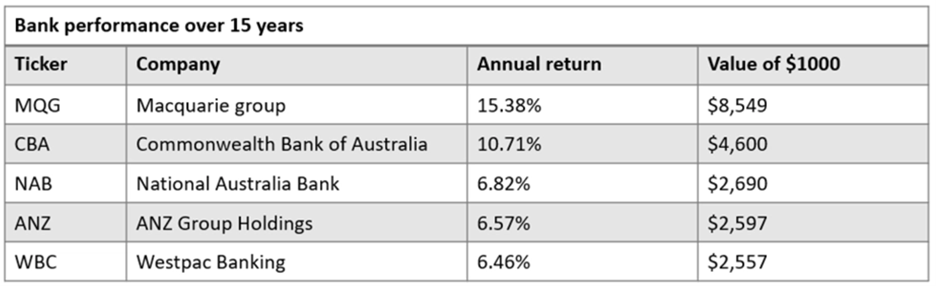
Below is the performance of the big four banks plus Macquarie over the last 15 years.
 Source: Morningstar
Macquarie and CBA outperformed the ASX 300 while the rest of the banks trailed the index return.
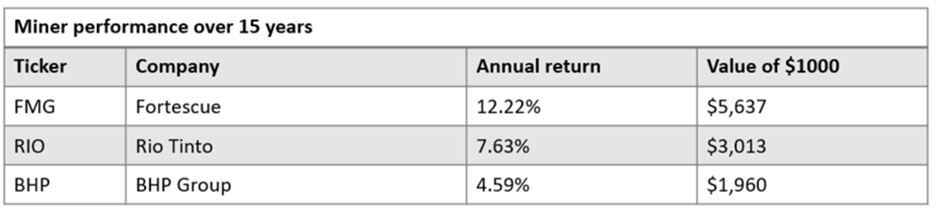
The results of the three largest miners are below.
 Source: Morningstar
Fortescue outperformed the ASX 300 while BHP and Rio trailed the index.
Final thoughts
Despite the limitations of the dataset I used for this exercise I think the conclusions from Bessembinder’s study largely apply to the Australian market. As a reminder these conclusions are:
- Most shares underperform the index and a meaningful percentage of individual shares result in poor outcomes for investors. If you hold too many of these shares you have no chance of beating the index.
- Most of the wealth generated from the share market comes from a small percentage of shares that are outsized winners. You can outperform the index even with a few outsized winners.
This seems obvious – avoid the big losers and find a few outsized winners. A prerequisite for investing in individual shares is to articulate how you are going to do this. This doesn’t mean you will be successful, but if you can’t explain your strategy in a sentence or two you have no chance of success.
To co-opt the Churchill quote I began with – the best argument against picking individual shares is a five-minute conversation with the average investor picking shares.
My guess is most people buying individual shares can’t explain their strategy. That is one reason why individual investors often achieve such poor outcomes. Luckily there is still a pathway to building wealth by investing passively.
Access this research and more at Morningstar. For a free four-week trial, click here.
All prices and analysis at 24 April 2026. This information has been prepared by Morningstar Australasia Pty Limited (“Morningstar”) ABN: 95 090 665 544 AFSL: 240 892.). Morningstar’s full research reports are the source of any Morningstar Ratings. The content is distributed by WealthHub Securities Limited (WSL) (ABN 83 089 718 249)(AFSL No. 230704). WSL is a Market Participant under the ASIC Market Integrity Rules and a wholly owned subsidiary of National Australia Bank Limited (ABN 12 004 044 937)(AFSL No. 230686) (NAB). NAB doesn’t guarantee its subsidiaries’ obligations or performance, or the products or services its subsidiaries offer. This material is intended to provide general advice only. It has been prepared without having regard to or taking into account any particular investor’s objectives, financial situation and/or needs. All investors should therefore consider the appropriateness of the advice, in light of their own objectives, financial situation and/or needs, before acting on the advice. Past performance is not a reliable indicator of future performance. Any comments, suggestions or views presented do not reflect the views of WSL and/or NAB. Subject to any terms implied by law and which cannot be excluded, neither WSL nor NAB shall be liable for any errors, omissions, defects or misrepresentations in the information or general advice including any third party sourced data (including by reasons of negligence, negligent misstatement or otherwise) or for any loss or damage (whether direct or indirect) suffered by persons who use or rely on the general advice or information. If any law prohibits the exclusion of such liability, WSL and NAB limit its liability to the re-supply of the information, provided that such limitation is permitted by law and is fair and reasonable. For more information, please click here.