The three big events impacting markets today
Andrew Mitchell | Ophir Asset Management
Share markets generally had a pretty good February.
But wait, didn’t the S&P500 fall last month?
It did. It was down -0.8%. That’s its first negative total return month since the Liberation Day stinker back in April 2025.
But that’s just what was visible at the surface.
If we look deeper, the US share market in February was dragged under by the dead weight of the Magnificent 7 (Amazon, Apple, Google, Meta, Microsoft, Nvidia, Tesla). As a collective group, the Mag 7 slumped -7.3%.
But what if we remove the distorting effect of the Mag 7’s gigantic size? Well, on an equal weighted basis – where all 500 companies instead get a 0.2% weight each – for the month, the S&P500 was actually up +3.6%!
Most other major markets were also up, including
- Australia (ASX200, +4.2%)
- Europe (MSCI Europe, +4.1%)
- The UK (FTSE 100, +7.0%)
- Japan (Nikkei, +10.4%).
But then in early March, markets were rocked by the US/Israel attack on Iran that sent oil prices soaring and equities sharply lower.
We now have three big, overlapping forces that are creating rough seas and causing confusion for markets and investors:
- The new US/Israel v Iran war that kicked off at the end of February.
- The evidence (predating the war above) of a mid-cycle acceleration in US economic and earnings growth.
- A rotation in market leadership that has ended three years of large-cap growth-stock leadership by the Magnificent 7. This has been exacerbated by the fog hanging over software stocks from doomsday scenarios around the impact of agentic AI. We examined the “SaaSpocalypse” recently (see here) and will explore this dynamic further in a subsequent wire.
Let’s look at each in turn.
The war: How long will it last?
Despite the multiplicity of effects listed above, you could be forgiven for thinking that we are in a single variable market. When it comes to the direction of daily financial market moves in early March, the state of the US/Israel versus Iran war, and its impact on oil prices, seems to be the sole influence.
The reasons for the US (with Israel) initiating the war aren’t entirely clear but include:
- Stopping Iran from developing nuclear weapons.
- Destroying Iran’s ballistic missiles and military capabilities.
- Getting ahead of an imminent threat from Iran.
- The US being forced to join Israel in the first strikes so they didn’t suffer greater retaliatory casualties; and
- To replace the current Iranian regime.
Without a clear rationale, however, it’s hard to understand where the finish line might be and whether the war will be over in days, weeks, months or even longer (Iraq/Afghanistan anyone?).
The most obvious financial market impact of the war has been the stratospheric rise in the oil price after the Iran-controlled Strait of Hormuz was effectively shut down.
Some 20 million barrels a day of crude oil flow through the Strait each day – or about 20% of total daily global oil consumption. That’s one important choke point!
That disruption caused the oil price (WTI) to shoot up intraday on the 9th of March to just shy of USD$120 a barrel. From the start of the year, the oil price has more than doubled.
If we use closing day prices, at writing, the oil price jump is almost equal to the post-1980 record rise seen in the first Gulf War in 1990.
In uncharted (oil) territory
While the first Gulf War may take the record (so far) for the largest percentage jump in the oil price since 1980, today’s war has seen the fastest – one week in early March recorded the biggest weekly jump in the oil price ever!
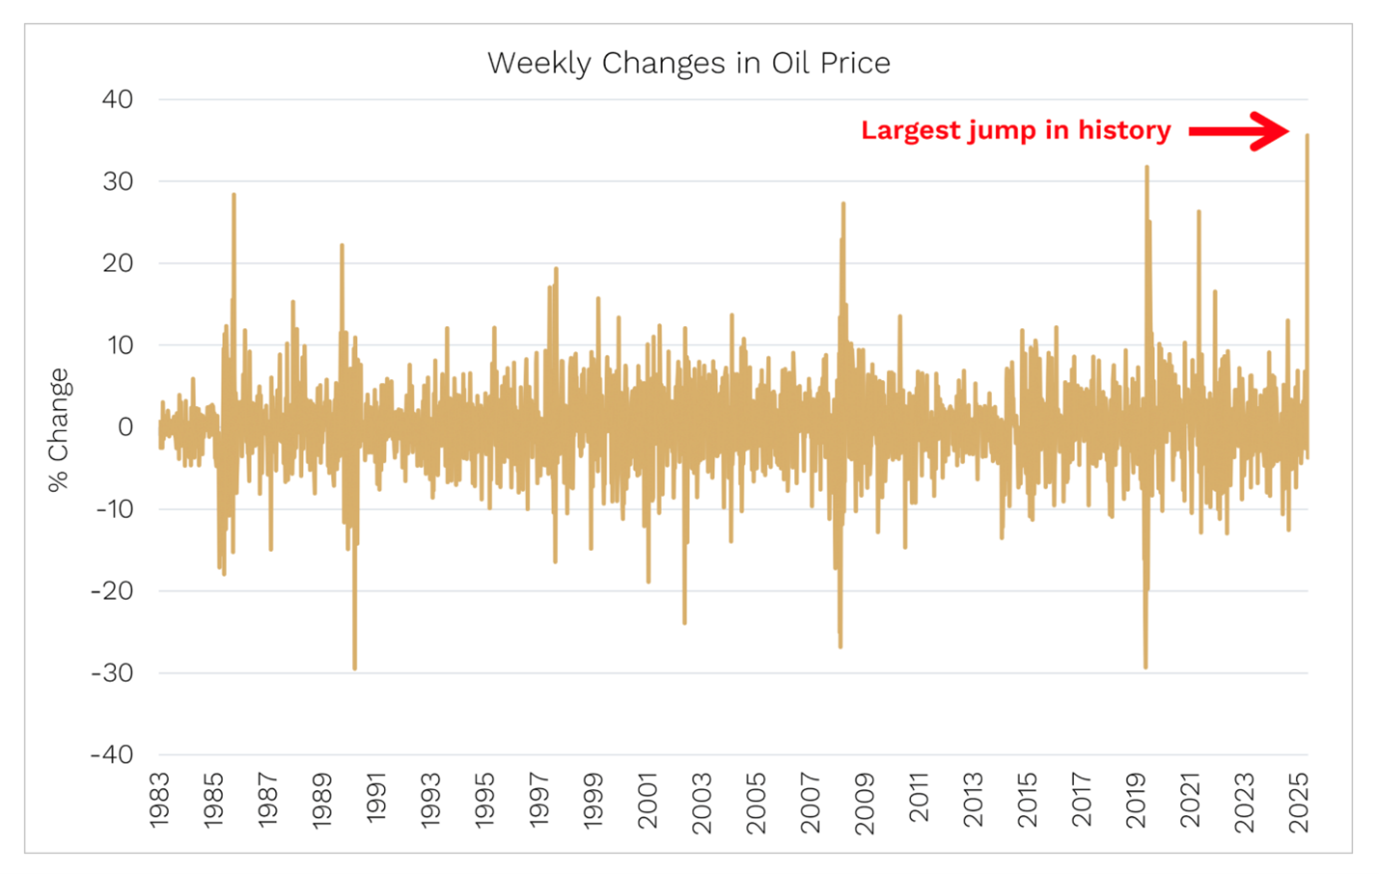
Source: Ophir, Bloomberg.
Just how dangerous is this situation?
Here are the three things that stand out to us from past oil spikes caused by geopolitical events:
- The pattern is pretty consistent. Across six major geopolitical shocks – from the Iran-Iraq War in 1980 to Russia’s invasion of Ukraine in 2022 – oil prices often spike hard and fast … they then give the gains almost all back.
- The current Iran shock is one of the most violent early moves we’ve seen. A near 60% spike in a few trading days puts the US & Israel conflict firmly near the top of the pack for speed and magnitude of the initial oil price reaction. Dramatic? Yes. Unusual? Only if it continues on from here.
- The median tells us what to expect from here. Oil prices historically fell back to pre-shock levels in approximately 4-5 months. In the chart below, if history rhymes, the spike is largely done.
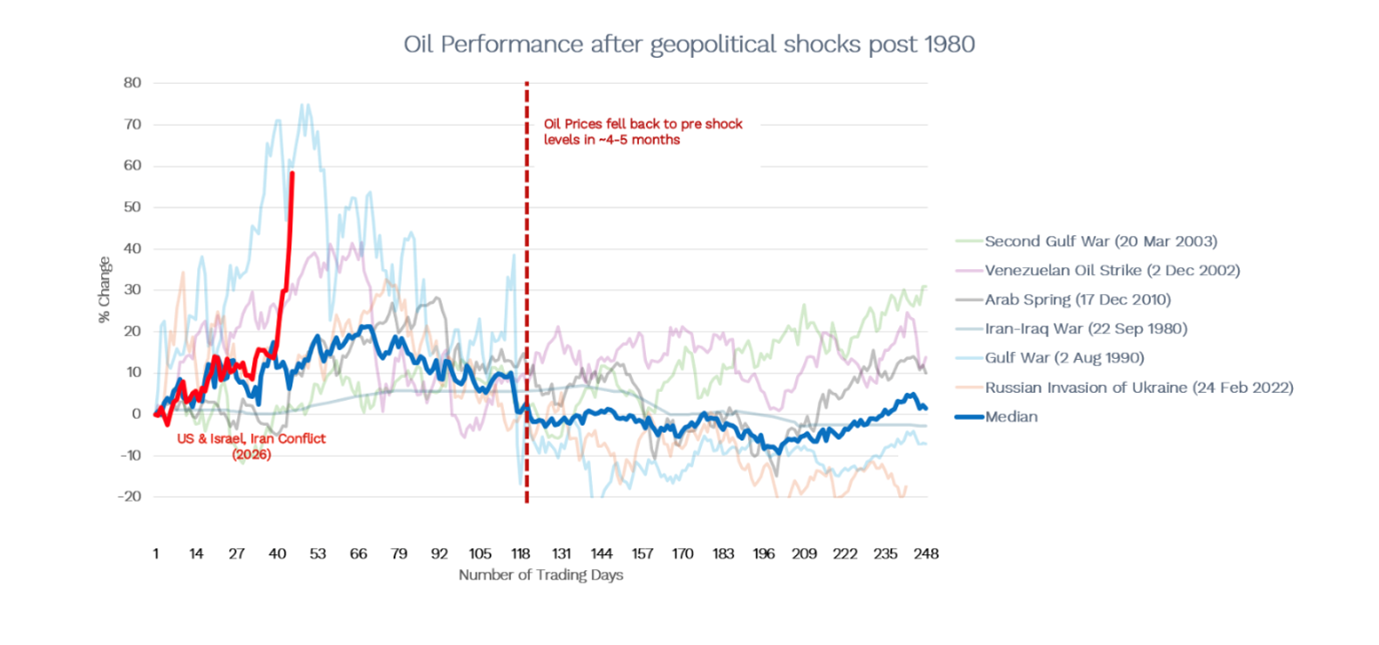
Source: Bloomberg. Ophir.
So while investors are worried about a prolonged disruption, history suggests that disruptions are temporary.
The most important factor is not how high oil prices go, but for how LONG they stay high.
The question we are asking ourselves now is: Is Iranian supply actually off the market this time? Or is the oil price spike just a fear premium?
If fears around the impact of the war on Iran’s oil supply are just that, fears, then we can use the median pathway of 4-5 months for prices to fall back to pre-shock levels as our roadmap.
We think US President Donald Trump will ultimately be persuaded to back down from the war if that is the only means to sustainably get the oil price lower.
Trump is facing a very important mid-term election this year and he won’t want to be adding cost pressures to consumers at the petrol pump or through rate hikes to combat oil price-induced higher inflation.
The playbook from past shocks such as this suggests they tend to see short-term, mean-reverting oil price spikes, which creates short-term negatives for equities, but then equities tend to bounce back over the next 3-6 months.
Unless the Trump Administration wants to perform a coup de grâce on its domestic economy, we suspect it will avert the worst-case outcomes on the oil and share markets.
And it seems the market agrees. Futures markets at present have the oil price (WTI) back down below USD$70 a barrel by the end of this year and dropping rapidly over the next few months.
A Deep Breadth – at last
What does the changing underlying structure of the market and leadership mean for our space and the recent outperformance of small-cap stocks?
In our last couple of Letters ( & ), we highlighted how breadth had been returning to global equity markets, particularly the US share market. For the first time in years, small-cap stocks have outperformed large caps more durably.
This has happened because the lagged impact of Federal Reserve rate cuts, along with household and business tax cuts in the US, broadened economic and corporate earnings growth, diminishing the reliance on Mag7-related AI capital expenditure.
There are macro indicators we are watching that are giving us confidence that this broadening has durability.
First one caveat. The following presumes that the global oil supply issues caused by the Iran war will be resolved soon. As we highlighted, there is a good reason to expect this to occur, but it’s not written in stone.
Market breadth – and the outperformance of small caps – is intimately tied with the business cycle, which moves in years, not days or weeks, and follows a typical pattern:
- They start with lower inflation and/or softer labour market data.
- That’s followed by central banks lowering interest rates. (This is exactly what happened from 2023 through to today in the US.)
- Early business cycle data, such as mortgage applications, then start to improve.
- Then comes improving business activity (purchasing manager indices – PMIs).
- Followed by improving and broadening corporate earnings expectations.
The chart below illustrates the Institute of Supply Management’s (ISM) PMI of New Manufacturing Orders in dark blue and the breadth of S&P 500 company earnings revisions.
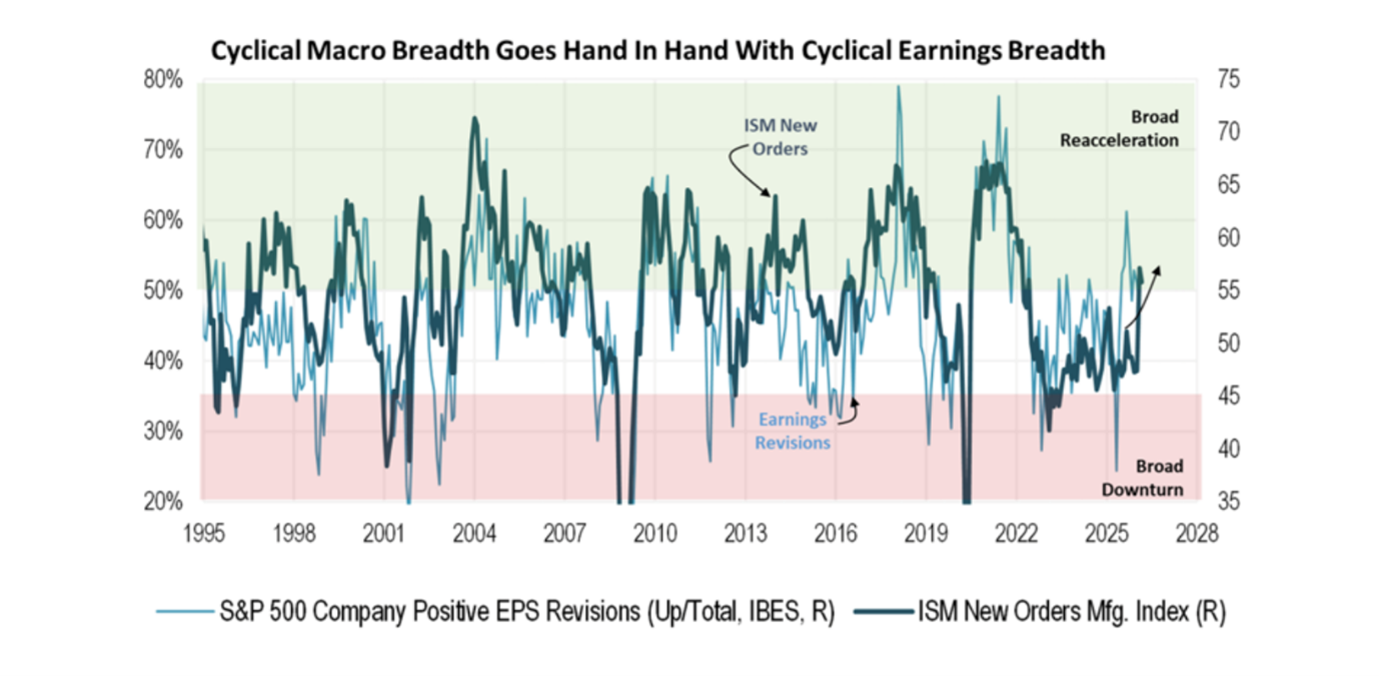
Source: Piper Sandler
As you can see, they move together in nice broad cycles lasting years and after a few years of both moving sideways.
They have recently both started trending upwards.
That same measure of PMI New Orders (now in orange below) also correlates quite nicely with the percentage of stocks in the US share market whose prices are trading above their 200-day moving average. (The more stocks trading above the moving average, the greater the market’s breadth).
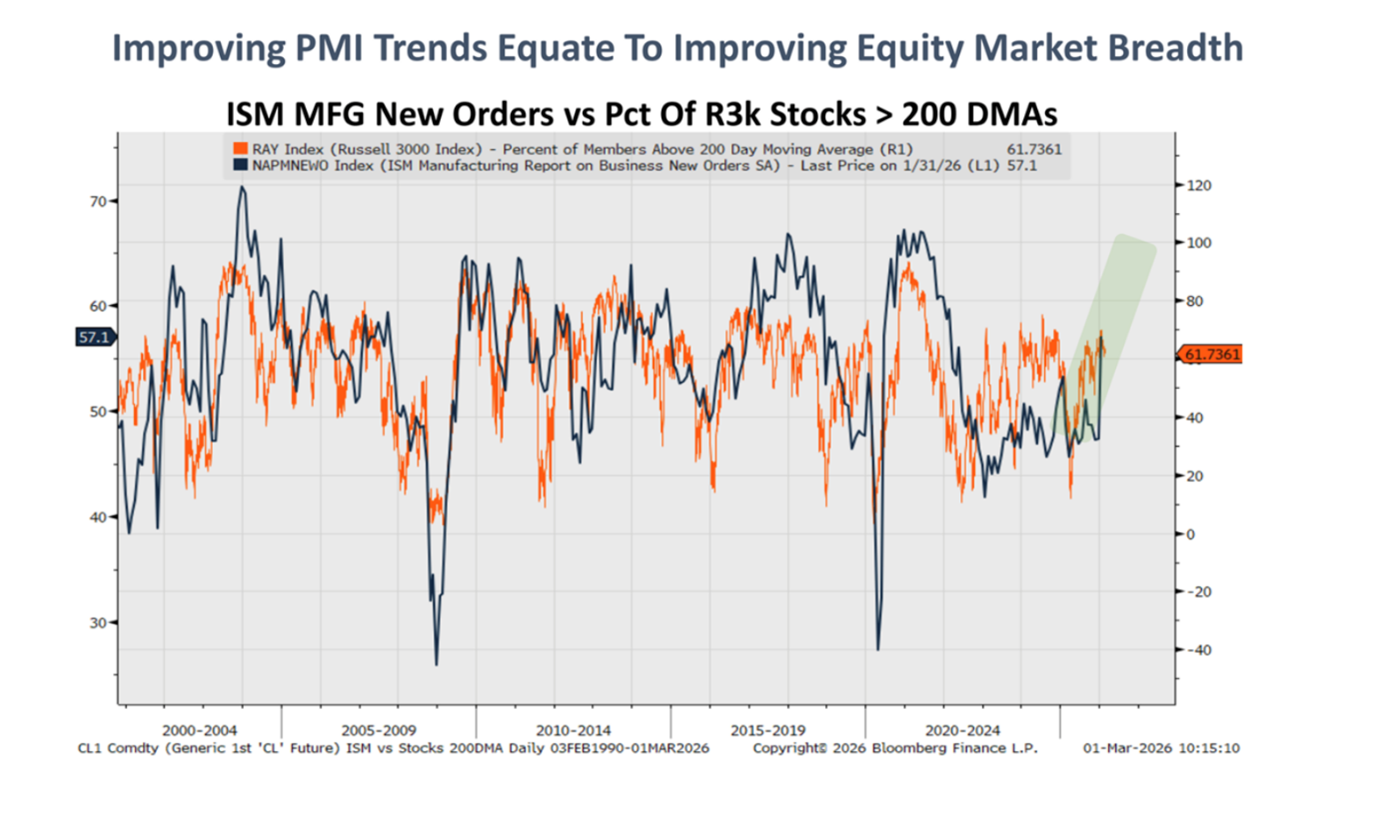
Source: Piper Sandler
In other words, as business activity picks up, so too does the number/breadth of stocks that are performing well.
Unless the current business cycle is knocked off course by an exogenous event (like a protracted war causing long last oil price disruption!), we can expect the trends that go along with it. That is, we can expect to see a continuation of broader equity market participation, with more stocks outperforming, including, importantly for Ophir and our investors, small-cap outperformance.
Should the oil price settle back towards its pre-war level in the near term, we expect equity markets to “go back to regular programming” that was in place early this year: increased breadth and with a tailwind behind the backs of small caps.
Learn how the industry leaders are navigating today's market every morning at 6am. Access Livewire Markets Today.
All prices and analysis at 18 March 2026. This document was originally published in Livewire Markets on 18 March 2026. This information has been prepared by Ophir Asset Management (ABN 88 156 146 717, AFSL No. 420082). The content is distributed by WealthHub Securities Limited (WSL) (ABN 83 089 718 249)(AFSL No. 230704). WSL is a Market Participant under the ASIC Market Integrity Rules and a wholly owned subsidiary of National Australia Bank Limited (ABN 12 004 044 937)(AFSL No. 230686) (NAB). NAB doesn’t guarantee its subsidiaries’ obligations or performance, or the products or services its subsidiaries offer. This material is intended to provide general advice only. It has been prepared without having regard to or taking into account any particular investor’s objectives, financial situation and/or needs. All investors should therefore consider the appropriateness of the advice, in light of their own objectives, financial situation and/or needs, before acting on the advice. Past performance is not a reliable indicator of future performance. Any comments, suggestions or views presented do not reflect the views of WSL and/or NAB. Subject to any terms implied by law and which cannot be excluded, neither WSL nor NAB shall be liable for any errors, omissions, defects or misrepresentations in the information or general advice including any third party sourced data (including by reasons of negligence, negligent misstatement or otherwise) or for any loss or damage (whether direct or indirect) suffered by persons who use or rely on the general advice or information. If any law prohibits the exclusion of such liability, WSL and NAB limit its liability to the re-supply of the information, provided that such limitation is permitted by law and is fair and reasonable. For more information, please click here.