January CPI still too high, broadly as expected
Taylor Nugent | Markets Research
Key points
- January CPI was 3.8% yoy (NAB 3.8%, consensus 3.7%)
- Monthly trimmed mean was 0.3% mom, as expected, but (just) rounded up to 3.4% yoy (NAB and Consensus 3.3%)
- The data confirm price pressures continue to run above the RBA’s target band, leaving them on track for additional tightening
- Our Q1 trimmed mean forecast remains at 0.8% qoq
Bottom Line
Today’s data was broadly in line with our expectations. Feeding in the January component level detail, our Q1 trimmed mean forecast remains at 0.8% qoq, although the risk skews higher to 0.9% qoq, where the RBA’s February forecast sits. We don’t think the detail in today’s data will pressure their rolling assessment much. A 0.8% qoq trimmed mean for Q1 (if realised) is consistent with our view for a hike to 4.1% in May. After a May hike, NAB sees the RBA on hold at 4.1% until late 2027, although we continue to see the risk skewed to the RBA doing a little more, or holding for longer at 4.1%.
The quarterly trimmed mean measure remains the RBA’s bellwether. Head of Economic Analysis at the RBA, Michael Plumb, reiterated that yesterday, saying “while we learn about the monthly data, for a time we will continue to focus on the quarterly data for forecasting and assessing underlying inflationary pressures.”
Detail
The main drivers of the January outcome were as expected. Electricity prices rose 18% mom as almost all the remaining electricity subsidy impact ended, but that was offset by a 3% mom decline in fuel prices and some base effects from a strong January rise in domestic travel a year ago dropping out.
On a 3-month average basis, monthly trimmed mean is annualising at 3.3%. Monthly trimmed was 0.31% mom, 5-7bp stronger than the previous 2 months. We noted that residual seasonality around holiday discounting likely weighed in November, and large housing components were on the soft side of their trend in December.
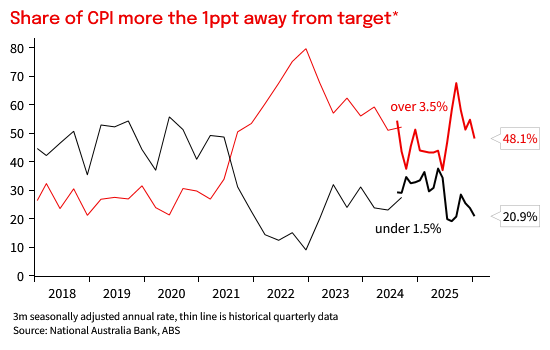
The share of the CPI basket with prices rising more than 3.5% annualised eased to 48% over the past 3 months, 20ppt below its recent peak in June, but still around 10ppt higher than in H1 2025. While it is encouraging that the share of prices running more than 1ppt above the 2.5% target midpoint has fallen back, so too has the share running below 1.5%, with fewer components showing either very high or very low inflation.
Rents (+0.33% mom) and New Dwellings (+0.4% mom) reverting to their trend rates in January as expected. Today’s outcome showed solid payback across some goods categories, particularly clothing and computing equipment. In general, components that were oddly soft in December saw some payback, including takeaway food (+0.8% mom after -0.2% mom) computing equipment (+3.6% mom after -3.3%) and insurance (+1.4% mom after +0.2%). Volatile clothing prices also recorded strong rises in the month, while across other goods component, furniture is on track to subtract from Q1 CPI.
Market services inflation was stronger than the last couple of months but did edge down in 3m average terms. Insurance (ex-health insurance) was strong in the month after a soft December print but has been accelerating in 3m average terms after cooling sharply into mid-2025. Restaurant meals and takeaway were stronger in the month, after a couple of more benign prints late last year. On the other side, auto repair and household services including hairdressing were more benign.
Food inflation was cooler in January. Grocery prices ex fruit and veg were 0.7% higher mom and 2.8% yoy, and volatile fruit ad veg prices fall a little on a seasonally adjusted basis in the month.
Health inflation was 3.6% yoy. There was a modest impact from policy shifts, with the seasonal rise in pharmaceuticals partially offset by the lower non-concessional PBS copayment.
Chart 1: Trimmed Mean Inflation, thin line is quarterly, thick line is monthly
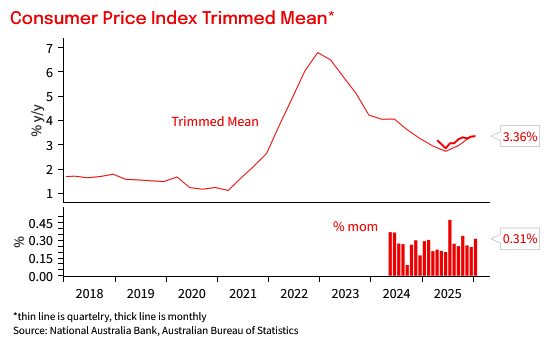
Chart 2: Headline inflation. Thin line is quarterly, thick line is monthly
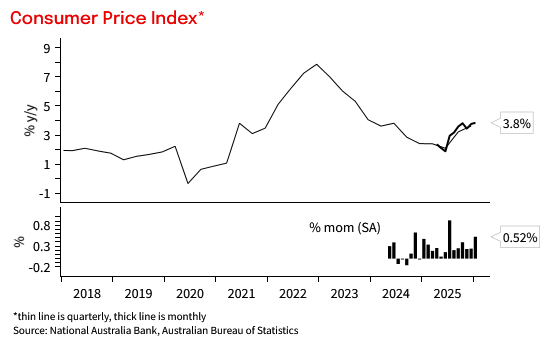
Chart 3: Core measures
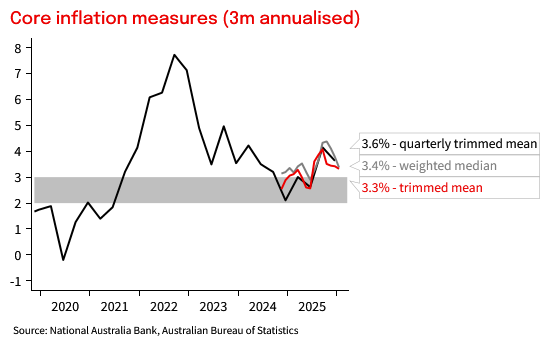
Chart 4: Contributions to CPI inflation
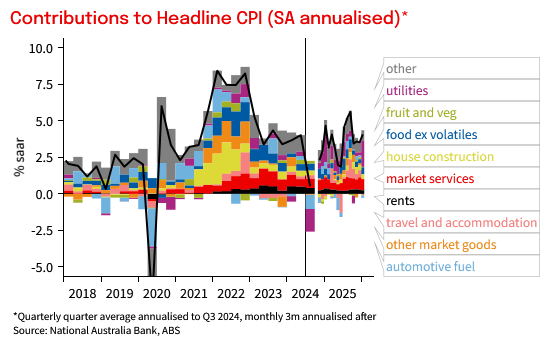
Table 1: CPI heat map. Shows 1- 3-, 6- and 12m annualised outcomes. Shading reflects how far inflation is above or below a benchmark of the 6 years to 2015 when inflation averaged around the mid-point of the target
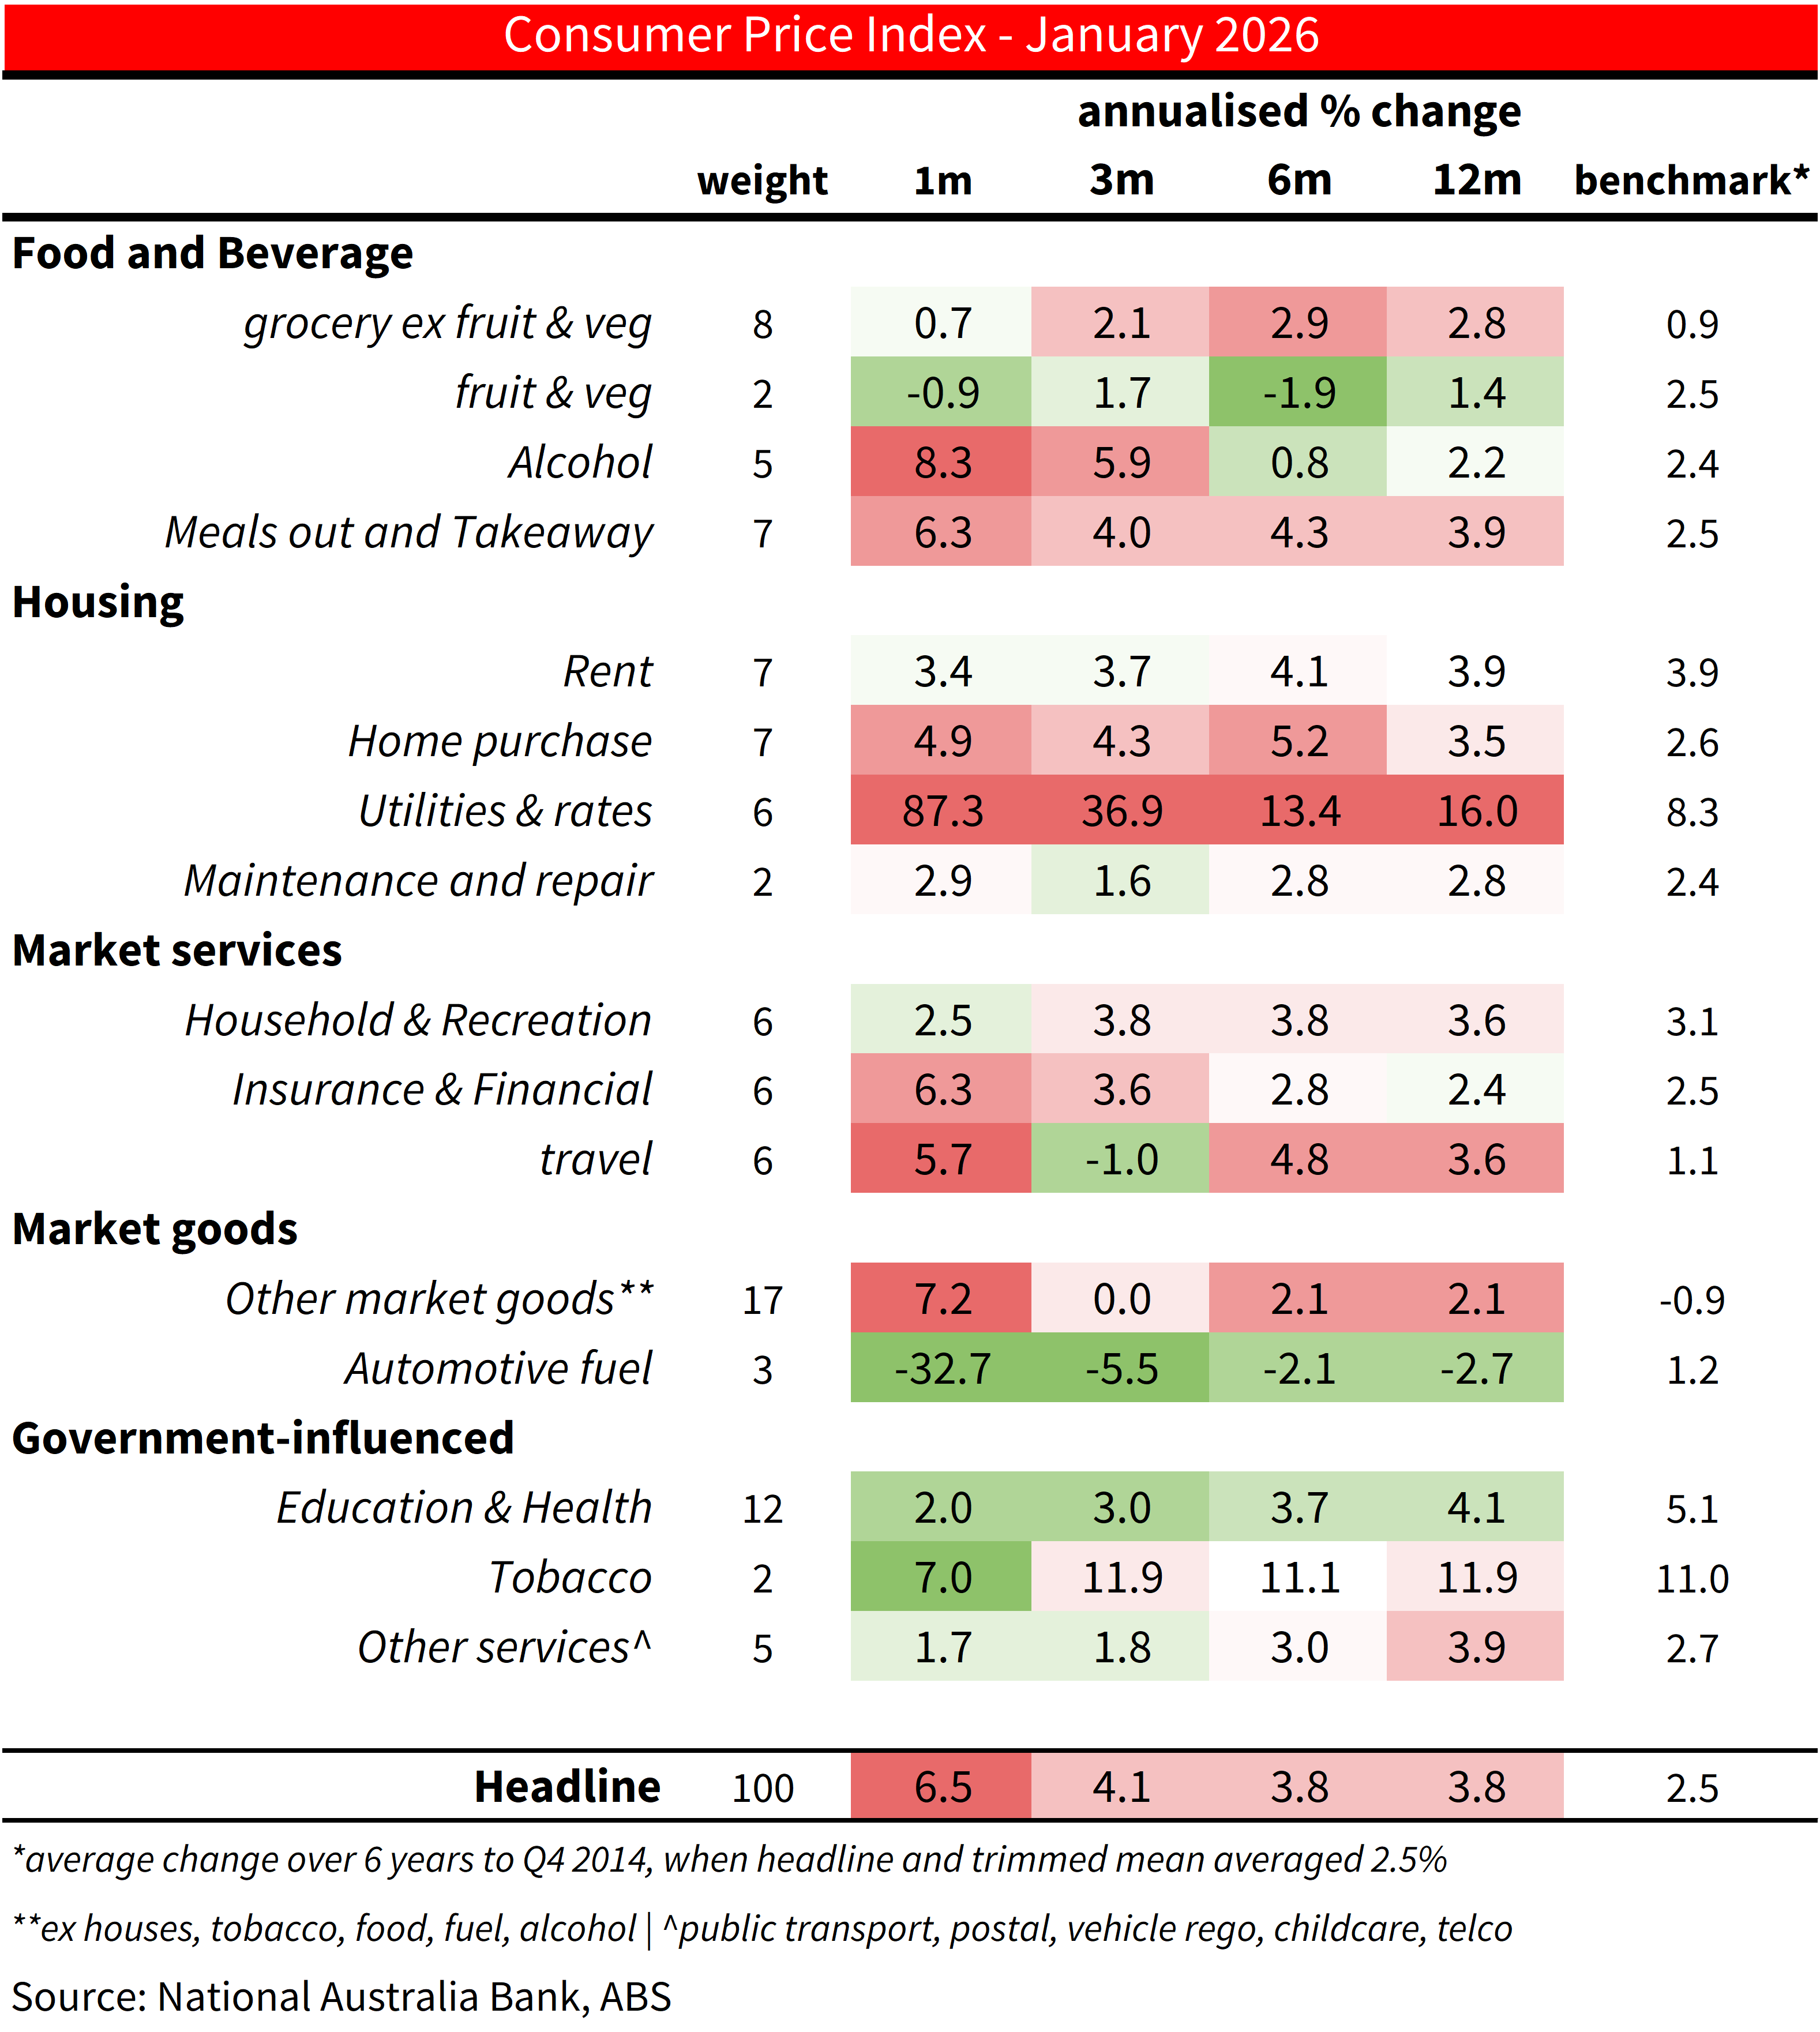
Table 2: CPI heat map. Shows 1- 3-, 6- and 12m annualised outcomes. Shading reflects how far inflation is above or below a benchmark of the 6 years to 2015 when inflation averaged around the mid-point of the target
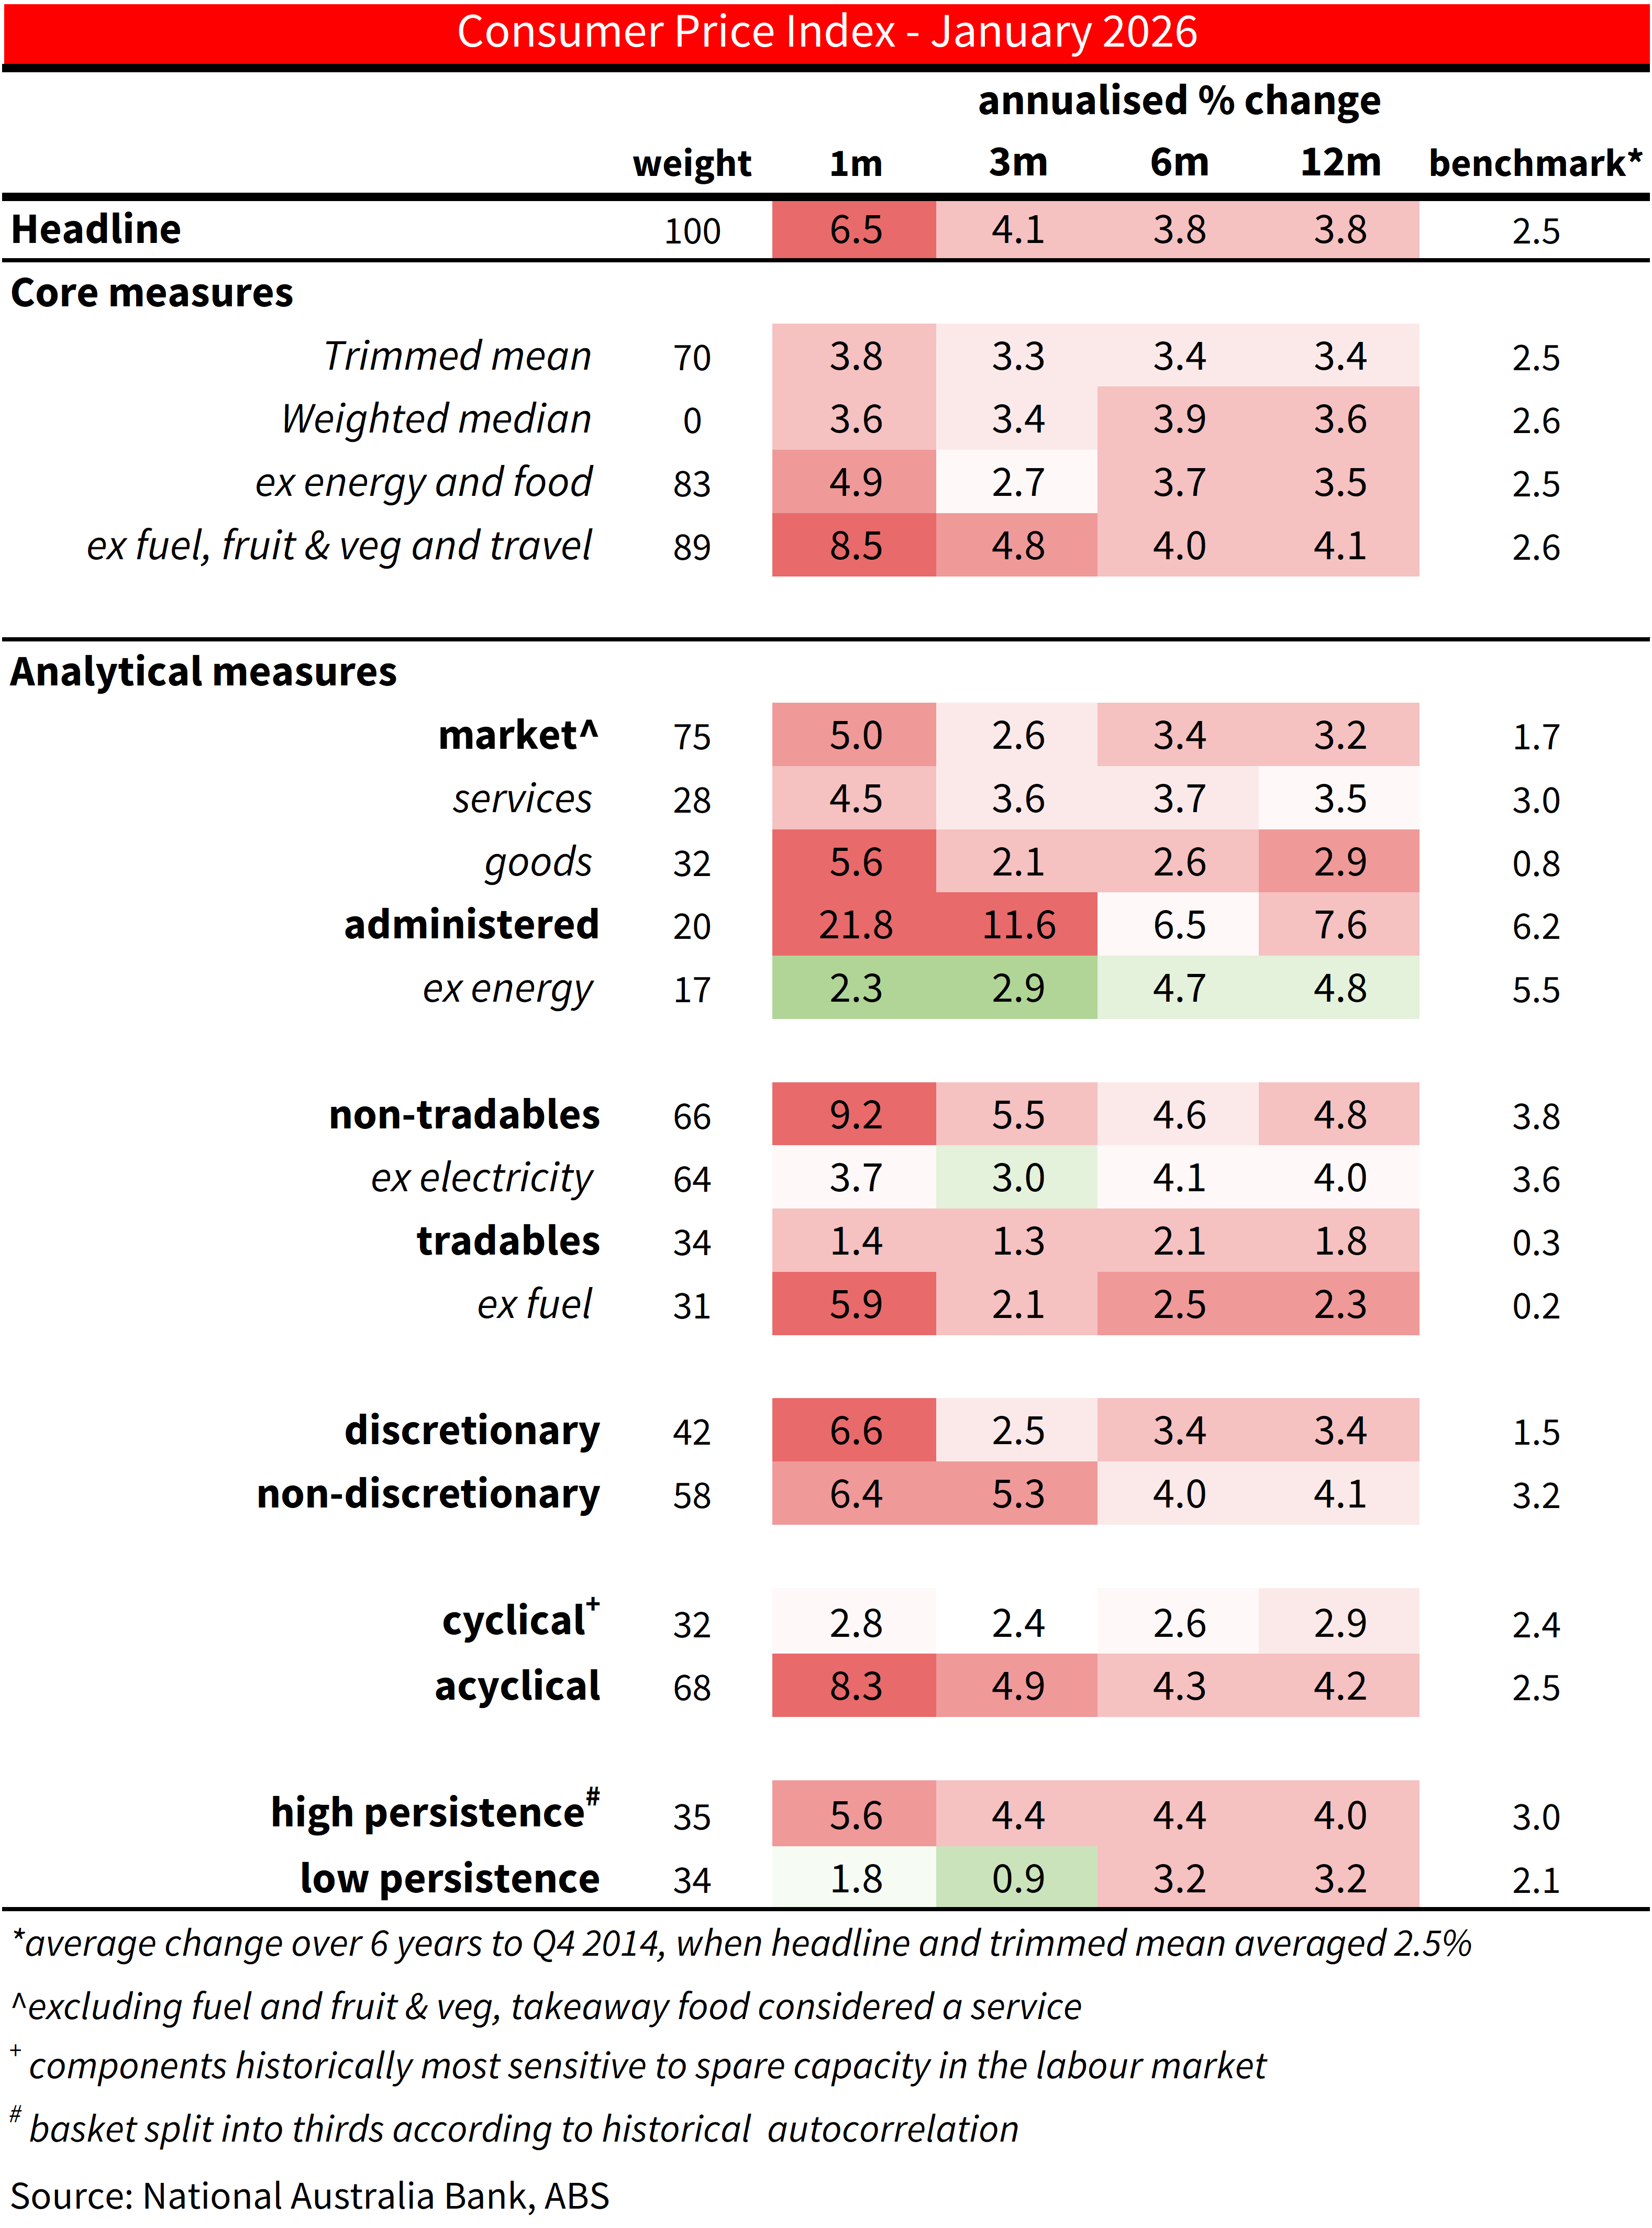
Chart 5: Market Services Inflation
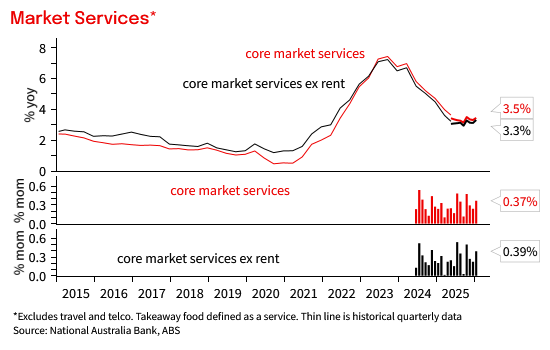
Chart 6: Tradables and non-tradables inflation
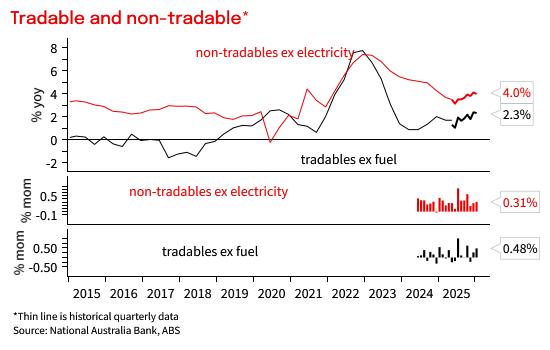
Chart 7: Administered prices inflation

Chart 8: Share of the CPI basket
This document has been prepared by National Australia Bank Limited ABN 12 004 044 937 AFSL 230686 ("NAB"). Any advice contained in this document has been prepared without taking into account your objectives, financial situation or needs. Before acting on any advice in this document, NAB recommends that you consider whether the advice is appropriate for your circumstances. NAB recommends that you obtain and consider the relevant Product Disclosure Statement or other disclosure document, before making any decision about a product including whether to acquire or to continue to hold it. Please Click Here to view our disclaimer and terms of use. Please Click Here to view our NAB Financial Services Guide.
All prices and analysis at 25 February 2026. This information has been prepared by National Australia Bank Limited ABN 12 004 044 937 AFSL 230686 ("NAB"). The content is distributed by WealthHub Securities Limited (WSL) (ABN 83 089 718 249)(AFSL No. 230704). WSL is a Market Participant under the ASIC Market Integrity Rules and a wholly owned subsidiary of National Australia Bank Limited (ABN 12 004 044 937)(AFSL No. 230686) (NAB). NAB doesn’t guarantee its subsidiaries’ obligations or performance, or the products or services its subsidiaries offer. This material is intended to provide general advice only. It has been prepared without having regard to or taking into account any particular investor’s objectives, financial situation and/or needs. All investors should therefore consider the appropriateness of the advice, in light of their own objectives, financial situation and/or needs, before acting on the advice. Past performance is not a reliable indicator of future performance. Any comments, suggestions or views presented do not reflect the views of WSL and/or NAB. Subject to any terms implied by law and which cannot be excluded, neither WSL nor NAB shall be liable for any errors, omissions, defects or misrepresentations in the information or general advice including any third party sourced data (including by reasons of negligence, negligent misstatement or otherwise) or for any loss or damage (whether direct or indirect) suffered by persons who use or rely on the general advice or information. If any law prohibits the exclusion of such liability, WSL and NAB limit its liability to the re-supply of the information, provided that such limitation is permitted by law and is fair and reasonable. For more information, please click here.