Q4 CPI confirms inflation stronger than RBA forecast
Taylor Nugent | Markets Research
Key points
- Q4 trimmed mean was 0.9% qoq and 3.4% yoy (NAB and Consensus 0.9%)
- 15bp higher than RBA’s November Q4 forecast
- The quarterly trimmed mean remains the most policy relevant measure
- NAB continues to expect the RBA will recalibrate policy to lean against inflation, seeing hikes in February and May.
- December Monthly CPI was 3.8% yoy (NAB 3.7%, consensus 3.6%)
RBA Implication
Q4 trimmed mean confirmed underlying inflation was stronger than the RBA was forecasting back in November. NAB continues to expect the RBA will lift rates in both February and May taking the cash rate to 4.1%. We see this as a modest recalibration policy to lean against too-high inflation amid a backdrop of strengthening private sector growth and little spare capacity in the economy.
Q4 Quarterly Trimmed Mean
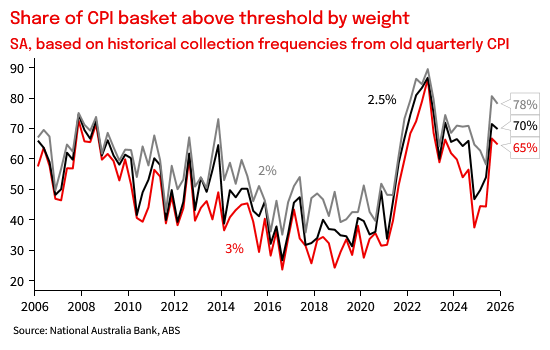
Q4 trimmed mean was 0.90% qoq and 3.35% yoy. That was above the RBA’s November SoMP forecast for 0.75%/3.16% and a realisation of the upside risk they had feared given the detail in the October and November Monthly CPI prints. Inflation in Q4 was once again broad-based, with consumer goods prices contributing a bit more than was evident in Q3, and housing and services inflation remaining elevated relative to H1 2025. On the old quarterly basis, 65% of the basket was annualising above 3% in Q4, above levels seen through 2023 and down only marginally from Q3.
The quarterly number is calculated based on the historical collection frequencies that were used in the old quarterly CPI and so doesn’t use all the information now available in the monthly release. This avoids the challenges with seasonal adjustment that plague the monthly and is maintains the well-established properties of the old quarterly series.
December Monthly CPI
CPI was 3.8% yoy in December (NAB 3.7% yoy, Consensus 3.6% yoy), up from 3.4% yoy in November, driven by base effects in domestic travel after a smaller-than-usual December gain in 2024, and by a rebound in car prices after black Friday discounting in November.
The monthly trimmed mean was 3.3% yoy (NAB and Consensus 3.3% yoy). One piece of more encouraging news, was the monthly trimmed mean increase of 0.23% mom, its slowest pace since June. It is still annualising above 3% on a 3m annualised basis.
Elsewhere in the detail
- Electricity prices were flat in the month, with no changes in rebate payments ahead of what will be a large increase in January on the expiration of the EBRF extension payments.
- Shelter inflation slowed in December, with both rents and new dwelling purchase costs up 0.2% mom, a little slower than their recent pace. Those are the 2 largest components in the CPI, so the the lower December outcome is encouraging, but the trend in both remains concerning and leading indicators of rents point to CPI rents continuing to run above overall inflation
- Markets Services inflation excluding rents was 0.23% mom, similar to its pace last month and holding above 3% on a year-ended basis. Meals out and takeaway, which was a notable driver of strength in Q3 CPI, has slowed in recent months, but household and recreation services have remained elevated.
- Market Goods inflation was supported by a sharp rebound in new car prices after black Friday discounting in November. Seasonal adjustment around end of year sales period remains an acute challenge, given most of these components have only a short back history.
- Medical and Hospital Services recorded another small monthly fall in December -0.5% mom, broadly as expected as a higher rate of bulk billing following the Government’s bulk billing reforms continued to flow through. It is a small share of the much large medical and hospital services expenditure component, which is worth about 5% of the basket and includes private health insurance costs, and as a result is a source of downward pressure on trimmed mean. This is likely to fade as a drag going forward, but if bulk billing rates continue to rise it will continue to place some modest downward pressure on trimmed mean.
Quarterly, based on historical collection frequencies from old quarterly CPI
Chart 1: Quarterly Trimmed Mean
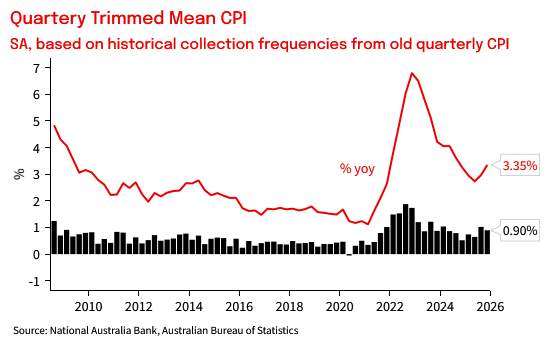
Chart 2: Quarterly CPI contributions. Calculated according to the collection frequency in the old quarterly CPI methodology to avoid seasonl adjustment challenges in the new monthly data
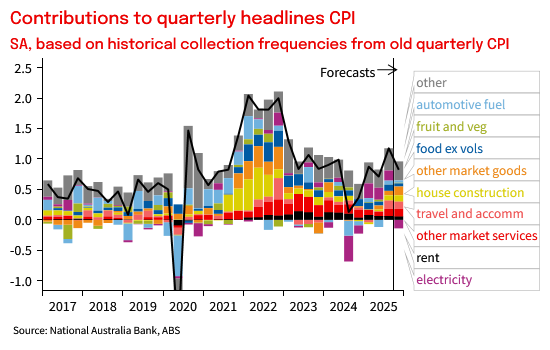
Chart 3: Share of the basket running above threshold on a quarterly annualised basis. Calculated according to the collection frequency in the old quarterly CPI methodology to avoid seasonal adjustment challenges in the new monthly data
Monthly CPI
Chart 4: Trimmed Mean Inflation, thin line is quarterly, thick line is monthly
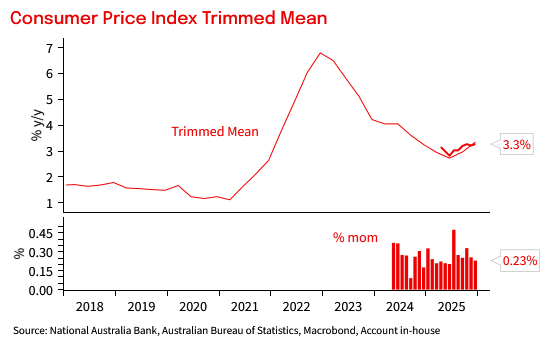
Chart 5: Headline inflation. Thin line is quarterly, thick line is monthly
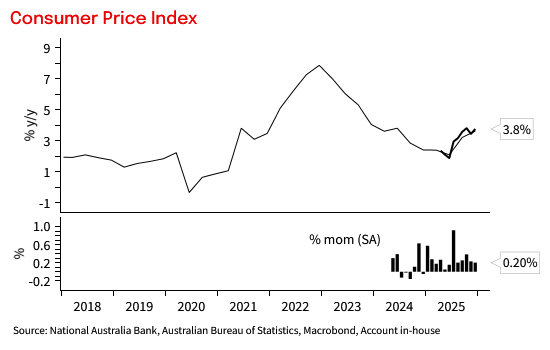
Chart 6: Core measures
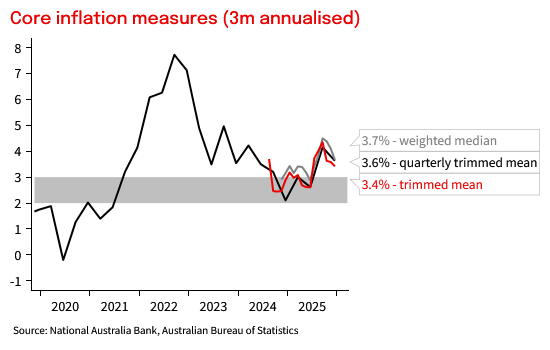
Chart 7: Contributions to Headline CPI inflation
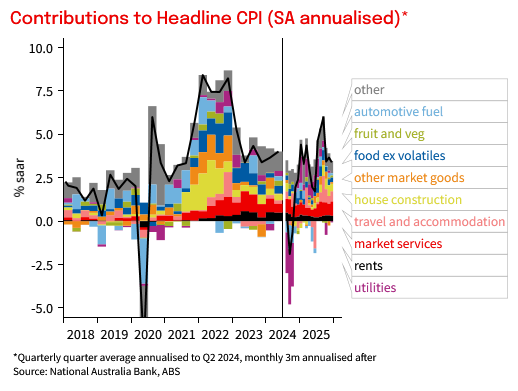
Table 1: CPI heat map with analytical measures. Shows 1- 3-, 6- and 12m annualised outcomes. Shading reflects how far inflation is above or below a benchmark of the 6 years to end 2014 when inflation averaged around the mid-point of the target
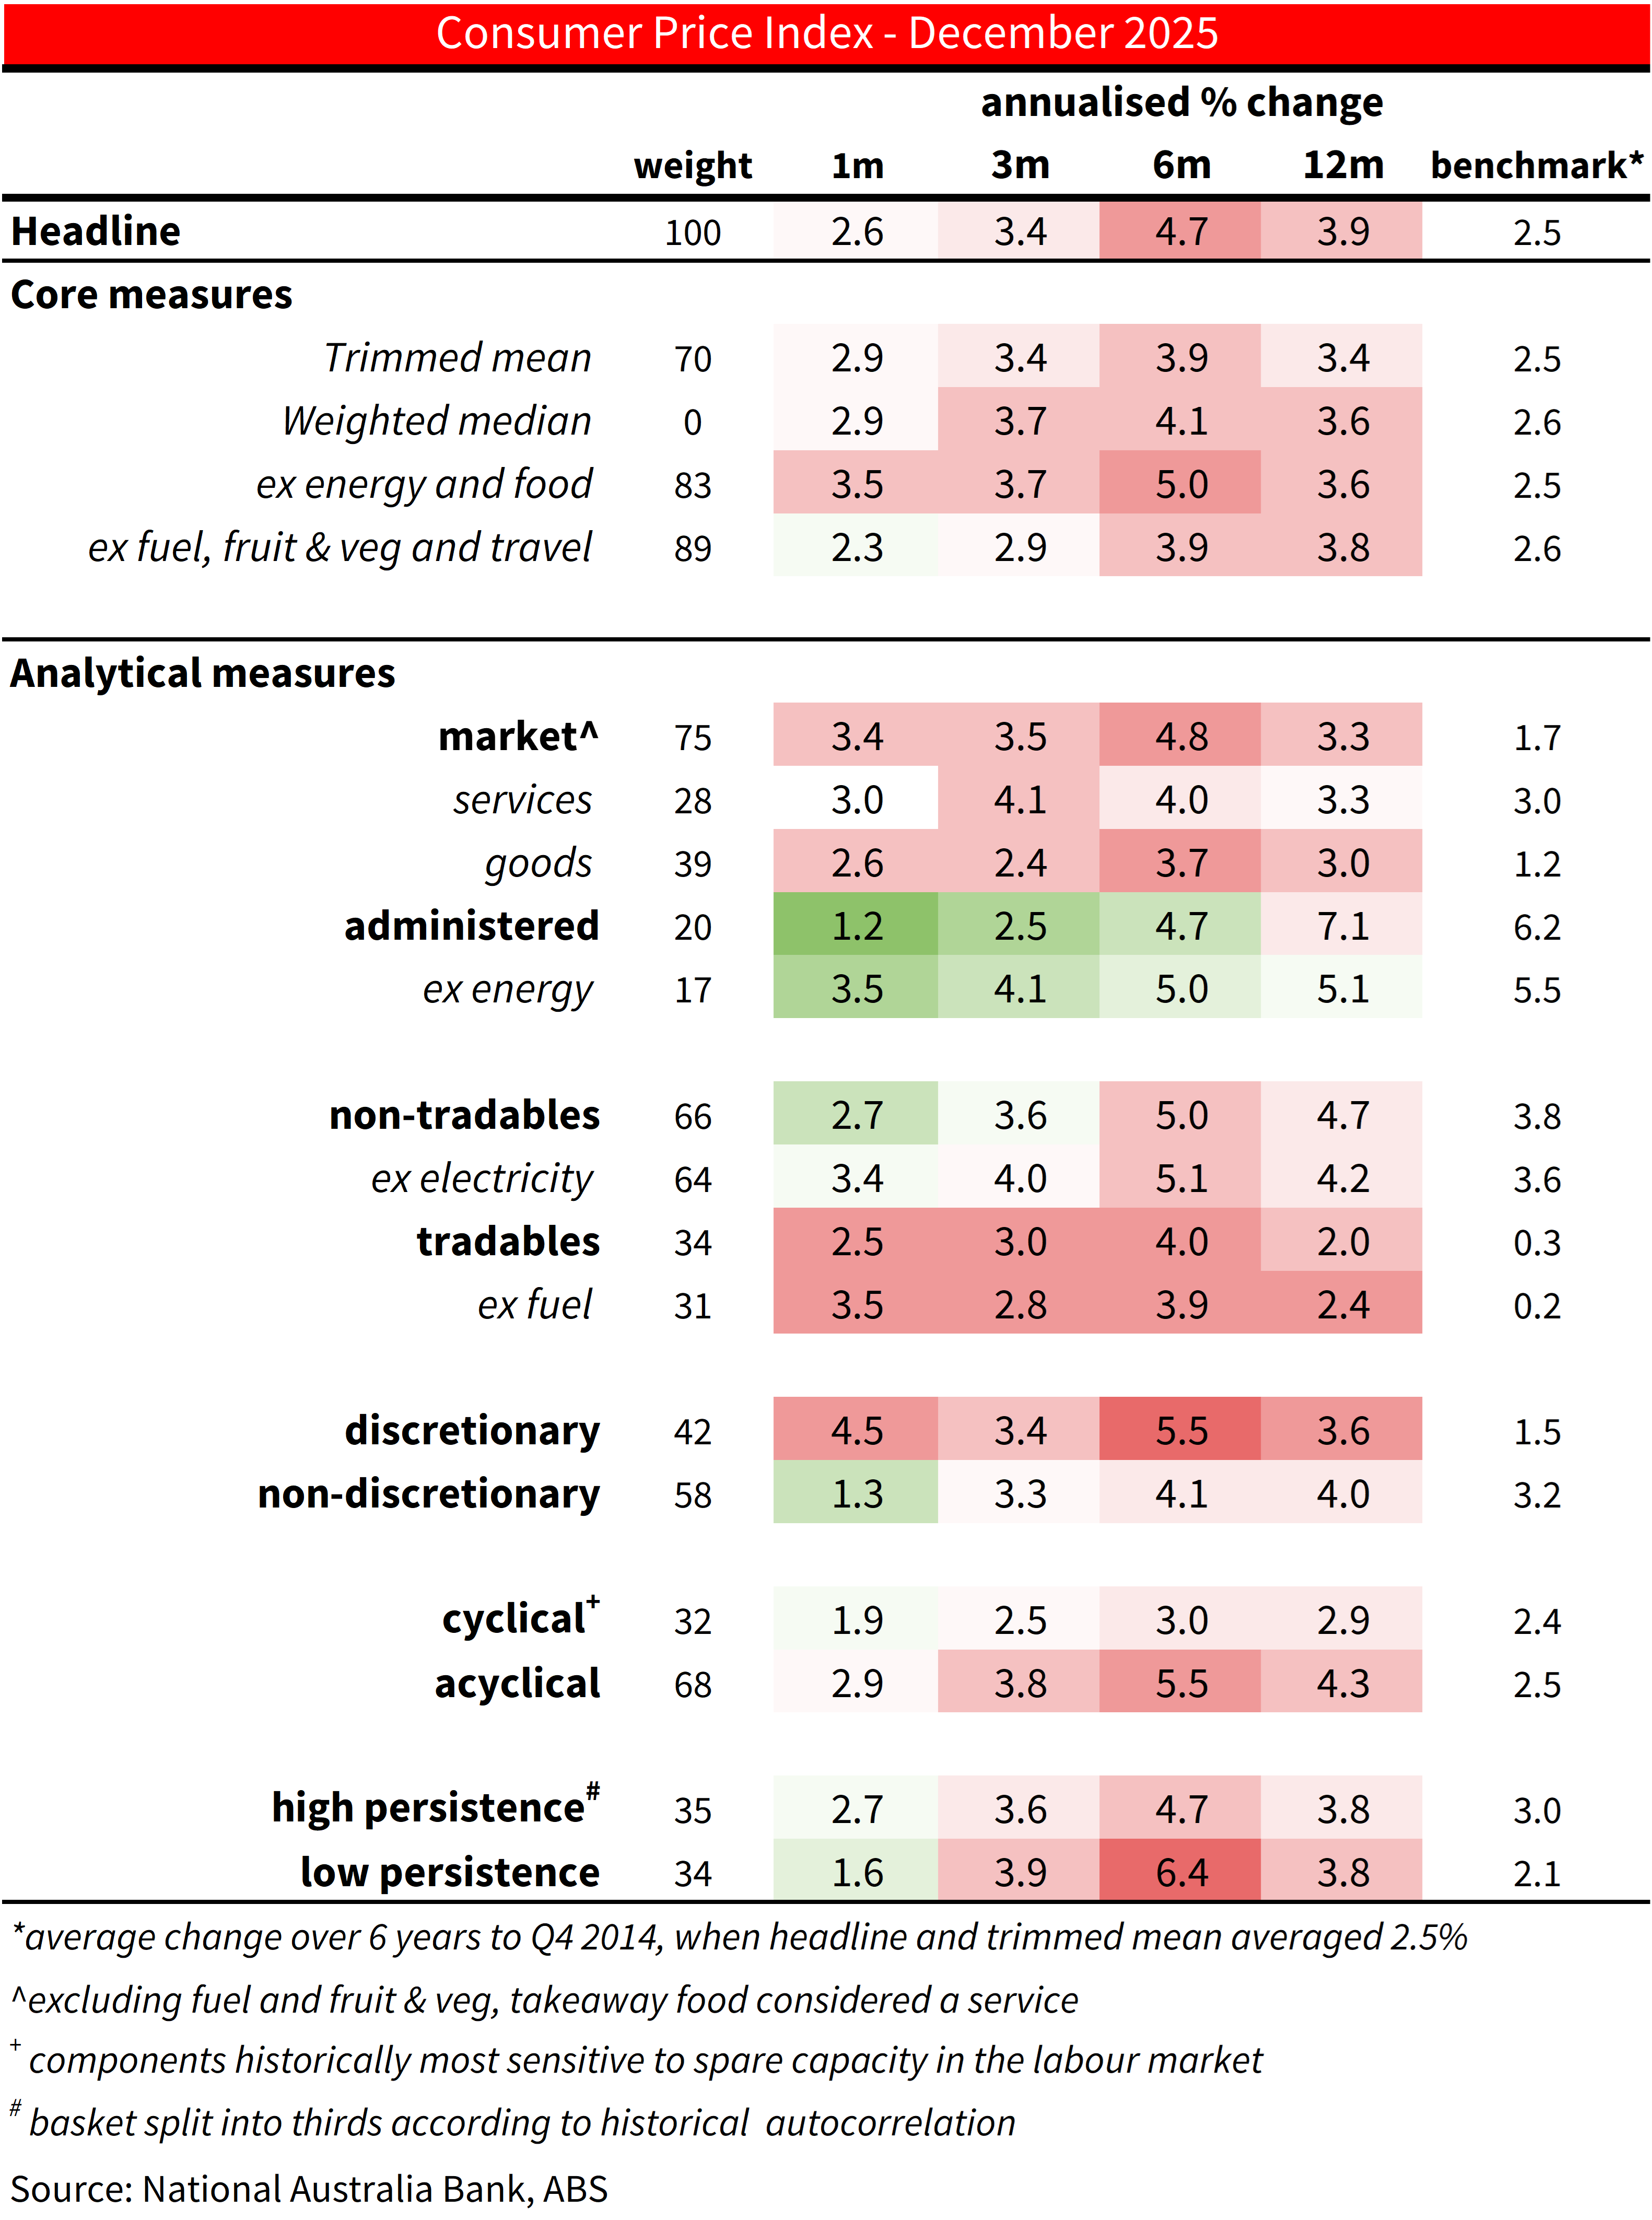
Table 2: CPI heat map by subcategory. Shows 1- 3-, 6- and 12m annualised outcomes. Shading reflects how far inflation is above or below a benchmark of the 6 years to end 2014 when inflation averaged around the mid-point of the target
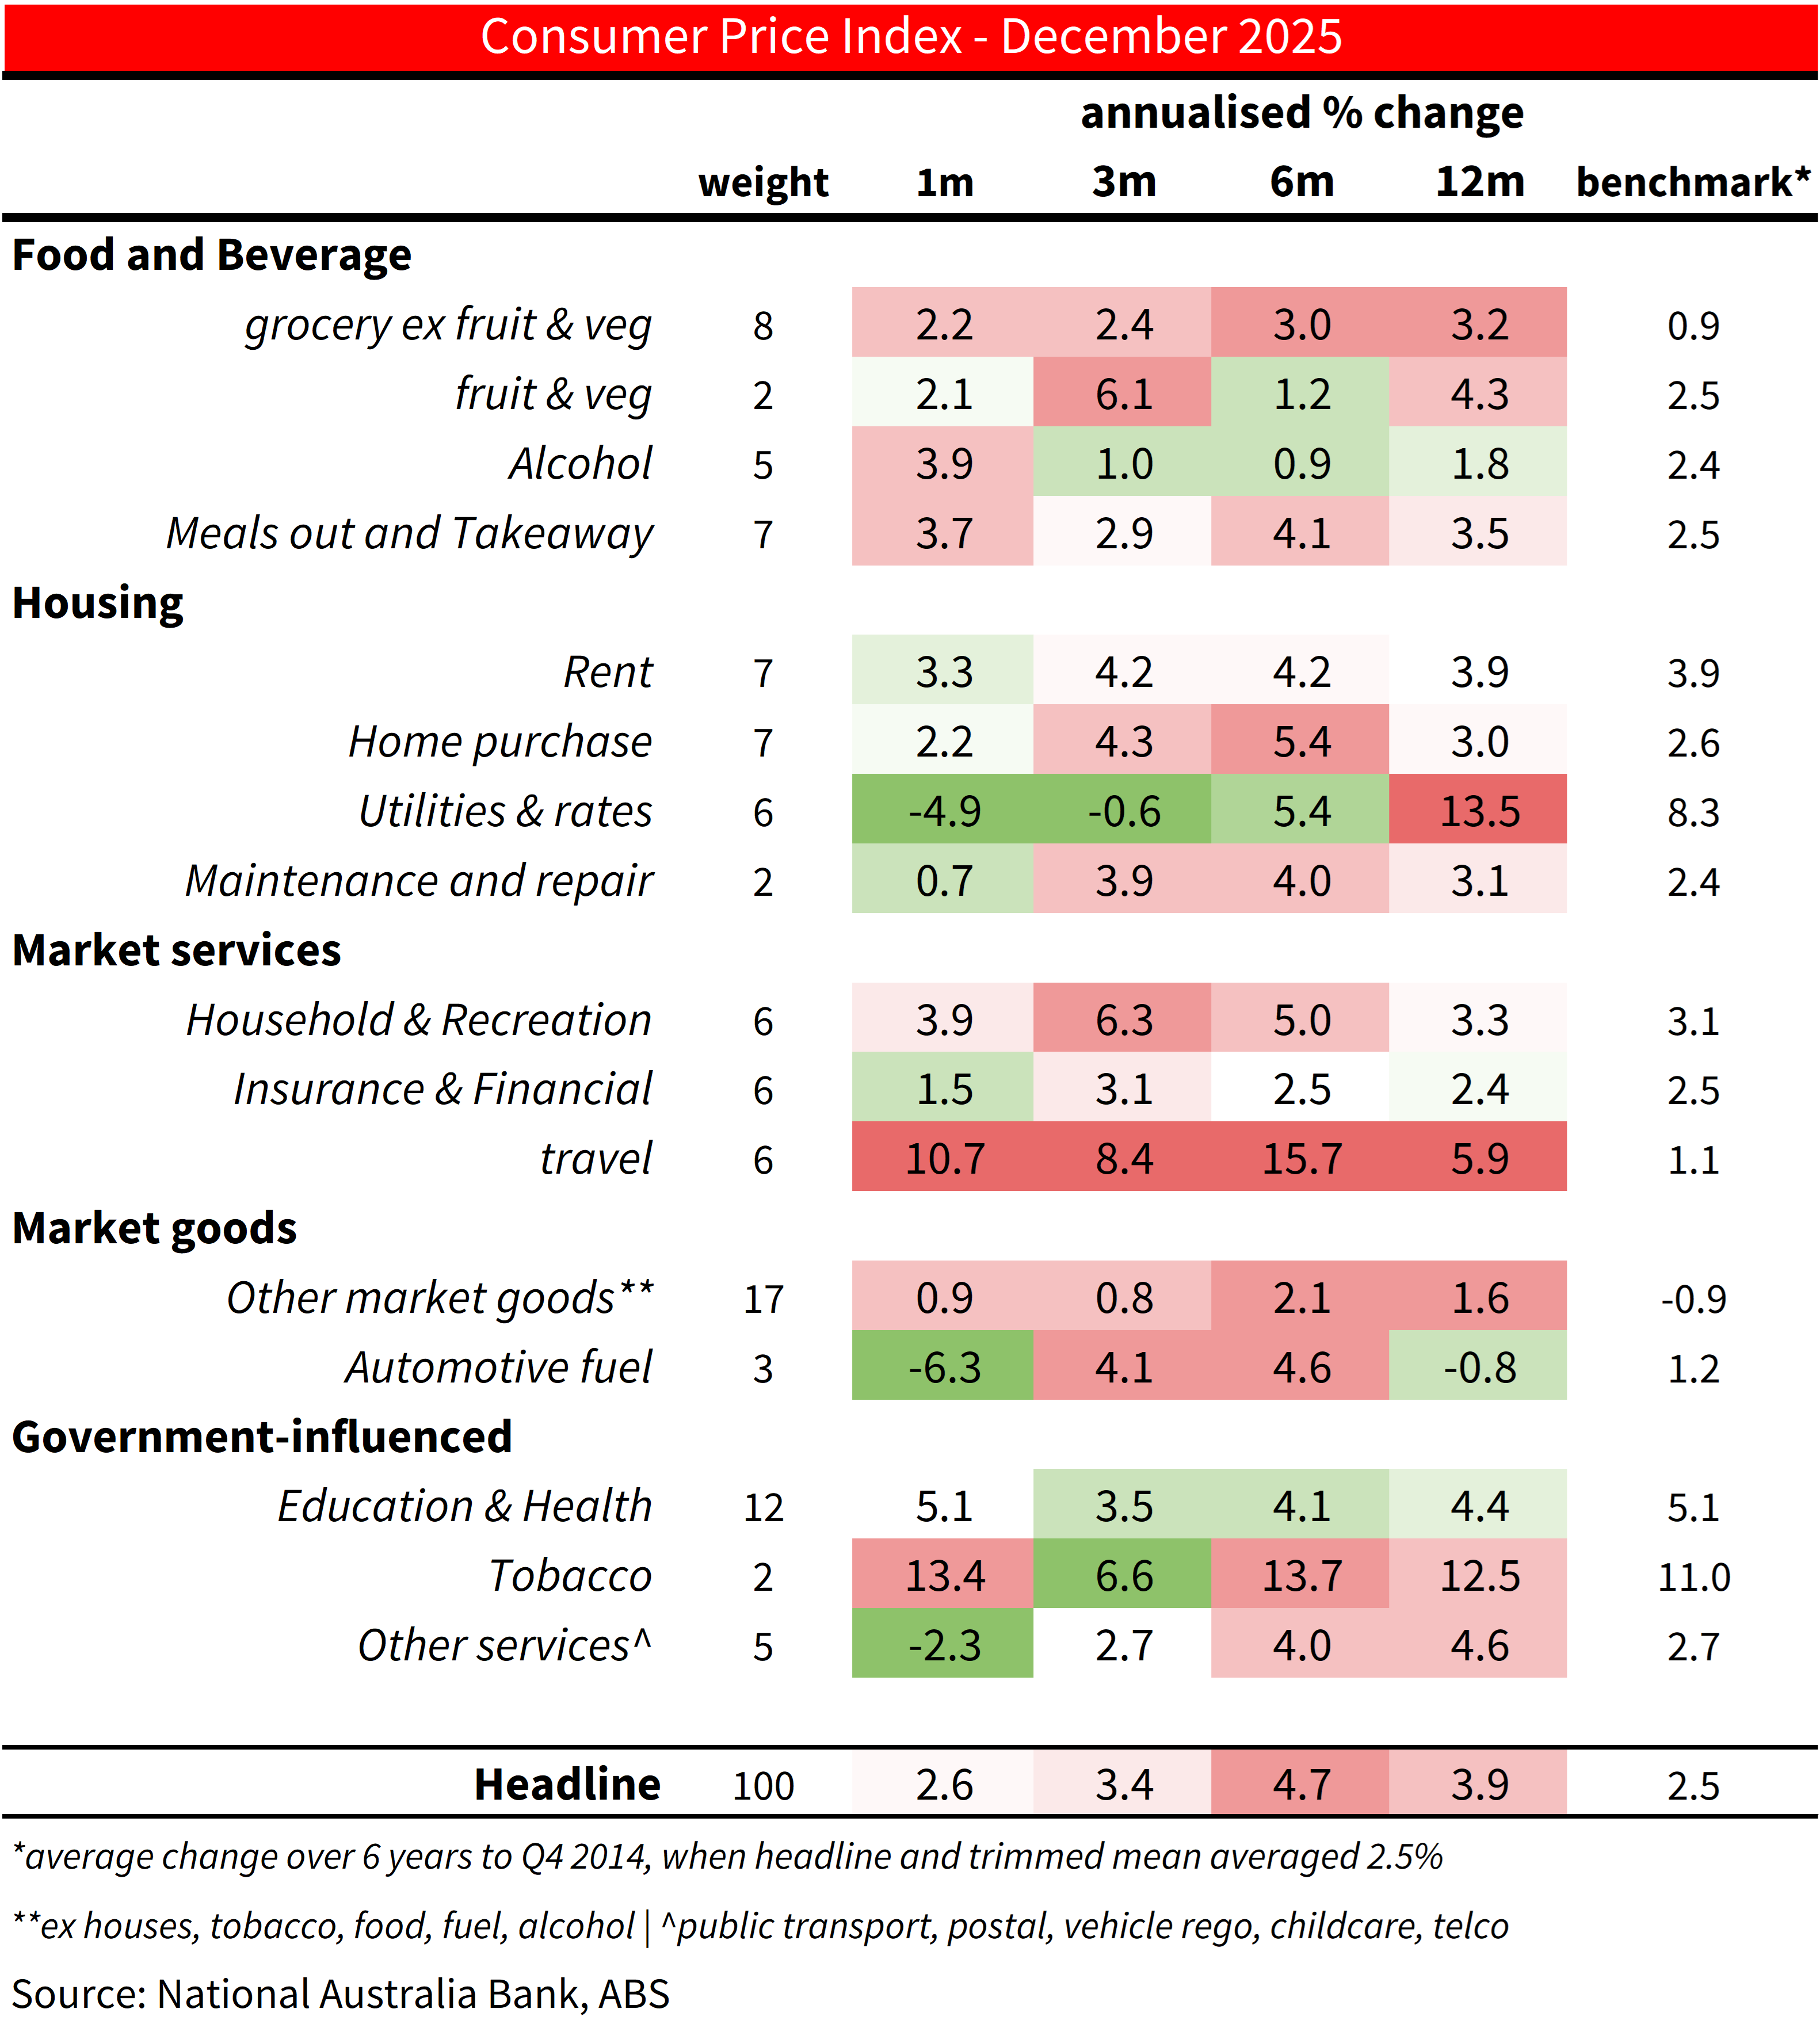
Chart 8: Administered services inflation
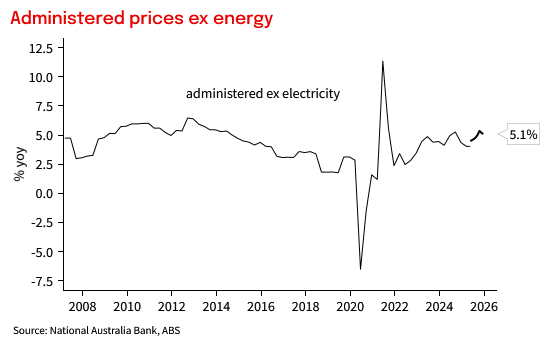
Chart 9: Market Services Inflation
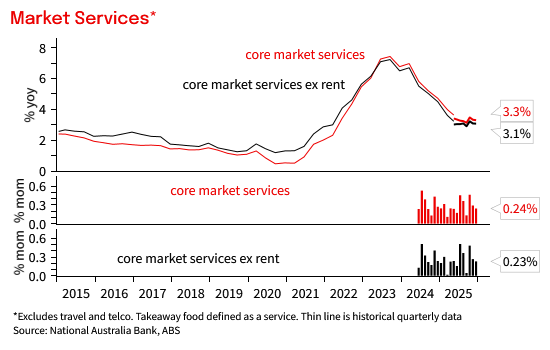
Chart 10: Tradable and Non-tradables inflation
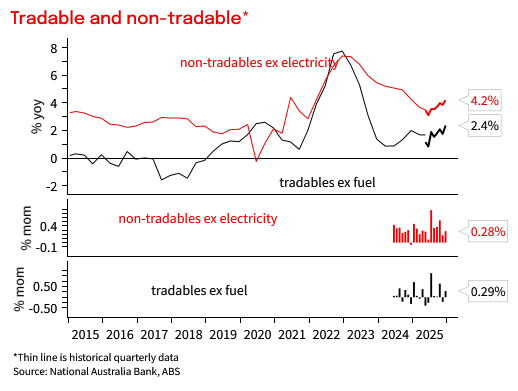
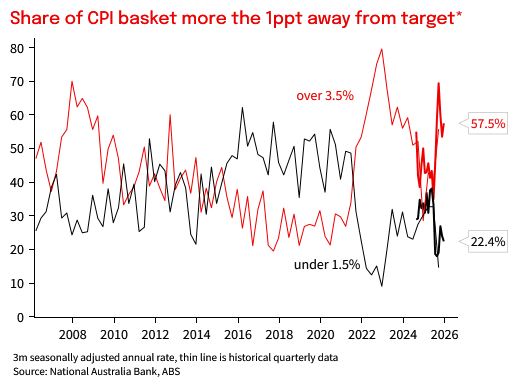
Chart 11: Share CPI basket more than 1ppt from target midpoint
Any advice contained in this document has been prepared without taking into account your objectives, financial situation or needs. Before acting on any advice in this document, NAB recommends that you consider whether the advice is appropriate for your circumstances. NAB recommends that you obtain and consider the relevant Product Disclosure Statement or other disclosure document, before making any decision about a product including whether to acquire or to continue to hold it. Please Click Here to view our disclaimer and terms of use. Please Click Here to view our NAB Financial Services Guide.
All prices and analysis at 28 January 2026. This information has been prepared by National Australia Bank Limited ABN 12 004 044 937 AFSL 230686 ("NAB"). The content is distributed by WealthHub Securities Limited (WSL) (ABN 83 089 718 249)(AFSL No. 230704). WSL is a Market Participant under the ASIC Market Integrity Rules and a wholly owned subsidiary of National Australia Bank Limited (ABN 12 004 044 937)(AFSL No. 230686) (NAB). NAB doesn’t guarantee its subsidiaries’ obligations or performance, or the products or services its subsidiaries offer. This material is intended to provide general advice only. It has been prepared without having regard to or taking into account any particular investor’s objectives, financial situation and/or needs. All investors should therefore consider the appropriateness of the advice, in light of their own objectives, financial situation and/or needs, before acting on the advice. Past performance is not a reliable indicator of future performance. Any comments, suggestions or views presented do not reflect the views of WSL and/or NAB. Subject to any terms implied by law and which cannot be excluded, neither WSL nor NAB shall be liable for any errors, omissions, defects or misrepresentations in the information or general advice including any third party sourced data (including by reasons of negligence, negligent misstatement or otherwise) or for any loss or damage (whether direct or indirect) suffered by persons who use or rely on the general advice or information. If any law prohibits the exclusion of such liability, WSL and NAB limit its liability to the re-supply of the information, provided that such limitation is permitted by law and is fair and reasonable. For more information, please click here.