November CPI marginally less alarming but still too high
Taylor Nugent | Markets Research
Key points
- Headline CPI at 3.4% (NAB and Consensus 3.6%)
- Downside driven by car discounting and volatile travel
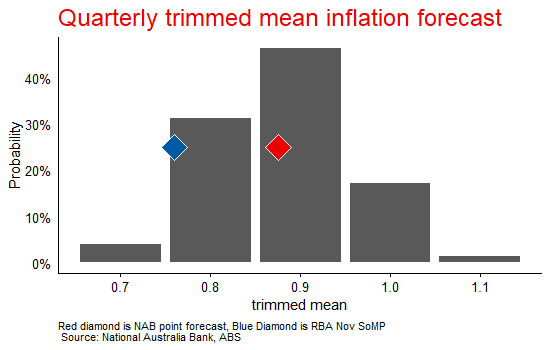
- We remain at 0.9% qoq for Q4 trimmed mean, but now see the risk skewed to the downside
- The RBA was at 0.75% qoq in the Nov SoMP and today’s data will lessen at the margin their concern about further upside risk
- Underlying inflation continues to annualise above the RBA’s target
Implications
November CPI was a more benign update than the October release. Headline inflation at 3.4% yoy was a little below our 3.6% forecast, with the surprise coming from larger falls in travel and car prices than we had pencilled in. Trimmed mean was 0.3% mom and 3.2% yoy (NAB 0.3/3.3), continuing to annualise above the RBA’s target.
The RBA will continue to focus on the quarterly trimmed mean for now. Our Q4 trimmed mean forecast remains at 0.9% qoq, but after today’s update we see the risk skewed lower, to a 0.8% qoq outcome.
Despite some of the more volatile components coming in on the low side in the month, the pulse of underlying inflation remains stronger than is consistent with inflation at the midpoint of the RBA’s target. Given concerns about capacity constraints and resilience in the labour market, the RBA is unlikely to be confident that cyclical conditions will be exerting sufficient downward pressure on inflation over the forecast horizon to sustain inflation at the mid-point of the target range. NAB continues to pencil in a modest recalibration in policy to lean more firmly against inflation risks, pencilling in 25bp hikes in February and May.
Detail
Elsewhere in the basket, the evolution of slower moving components was broadly in line with our expectations. There was some further slowing in market services inflation from strength seen in Q3, most notably in meals out and takeaway food. Insurance and some recreation categories remain stronger than was evident in H1, however.
Goods prices were soft in the month alongside black Friday discounting. That bled into the trimmed mean a little more than anticipated, with the ABS taking a light touch in intervening to smooth out what look to be seasonal falls, especially in the large furniture and car categories. That meant that some residual seasonality from Black Friday weighed on the trimmed mean in the month. We expect the large fall in car prices to reverse in December, but note our Q4 trimmed mean forecast is very sensitive to that expectation.
Shelter components continue to look threatening. Rents inflation was 0.4% mom in November, a little above the recent trend of 0.33% mom increases (ex the impact of rent assistance indexation in the past 2 months). New Dwelling prices rose 0.5% mom, marginally higher than the recent trend near 0.4% mom. These are the two largest components in the CPI.
Travel prices fell in the month. Airfare data had pointed to larger than seasonal falls in domestic travel prices after strength in October, we had pencilled in -2% mom, but the decline was larger at -4.1%, setting up a more modest contribution to the quarterly trimmed mean.
Electricity prices rose 6.8% mom, in line with our expectation, as Sydney and ACT reverted to a single quarterly rebate payment in the November but some additional households benefited from the Perth EBRF extension payment. In year-ended terms electricity prices fell, driven by base effects of a large increase a year ago dropping out of the data. Looking forward, electricity prices will jump around 15% in January, as rebates end, pushing headline inflation higher.
Health inflation fell 0.5% mom as bulk billing rates increased alongside the introduction of new bulk billing incentives. If those continue to drive bulk billing rates higher, it will continue to weigh at the margin on medical and hospital services inflation.
Chart 1: Headline and Trimmed Mean Inflation
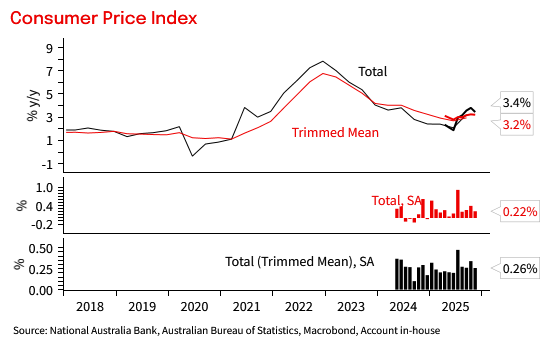
Chart 2: Core measures

Chart 3: Contributions to CPI inflation

Table 1: CPI heatmap by component
Shows 1- 3-, 6- and 12m annualised outcomes. Shading reflects how far inflation is above or below a benchmark of the 6 years to 2015 when inflation averaged around the mid-point of the target
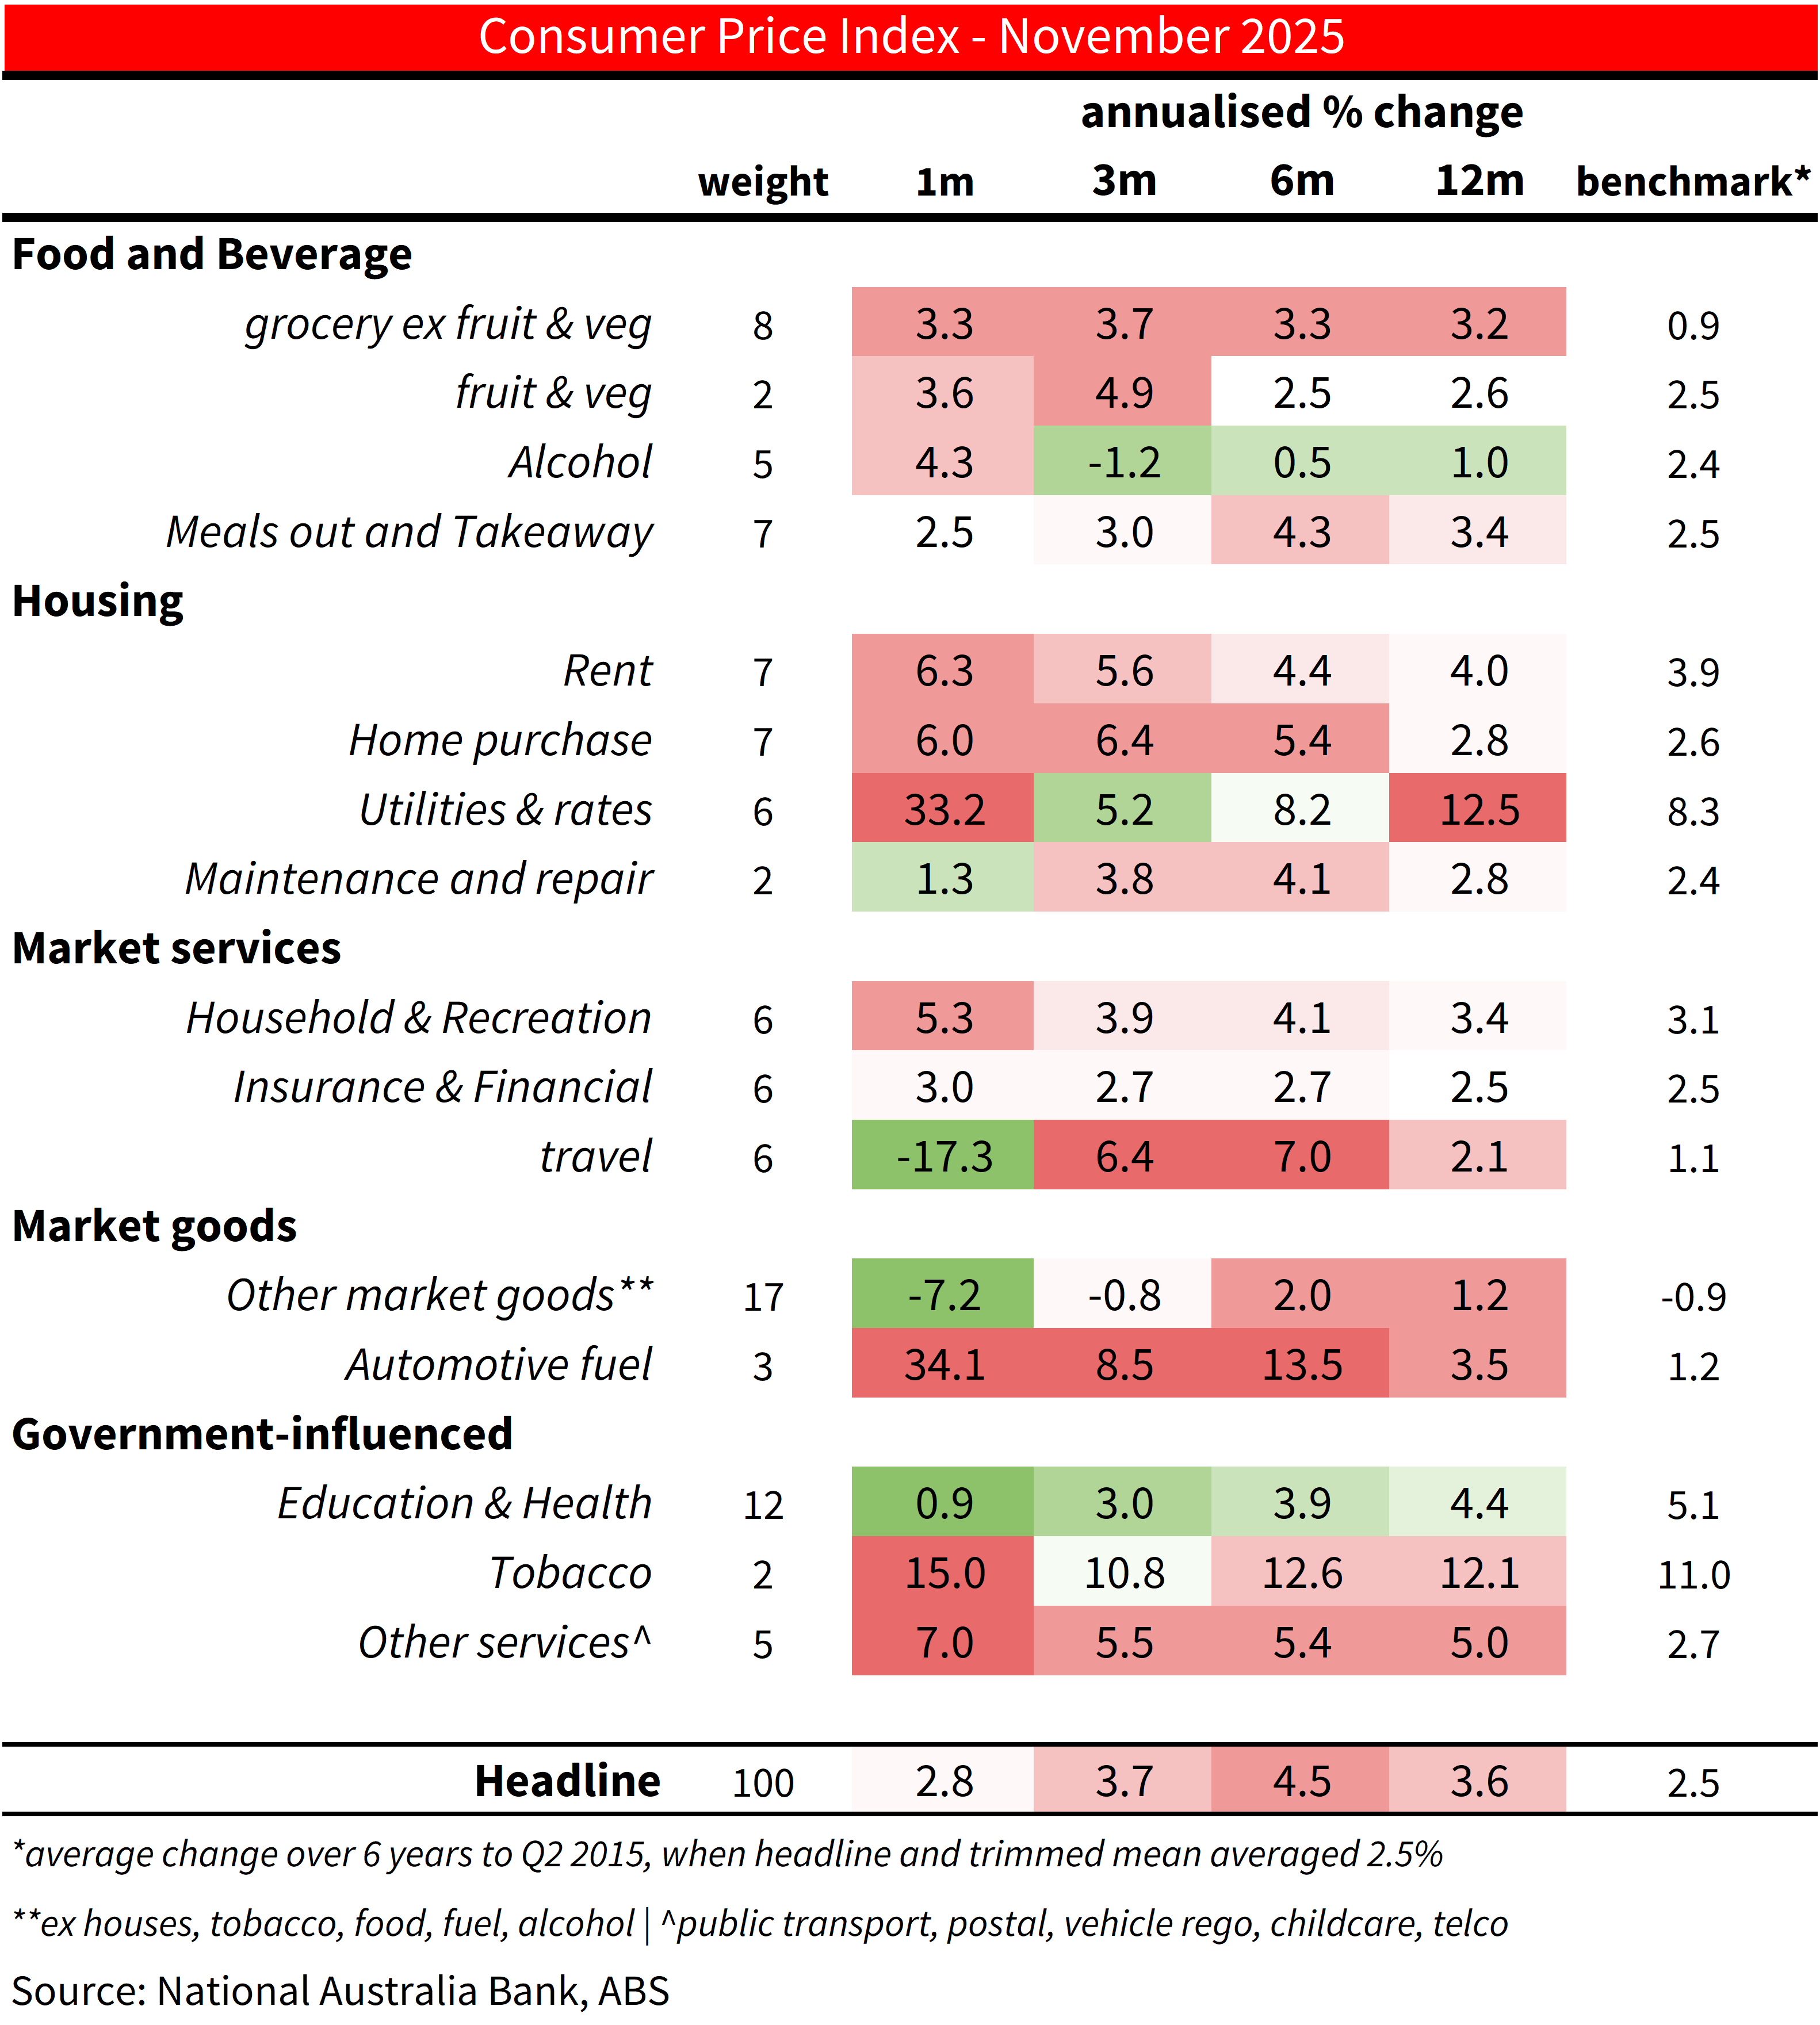
Table 2: CPI heat map by analytical measure
Shows 1- 3-, 6- and 12m annualised outcomes. Shading reflects how far inflation is above or below a benchmark of the 6 years to 2015 when inflation averaged around the mid-point of the target
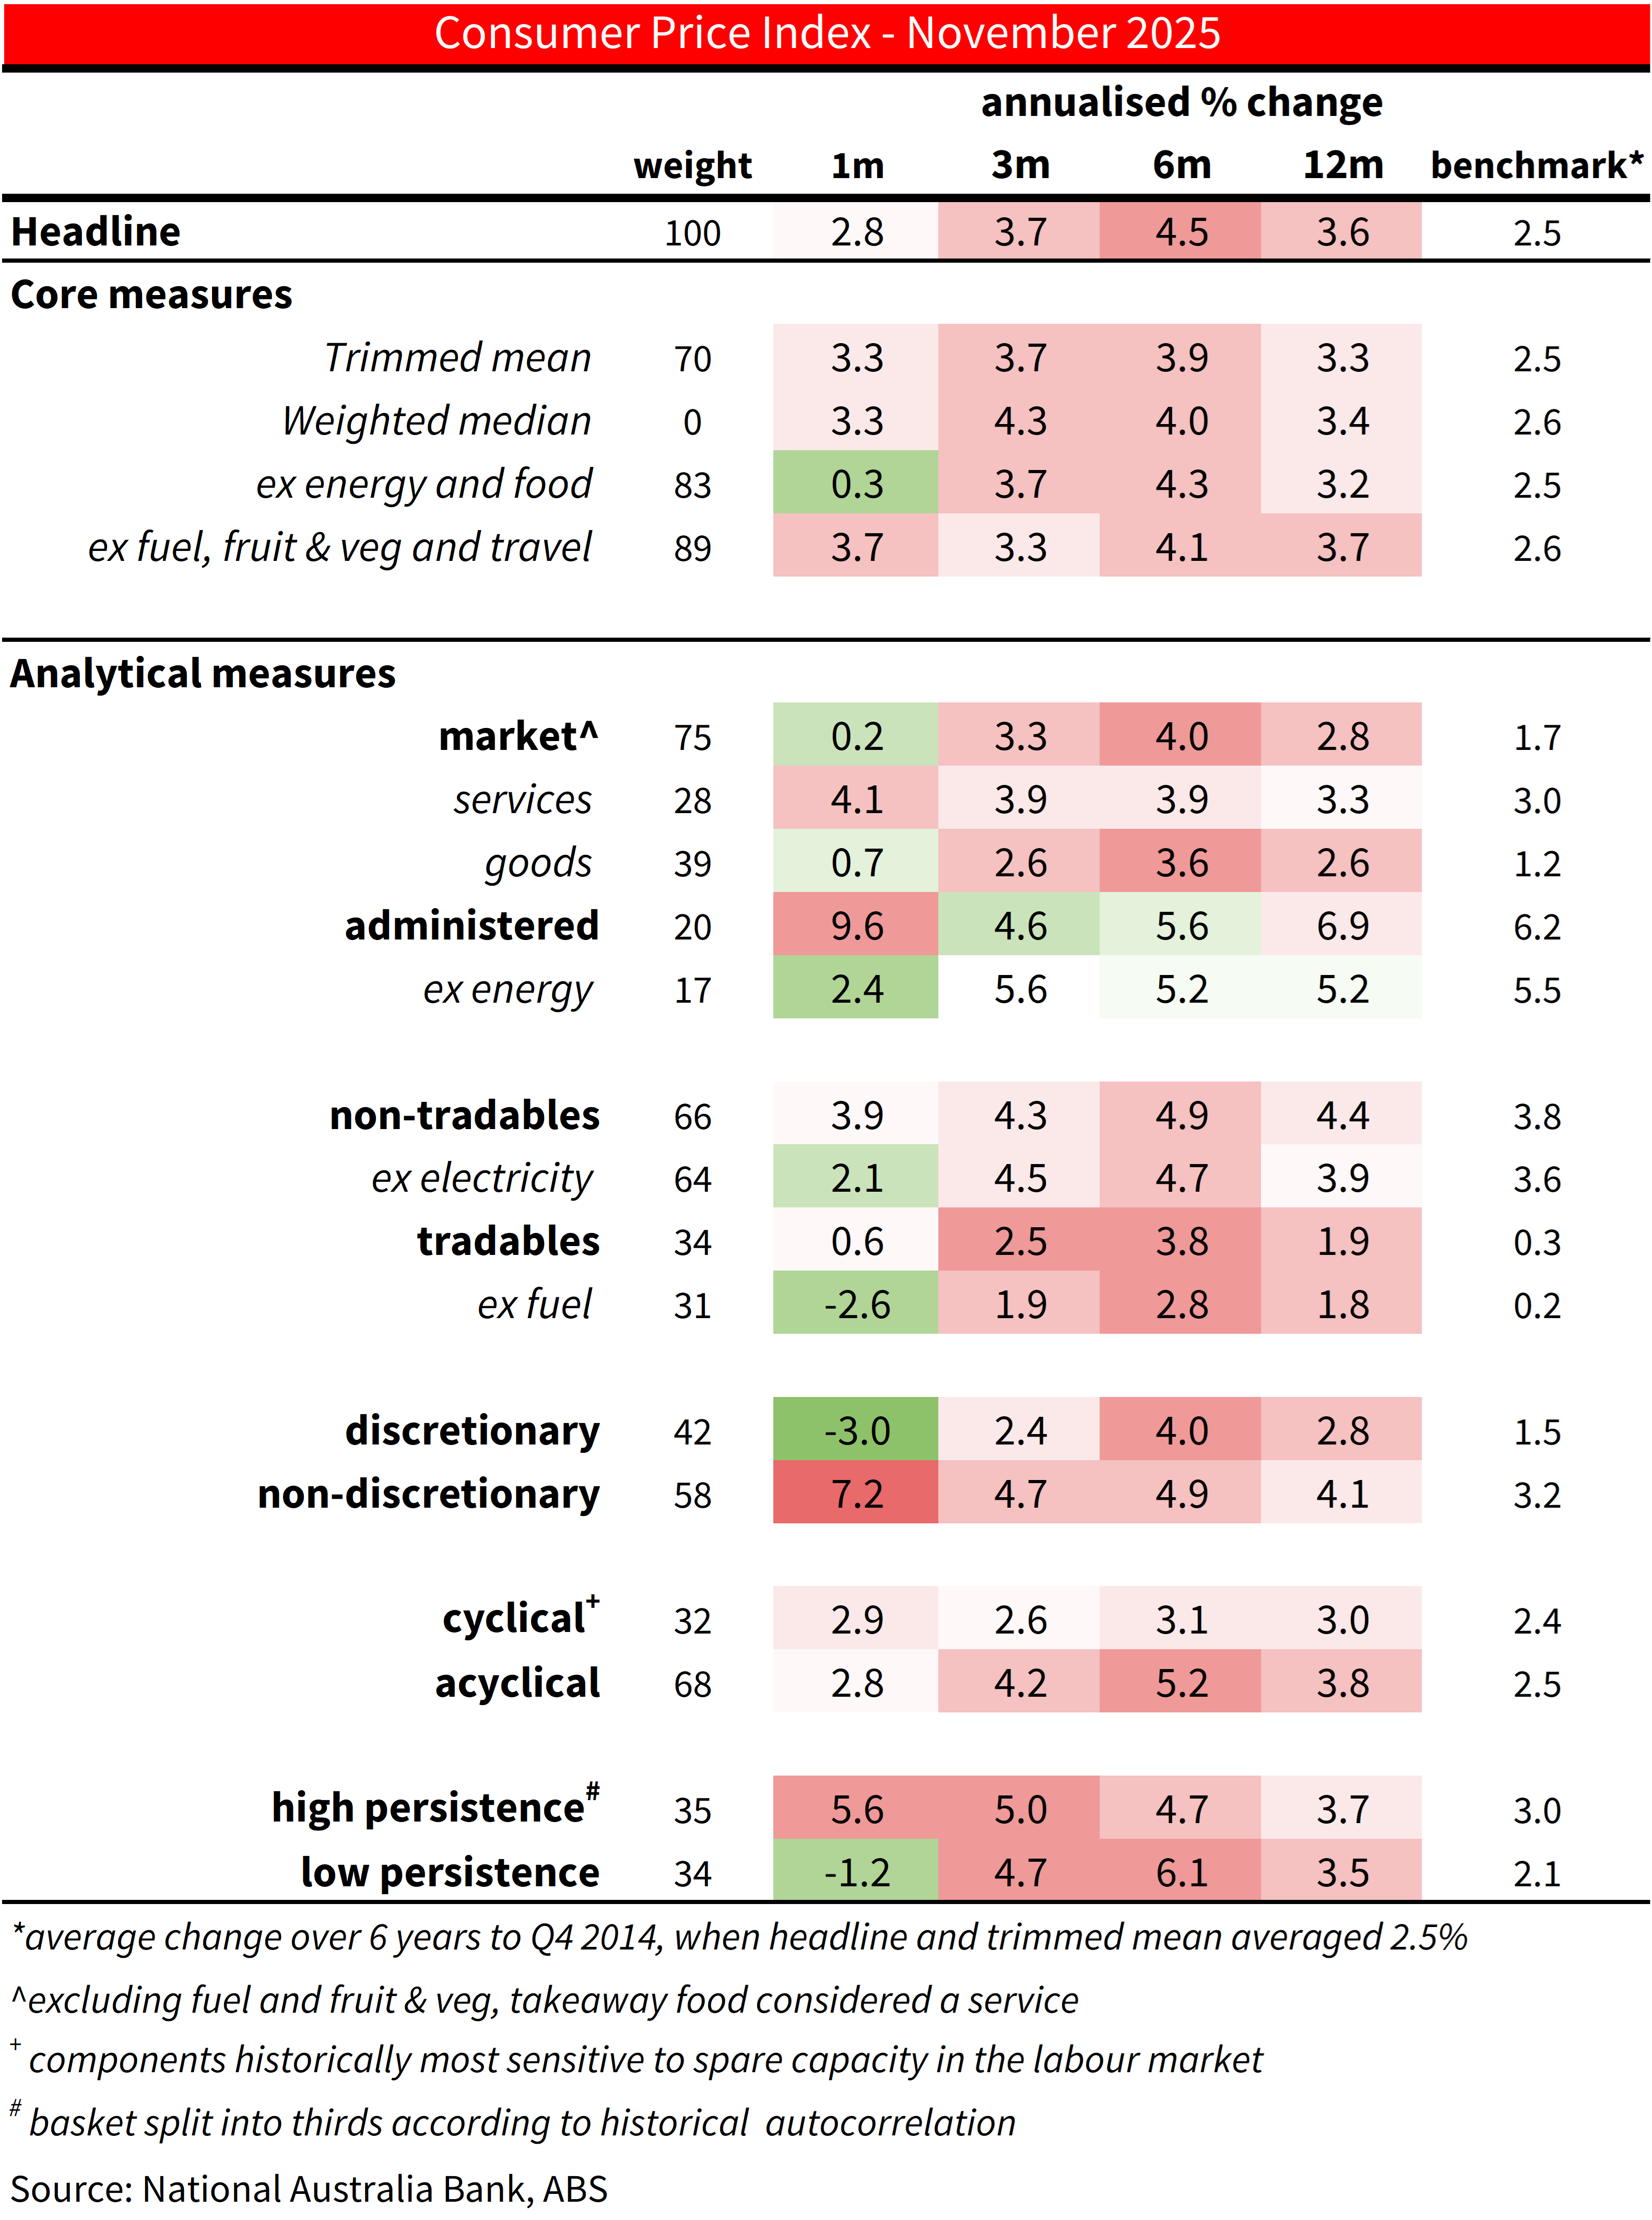
Chart 4: Market Services Inflation
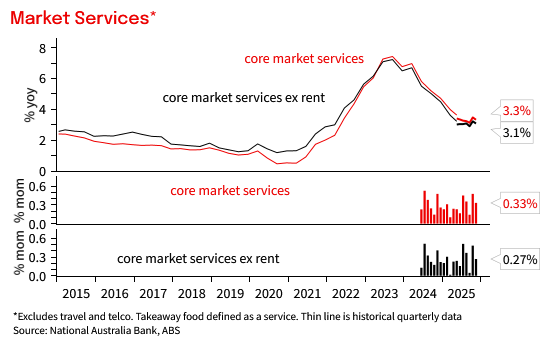
Chart 5: Furniture and Motor vehicle seasonal adjustment may have left some residual seasonality
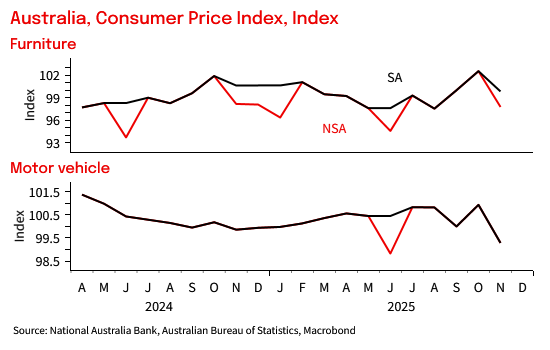
Chart 6: Tradables and non-tradables inflation
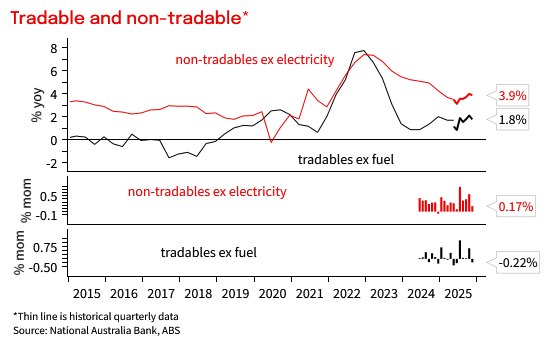
Chart 7: Administered price inflation
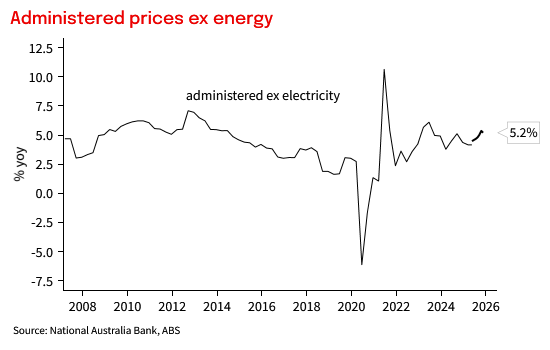
Chart 8: Share CPI basket more than 1ppt from target midpoint
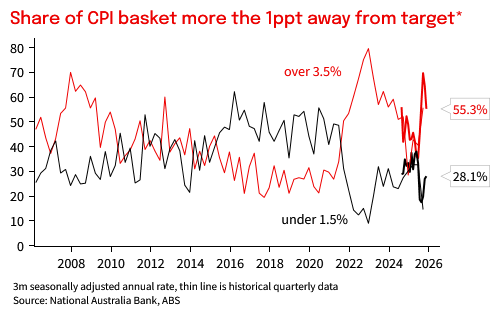
Chart 9: Quarterly trimmed mean inflation distribution forecast
What is the new Monthly CPI
Monthly data is inherently more volatile which favours looking at 3m and 6m averages, but the data does not come with the same caveats as the now ceased Monthly CPI Indicator. This is the ‘true’ CPI outcome. That said, many series have too little back history for standard seasonal adjustment, a challenge that bleeds into underlying measures including the trimmed mean and was especially relevant this month due to Black Friday discounting. The RBA will still focus on the quarterly trimmed mean measure for now. This measure will be published alongside the December, March, June and September monthly outcomes for at least 18 months, but only uses data from months with established seasonal patterns for those components that have historically been measures only once per quarter. Monthly trimmed mean is not, and may not become, the RBA’s ‘preferred underlying indicator’ and we provide a range of underlying indicators below.
This document has been prepared by National Australia Bank Limited ABN 12 004 044 937 AFSL 230686 ("NAB"). Any advice contained in this document has been prepared without taking into account your objectives, financial situation or needs. Before acting on any advice in this document, NAB recommends that you consider whether the advice is appropriate for your circumstances. NAB recommends that you obtain and consider the relevant Product Disclosure Statement or other disclosure document, before making any decision about a product including whether to acquire or to continue to hold it. Please Click Here to view our disclaimer and terms of use. Please Click Here to view our NAB Financial Services Guide.
All prices and analysis at 7 January 2026. This information has been prepared by National Australia Bank Limited ABN 12 004 044 937 AFSL 230686 ("NAB"). The content is distributed by WealthHub Securities Limited (WSL) (ABN 83 089 718 249)(AFSL No. 230704). WSL is a Market Participant under the ASIC Market Integrity Rules and a wholly owned subsidiary of National Australia Bank Limited (ABN 12 004 044 937)(AFSL No. 230686) (NAB). NAB doesn’t guarantee its subsidiaries’ obligations or performance, or the products or services its subsidiaries offer. This material is intended to provide general advice only. It has been prepared without having regard to or taking into account any particular investor’s objectives, financial situation and/or needs. All investors should therefore consider the appropriateness of the advice, in light of their own objectives, financial situation and/or needs, before acting on the advice. Past performance is not a reliable indicator of future performance. Any comments, suggestions or views presented do not reflect the views of WSL and/or NAB. Subject to any terms implied by law and which cannot be excluded, neither WSL nor NAB shall be liable for any errors, omissions, defects or misrepresentations in the information or general advice including any third party sourced data (including by reasons of negligence, negligent misstatement or otherwise) or for any loss or damage (whether direct or indirect) suffered by persons who use or rely on the general advice or information. If any law prohibits the exclusion of such liability, WSL and NAB limit its liability to the re-supply of the information, provided that such limitation is permitted by law and is fair and reasonable. For more information, please click here.