The great AI acceleration: Who will win the investment race in 2026?
Tamara Haban-Beer Stats | BlackRock
BlackRock has long argued that we’re in a new world of structural transformation shaped by a few mega forces, including geopolitical fragmentation, the future of finance and the energy transition. But by far the most dominant of these mega forces in today’s market is AI, which helped propel US markets to all-time highs in 2025 despite a backdrop of trade and geopolitical uncertainty.
While US stock valuations are the most expensive since the dot com and 1929 bubbles, this needs to be balanced against the speed and scale of investment by AI hyperscalers – which, given today’s spending levels, could mean that the AI transformation eclipses all other technological innovations in modern history (see below chart).
Length and capital deepening of notable innovations, 1760-2040
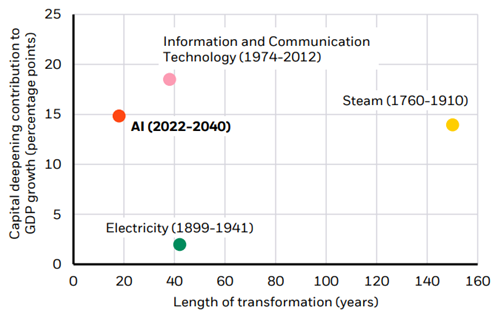
Forward-looking estimates may not come to pass. Source: BlackRock Investment Institute with data from Crafts (2021),December 2025. Notes: The chart shows the average annual contribution of capital spending to GDP growth for previous U.S. technologies (except “steam,” for the UK) against the length of time the capital was spent. Estimates for steam, electricity and ICT are taken from Crafts (2021). The spend needed for artificial intelligence (AI) is calculated using realized capital spending between 2022-2024, the upper end of the U.S.$5-8 trillion range of total capital spending intentions spanning the period 2025-2030, and an assumption that capex intensity continues at a similar rate through 2030-2040.
While we remain overweight US equities, we recognise the degree of concentration in the AI trade creates challenges for investors. Given the weighting of the US and tech in many major indices, even passive investing is no longer a ‘neutral’ stance. At the same time, if investors attempt to diversify away from these risks, they could miss out on valuable returns – for example, at time of writing the S&P 500 Equal Weight Index had generated just a 3% year to date return in US dollar terms, versus 11% for the S&P 500 Index.1
This is why we think investors need to be selective in how they approach the AI theme in 2026. Below are some of the key ways we see AI dominance playing out in the market over the next year, and how investors may best position to benefit from these themes.
1. Micro is macro
The AI buildout is dominated by a handful of companies whose spending is so large that it has a macro impact. Taking a view on these companies requires assessing whether the macro maths adds up.
For instance, if spending reaches the levels in the chart above by 2030, and the revenue of tech hyperscalers reaches US$1.6 trillion at the same time2, this would fall short of what’s need to justify spending levels. But if we assume a 1.5% increase in US average GDP as a result of AI-driven productivity – which we think is conceivable given the scale of innovation AI could generate – this could expand US economic revenues by US$1.1 trillion a year, more than enough to justify estimated AI spending.
For now, we stay overweight US stocks and the AI theme, supported by robust earnings expectations. We see value in active management, as we believe AI will become an active investment story of identifying new winners as revenues spread across the US economy.
A key aspect that may challenge the next stage of AI expansion is power generation, with estimates suggesting data centres may use up to a quarter of current US electricity demand by 20303. While project backlogs and slow permissions processes may challenge AI capex plans in the US, China is taking a contrasting approach in this space, building power generation and transmission at pace, as well as innovating more energy efficient AI models such as DeepSeek.
Investment implications: We like broad US equities for exposure to the AI theme through the iShares S&P 500 ETF (IVV), which investors may consider blending with an active management approach for more selectivity through the iShares U.S. Factor Rotation Active ETF (IACT). China’s AI progress is another theme investors could consider tapping into through the iShares Asia 50 ETF (IAA).
2. Leveraging up
Up until recently, tech hyperscalers have covered around half of their required AI capex through their own balance sheets4, however over the course of Q4 2025 we have seen more bond sales from large tech firms seeking to tap public and private credit markets for an increasing share of their funding.
With US corporate debt currently at 30 year lows5, we think there is room for listed tech companies to lever up. However with US government debt at record highs, and European and Japanese government spending also expanding, more private sector borrowing will add to an already leveraged global economy, which could potentially be more susceptible to short-term shocks.
Higher borrowing across public and private sectors is likely to keep upward pressure on interest rates, making global reflation one of our highest conviction themes in 2026.
We have seen this in the Federal Reserve’s ‘hawkish cut’ stance, with the US central bank flagging further rate cuts in the US next year will be data dependent. In Australia, talk of further cuts has moved quickly to speculation that the RBA’s next move will be a hike, as successive upside surprises in inflation and jobs data shows the economy is in danger of overheating once more.
Investment implications: Short-term fixed income exposures like the iShares Core Cash ETF (BILL) and iShares Enhanced Cash ETF (ISEC) can help investors take advantage of higher cash rates with more hikes potentially on the horizon in Australia. The iShares Government Inflation ETF (ILB) may also help add an element of inflation protection to investor portfolios.
3. Diversification mirage
As mentioned above, portfolio decisions taken under the guise of “diversifying” away from the handful of forces driving markets now amount to a much bigger active call. Portfolios with less exposure to the US or AI missed out on significant returns in 2025 – and if the AI theme does stumble, exposure to other regions or equal-weighted indices is unlikely to have much of a cushioning effect.
Bonds, also, are a less significant diversifier on their own in the current environment, as they have tended to move in closer alignment to equities in the years following the COVID pandemic. That’s why investors have been hunting for other portfolio hedges in 2025 – reviving interest in gold, which at time of writing had generated a 54% return year to date6.
While we like gold as a tactical play with distinct return drivers of its own, we again don’t see it as a sufficient long-term portfolio hedge. In 2026, we see investors combining different portfolio diversifiers to build resilience – shifting away from broad asset classes and regional views to more granular, nimbler positioning and themes that work across scenarios.
Investment implications: To take a more layered approach to diversification, investors could consider combining gold exposure through the iShares Physical Gold ETF (GLDN) with listed infrastructure via the iShares Core FTSE Global Infrastructure (AUD Hedged) ETF (GLIN) – which can make a good defensive exposure given its typically strong cash flows and lower volatility than broad equities. The iShares MSCI World ex Australia Minimum Volatility ETF (WVOL) may also be worth considering for those looking to stay invested through market downturns, while capturing less downside.
- Source: BlackRock/LSEG Datastream data as of 4 December 2025
- Based on broker estimates of tech hyperscaler revenue through to 2030. Source: BlackRock Investment Institute, 4 December 2025
- Source: BlackRock Investment Institute as of December 2025
- Source: Morgan Stanley data as of October 2025
- Source: BlackRock Investment Institute/US Congressional Budget Office, December 2025
- Source: BlackRock, Bloomberg as of 31 October 2025. Based on year to date Australian dollar returns of the ICME LBMA Gold Price Index to 31 October 2025. Past performance is not a reliable indicator of future performance. Index performance returns do not reflect any management fees, transaction costs or expenses. Indexes are unmanaged and one cannot invest directly in an index
Important Information: This material has been created with the co-operation of BlackRock Investment Management (Australia) Limited (BIMAL) ABN 13 006 165 975, AFSL 230 523 on 2 December 2025. Comments made by BIMAL employees here represent BIMAL’s views only. This material provides general advice only and does not take into account your individual objectives, financial situation, needs or circumstances. [Optional text – funds are mentioned:] Where BIMAL funds are referenced - Read the Product Disclosure Statement (PDS) and Target Market Determination (TMD) at blackrock.com/au to see if the products referenced are appropriate for you. Before making any investment decision, you should obtain financial advice tailored to you having regard to your individual objectives, financial situation, needs and circumstances. Refer to BIMAL’s Financial Services Guide at blackrock.com/au for more information. This material is not a financial product recommendation or an offer or solicitation with respect to the purchase or sale of any financial product in any jurisdiction. All currency in AUD unless otherwise stated.
Product list
iShares Core S&P/ASX 200 ETF (IOZ)
This product is likely to be appropriate for a consumer:
• who is seeking capital growth and/or income distribution
• using the product for a core component of their portfolio or less
• with a minimum investment timeframe of 5 years
• with a medium to high risk/return profile
iShares Core S&P/ASX 200 ETF | IOZ
iShares S&P 500 ETF (IVV)
This product is likely to be appropriate for a consumer:
• who is seeking capital growth and/or income distribution
• using the product for a core component of their portfolio or less
• with a minimum investment timeframe of 5 years, and
• with a medium to high risk/return profile
iShares S&P 500 (AUD Hedged) ETF (IHVV)
This product is likely to be appropriate for a consumer:
• who is seeking capital growth
• using the product for a core component of their portfolio or less
• with a minimum investment timeframe of 5 years, and
• with a high to very high risk/return profile
iShares S&P 500 (AUD Hedged) ETF | IHVV
iShares Core FTSE Global Infrastructure (AUD Hedged) ETF (GLIN)
This product is likely to be appropriate for a consumer:
• who is seeking capital growth and/or income distribution
• using the product for a core component of their portfolio or less
• with a minimum investment timeframe of 5 years, and
• with a medium to high risk/return profile
iShares Core FTSE Global Infrastructure (AUD Hedged) ETF | GLIN
iShares Core Global Aggregate Bond ESG (AUD Hedged) ETF (AESG)
This product is likely to be appropriate for a consumer:
• who is seeking capital preservation and/or income distribution
• using the product for a major allocation of their portfolio or less
• with a minimum investment timeframe of 5 years, and,
• with a medium risk/return profile
iShares Global Aggregate Bond ESG (AUD Hedged) ETF | AESG
iShares Global 100 (AUD Hedged) ETF (IHOO)
This product is likely to be appropriate for a consumer:
• who is seeking capital growth
• using the product for a major allocation of their portfolio or less
• with a minimum investment timeframe of 5 years, and
• with a high to very high risk/return profile
iShares Global 100 (AUD Hedged) ETF | IHOO
iShares Global 100 ETF (IOO)
This product is likely to be appropriate for a consumer:
• who is seeking capital growth
• using the product for a major allocation of their portfolio or less
• with a minimum investment timeframe of 5 years, and
• with a medium to high risk/return profile
iShares Global 100 ETF | IOO | -
iShares MSCI Japan ETF (IJP)
This product is likely to be appropriate for a consumer:
• who is seeking capital growth
• using the product for a core component of their portfolio or less
• with a minimum investment timeframe of 5 years, and
• with a medium to high risk/return profile
iShares MSCI Japan ETF | IJP | -
iShares MSCI Emerging Markets ex China ETF (EMXC)
This product is likely to be appropriate for a consumer:
• who is seeking capital growth
• using the product for a core component of their portfolio or less
• with a minimum investment timeframe of 5 years, and
• with a medium to high risk/return profile
iShares MSCI Emerging Markets ex China ETF | EMXC | -
iShares Core Composite Bond ETF (IAF)
This product is likely to be appropriate for a consumer:
• who is seeking capital preservation and/or income distribution
• using the product for a core component of their portfolio or less
• with a minimum investment timeframe of 3 years, and
• with a medium risk/return profile
iShares Core Composite Bond ETF | IAF
iShares Core Cash ETF (BILL)
This product is likely to be appropriate for a consumer:
• who is seeking capital preservation and/or income distribution
• using the product for a whole portfolio solution or less
• with no minimum investment timeframe, and
• with a very low risk/return profile
iShares Core Corporate Bond ETF (ICOR)
This product is likely to be appropriate for a consumer:
• who is seeking capital preservation and/or income distribution
• using the product for a core component of their portfolio or less
• with a minimum investment timeframe of 3 years, and
• with a medium risk/return profile