October CPI keeps the pressure on the RBA
Taylor Nugent | Markets Research
Key points
- First monthly CPI print shows inflation above RBA’s target band
- Headline at 3.8% yoy (NAB and Consensus 3.6%)
- Trimmed mean 3.3% yoy from 3.2% in September
- Risk is the high side of the RBA’s Q4 trimmed mean forecast
- Meals out and Takeaway inflation has moderated from Q3 strength but broader services categories mixed
- Domestic travel and accommodation remain strong
Bottom line
Elevated and broad-based inflation pressures evident in Q3 were largely sustained in October. The share of the basket running above 3.5% on a 3m annualised basis is 64%, almost 30ppt higher than it was in June. The monthly trimmed mean measure was 0.3% mom and is 3.6% in 3m annualised terms, off its peak after a very strong July outcome.
Headline inflation was 3.8% yoy. The usual increase in domestic travel prices alongside school holiday demand was stronger than we had pencilled in, driving the upside surprise to our 3.6% forecast. Volatile fruit and vegetable prices also rose strongly in the month. Elsewhere, electricity prices fell 10% mom as expected due to the timing of NSW and ACT rebate payments, but electricity remains 37% higher over the year and the largest contributor to annual inflation. Electricity base effects will subtract from headline inflation in November and December before the end of rebates adds to CPI in Q1 2025.
For underlying inflation, the RBA will continue to preference the quarterly trimmed mean for now. Their November SoMP pencilled in a ~0.75% qoq for Q4 trimmed mean. Our forecast of 0.8% qoq as a little less optimistic than the RBA’s, and the detail of today’s data, in particular the unexpected strength in domestic travel prices, suggests the risk skews firmly to the high side of that 0.8% qoq forecast.
What to know about the Monthly CPI
This is the first release of the new Monthly CPI. Monthly data is inherently more volatile which favours looking at 3m and 6m averages, but the data does not come with the same caveats as the now ceased Monthly CPI Indicator. This is the ‘true’ CPI outcome. That said, many series have too little back history for standard seasonal adjustment, a challenge that bleeds into underlying measures including the trimmed mean. The RBA will still focus on the quarterly trimmed mean measure for now. This measure will be published alongside the December, March, June and September monthly outcomes for at least 18 months and bins information that was not present in the quarterly data collection. Monthly trimmed mean is not, and may not become, the RBA’s ‘preferred underlying indicator’ and we provide a range of underlying indicators below. For our full introduction, see: Australian CPI is now monthly, what you need to know.
Detail
Market services inflation was mixed. Encouragingly, meals out and takeaway did moderate in the past couple of months from their surprising strength in Q3. On the other hand, sports participation remains stronger and other recreation and other rec, sporting and cultural activities have driven volatility in the market services outcomes, falling sharply in September and rebounding in October. Overall, market services categories remain look set to contribute a little less to Q4 inflation than they did in Q3, but remain much hotter than they were through H1 2025 and stronger than has historically been consistent with inflation at the midpoint of the target.
New Dwelling inflation was 0.4% mom, back where it was in August after a very strong 0.7% in September. Rents inflation was 0.2% mom. The semi-annual increase in rent assistance again weighing, with underlying rents inflation continuing to annualise around 4%.
Utilities subtracted from inflation in the month, driven by the measured decline in electricity prices, though this was partly offset by a 4.2% mom increase in water and sewerage charges due to large, and unusually late, price increases in NSW.
Chart 1: Headline and Trimmed Mean Inflation
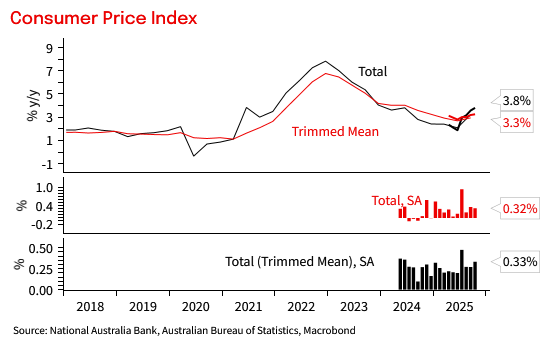
Chart 2: Core measures
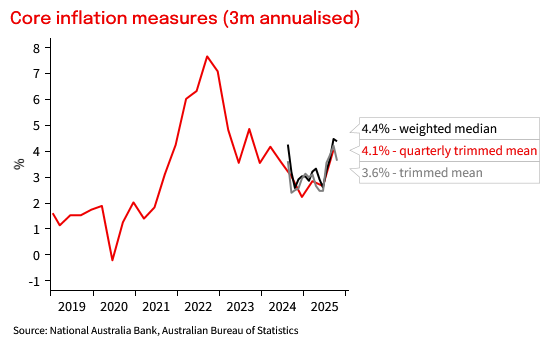
Chart 3: Contributions to CPI inflation
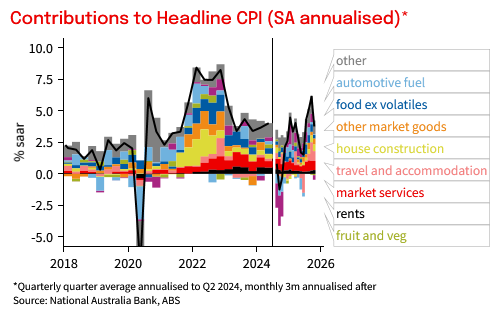
Table 1: CPI heat map. Shows 1- 3-, 6- and 12m annualised outcomes. Shading reflects how far inflation is above or below a benchmark of the 6 years to 2015 when inflation averaged around the mid-point of the target.
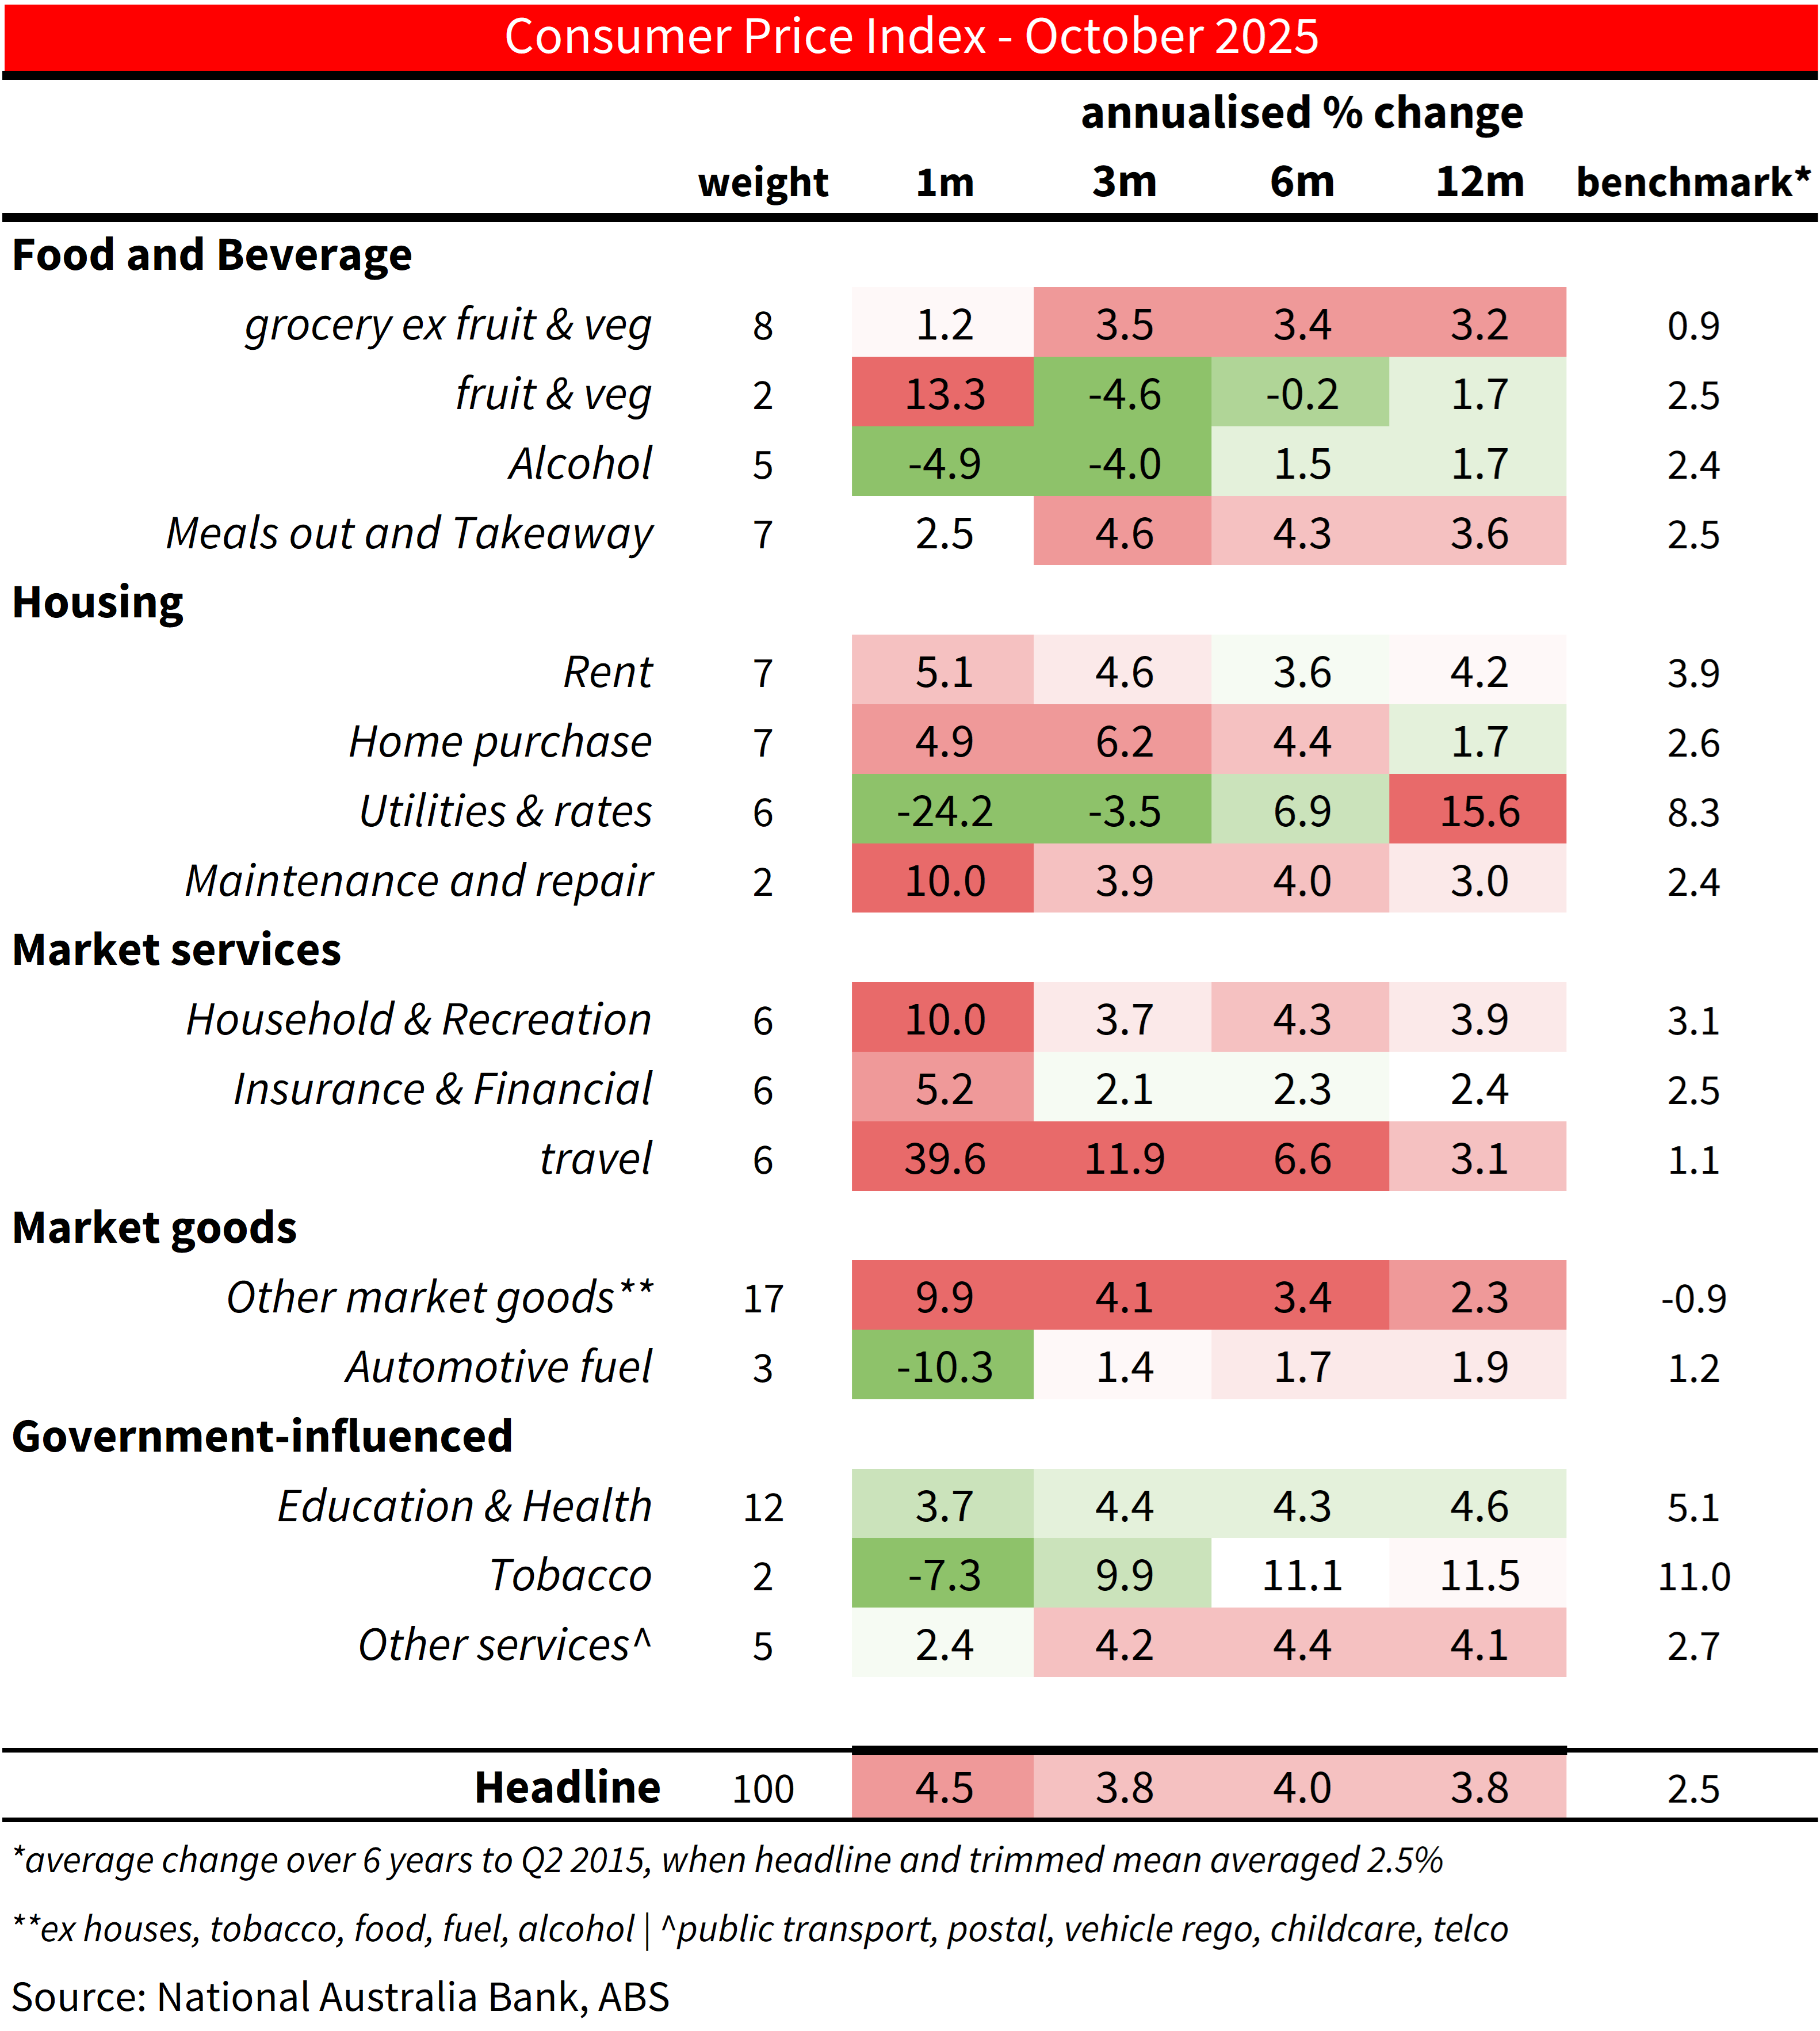
Table 2: CPI heat map. Shows 1- 3-, 6- and 12m annualised outcomes. Shading reflects how far inflation is above or below a benchmark of the 6 years to 2014 when inflation averaged around the mid-point of the target.
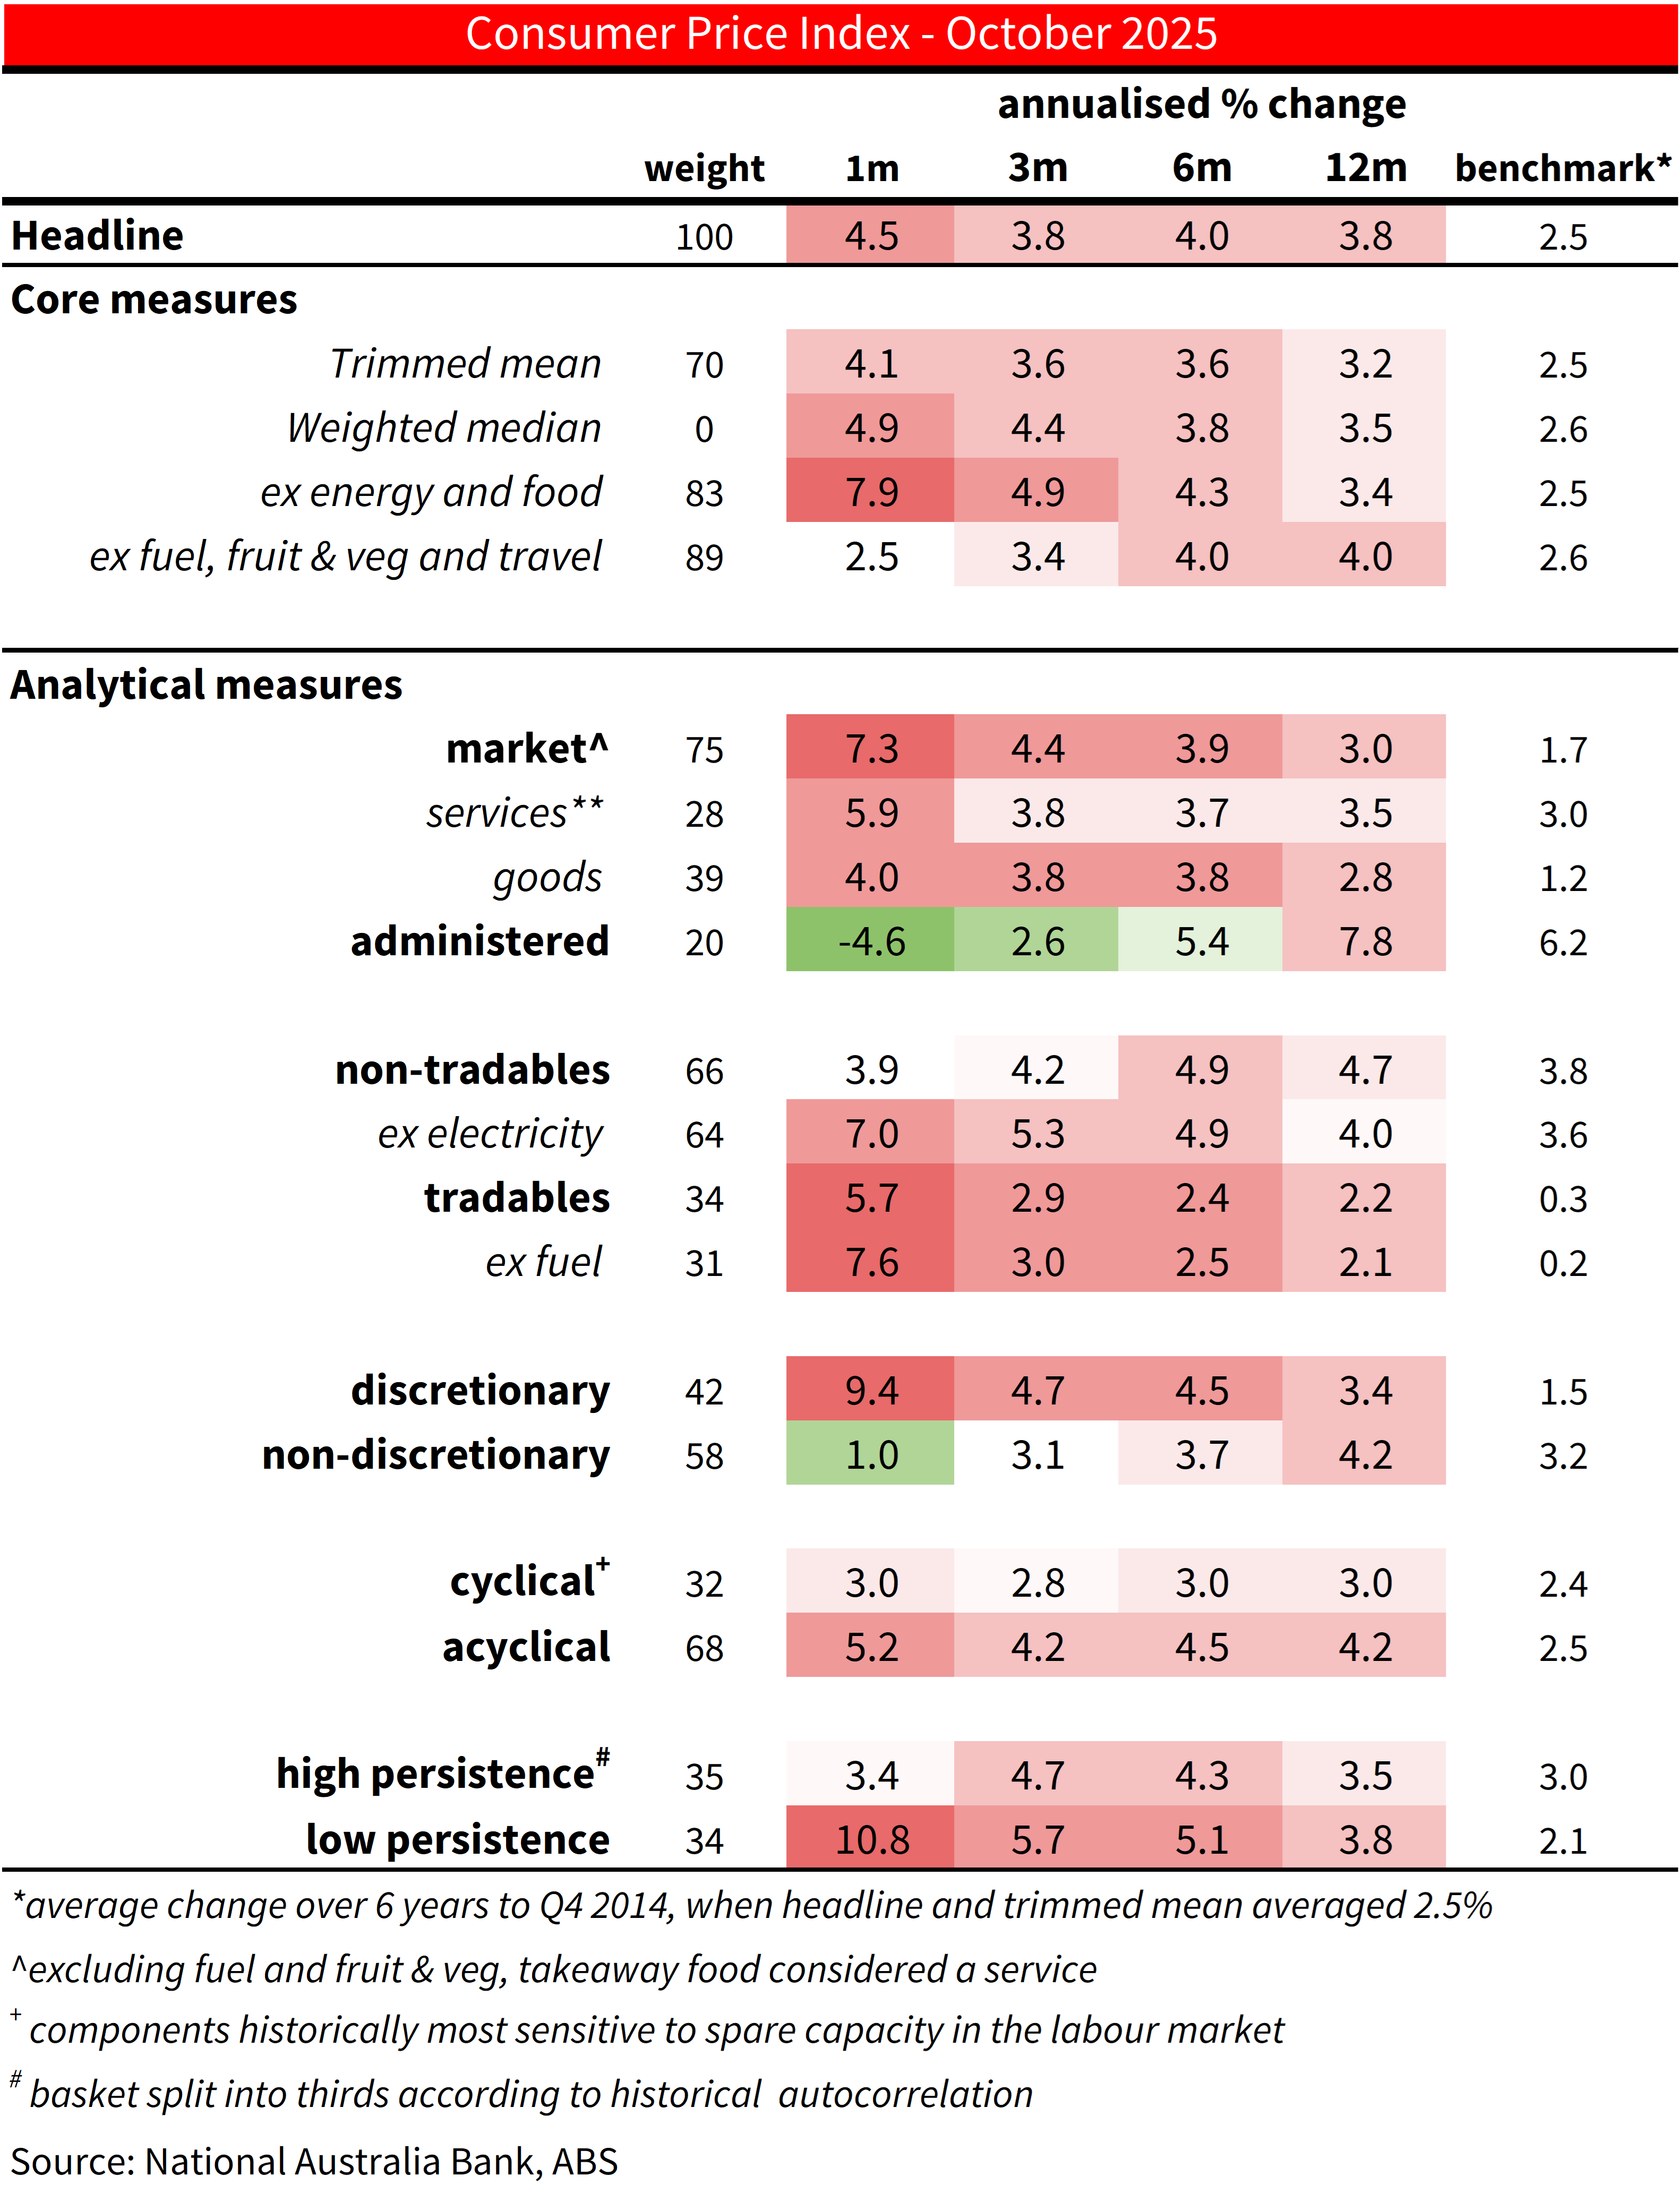
Chart 3: Tradables and non-tradables inflation
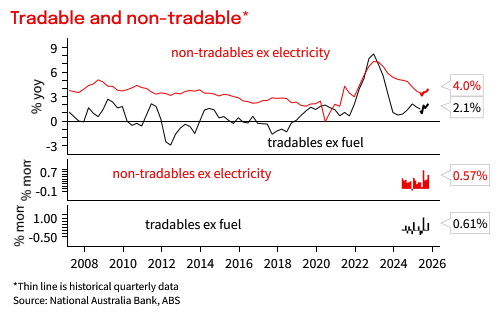
Chart 4: Market Services Inflation
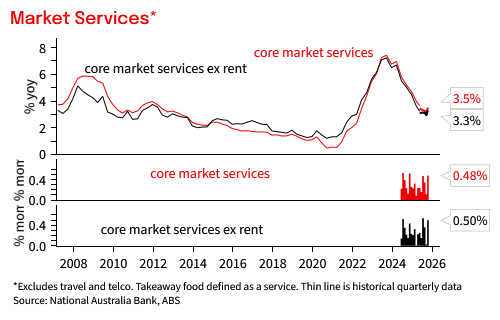
Chart 5: Share CPI basket more than 1ppt from target midpoint

This document has been prepared by National Australia Bank Limited ABN 12 004 044 937 AFSL 230686 ("NAB"). Any advice contained in this document has been prepared without taking into account your objectives, financial situation or needs. Before acting on any advice in this document, NAB recommends that you consider whether the advice is appropriate for your circumstances. NAB recommends that you obtain and consider the relevant Product Disclosure Statement or other disclosure document, before making any decision about a product including whether to acquire or to continue to hold it. Please Click Here to view our disclaimer and terms of use. Please Click Here to view our NAB Financial Services Guide.
All prices and analysis at 26 November 2025. This information has been prepared by National Australia Bank Limited ABN 12 004 044 937 AFSL 230686 ("NAB"). The content is distributed by WealthHub Securities Limited (WSL) (ABN 83 089 718 249)(AFSL No. 230704). WSL is a Market Participant under the ASIC Market Integrity Rules and a wholly owned subsidiary of National Australia Bank Limited (ABN 12 004 044 937)(AFSL No. 230686) (NAB). NAB doesn’t guarantee its subsidiaries’ obligations or performance, or the products or services its subsidiaries offer. This material is intended to provide general advice only. It has been prepared without having regard to or taking into account any particular investor’s objectives, financial situation and/or needs. All investors should therefore consider the appropriateness of the advice, in light of their own objectives, financial situation and/or needs, before acting on the advice. Past performance is not a reliable indicator of future performance. Any comments, suggestions or views presented do not reflect the views of WSL and/or NAB. Subject to any terms implied by law and which cannot be excluded, neither WSL nor NAB shall be liable for any errors, omissions, defects or misrepresentations in the information or general advice including any third party sourced data (including by reasons of negligence, negligent misstatement or otherwise) or for any loss or damage (whether direct or indirect) suffered by persons who use or rely on the general advice or information. If any law prohibits the exclusion of such liability, WSL and NAB limit its liability to the re-supply of the information, provided that such limitation is permitted by law and is fair and reasonable. For more information, please click here.