Bubble or buy? Why US equities may be poised for further growth
Tamara Haban-Beer Stats | BlackRock
Although US stocks didn't perform as strongly as expected earlier in 2025, they have bounced back over 30% since early April, with the S&P 500 reaching all-time highs in August and September 2025.1
At the same time, following a strong Q2 earnings season, investors have returned to US shares in large numbers. In September alone, almost $250 million poured into the iShares S&P 500 ETF (IVV) – only around 20% less than the fund’s total inflows from January to August 2025.2
The iShares S&P 500 (AUD Hedged) ETF (IHVV) was also in the top 5 products on an inflow basis across iShares’ Australian range in September, with over $100 million invested.3
Investor preference for hedged US equities exposure has soared this year in the face of US dollar swings, with IHVV attracting $540 million in flows for 2025 to date – almost double the fund’s total flows for 2024.4
The flow numbers mirror trends seen globally as investors pile back into the US market. In the third quarter of 2025, US equity ETFs received about $191 billion globally—more than twice as much as the previous quarter.5
US growth is earnings-led
Chief among the factors attracting many investors back to the US market is corporate earnings, which remain resilient despite trade uncertainty.
In the August 2025 US earnings season, 79% of companies beat analyst revenue estimates, while more than 80% beat earnings estimates – far above the historical average of around 60% of US companies that typically beat earnings consensus.6 In the Q3 earnings season to date, the beat rate has risen even further to 85%.7
Earnings growth is expected to remain robust going forward, as seen in the chart below. Not only do US earnings estimates remain above other markets, they continue to be revised up – over the last three months analyst estimates for US equity earnings have risen 1.9% on average, compared to a 1.7% decrease for emerging market equities and 0.7% decrease for Japanese shares.8
US earnings estimates are above all their developed market counterparts
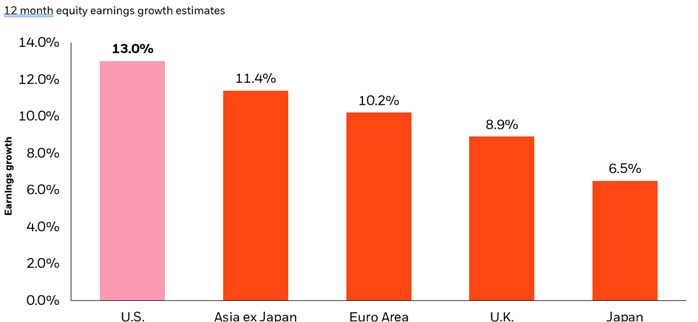
Source: LSEG Datastream, MSCI and BlackRock Investment Institute. As of 11 September 2025. Note: The bars show the aggregate analyst 12-month forward earnings growth estimate. Forecasts may not come to pass.
Of course, US equity momentum is still largely being driven by megacap tech stocks. Since 2020, less than 10 stocks within the S&P 500 have driven up to 50% of its earnings, while this year technology and communications have delivered a 25% higher year to date return than the S&P 500 more broadly.9
When we look at the US economy too, technology sector expansion is effectively keeping growth alive.
In 2025 to date, non-residential investment has made up more than 50% of US GDP growth – the highest percentage over the last 25 years – and taking a closer look at this spending category, we can see it is entirely made up of AI-related investment.10
This is because AI technology is evolving at a rapid pace, making it essential for ‘hyperscalers’ like the Magnificent 7 companies – Apple, Microsoft, NVIDIA, Amazon, Alphabet, Tesla and Meta – to invest heavily in the components needed to power new models.
While a flurry of partnership deals between these megacap names have seen some questions raised around the ‘circularity’ of AI investment, such spending loops are currently anchored to real usage and revenue, and funded largely by the tech companies’ own free cash flow – clearly differentiating them from previous bubbles.
Although US stock prices remain lofty by historical standards, strong earnings help justify them. Average five-year earnings for the S&P 500 were around 17% as of December 2024, with this figure expected to increase by the end of 2025.
Compared to an average of 4.7% five-year annualised earnings over the past 150 years, it’s clear we’re in a new era of economic transformation that is being driven primarily by US tech advancement.11
US economic conditions are looking better than earlier in the year, as interest rates start to drop. After the Federal Reserve reduced rates in September, its chair Jerome Powell confirmed more cuts are likely in the last quarter of the year to help boost confidence among consumers and businesses.
Tapping into the US rally
As the US market becomes increasingly dominated by mega-cap tech stocks, ETFs present new opportunities for investors to flexibly manage their US equity exposure, leaning into or out of market concentration according to their market views.
Investors bullish on large-cap stocks may consider the iShares Global 100 ETF (IOO). With around a 45% weighting to technology and 80% exposure to the US, IOO offers significant access to the AI theme, broadened by additional global names across other sectors including financials and communications.12
For those looking for technology exposure with an active overlay, the iShares U.S. Factor Rotation ETF (IACT) offers access to the US based on six key factors – quality , low volatility, size, value, growth and momentum. IACT dynamically rotates its portfolio through the favoured factors based on data signals, and is currently positive on momentum, value and growth with an almost 40% weight to technology.13
Investors wanting to benefit from recent supportive macro trends in the US can access 80% of the US equity market through the iShares S&P 500 ETF (IVV).14 With around a 35% weighting to technology, IVV allows investors to tap into US tech stocks as part of a broad allocation to the world’s largest economy.
Ultimately, we see the AI mega force - combined with falling interest rates - continuing to push US equities ahead of their developed market peers. By making use of options across index and active strategies, investors can build their exposure to this evolving trend as they see fit.
- Source: BlackRock data as of 23 September 2025
- Source: BlackRock data as of 30 September 2025
- Source: BlackRock data as of 30 September 2025
- Source: BlackRock data as of 30 September 2025
- Source: BlackRock and Markit data as of 30 September
- Source: BlackRock data as of 23 September 2025
- Source: Australian Financial Review, 21 October 2025
- Source: BlackRock/LSEG Datastream data as of 19 September 2025
- Source: BlackRock/MSCI/LSEG Datastream data as of September 2025
- Source: BlackRock Investment Institute/US Bureau of Economic Analysis data as of September 2025
- Source:
- Source: BlackRock data as of 25 September 2025
- Source: BlackRock data as of 21 October 2025
- Source: S&P data as of 7 July 2025
Product Details
iShares S&P 500 ETF (IVV)
https://www.blackrock.com/au/products/275304/
This product is likely to be appropriate for a consumer:
- who is seeking capital growth and/or income distribution
- using the product for a core component of their portfolio or less
- with a minimum investment timeframe of 5 years, and
- with a medium to high risk/return profile
iShares S&P 500 (AUD Hedged) ETF (IHVV)
This product is likely to be appropriate for a consumer:
- who is seeking capital growth
- using the product for a core component of their portfolio or less
- with a minimum investment timeframe of 5 years, and
- with a high to very high risk/return profile
iShares S&P 500 (AUD Hedged) ETF | IHVV
iShares Global 100 ETF (IOO)
This product is likely to be appropriate for a consumer:
- who is seeking capital growth
- using the product for a major allocation of their portfolio or less
- with a minimum investment timeframe of 5 years, and
- with a medium to high risk/return profile
iShares Global 100 ETF | IOO | -
iShares U.S. Factor Rotation Active ETF
This product is likely to be appropriate for a consumer:
- who is seeking capital growth and/or income distribution
- using the product for a core component of their portfolio or less
- with a minimum investment timeframe of 5 years, and
- with a high to very high risk/return profile
iShares U.S. Factor Rotation Active ETF | IACT
DISCLAIMER
Important Information: This material has been created with the co-operation of BlackRock Investment Management (Australia) Limited (BIMAL) ABN 13 006 165 975, AFSL 230 523 on 31 October 2025. Comments made by BIMAL employees here represent BIMAL’s views only. This material provides general advice only and does not take into account your individual objectives, financial situation, needs or circumstances. [Optional text – funds are mentioned:] Where BIMAL funds are referenced - Read the Product Disclosure Statement (PDS) and Target Market Determination (TMD) at blackrock.com/au to see if the products referenced are appropriate for you. Before making any investment decision, you should obtain financial advice tailored to you having regard to your individual objectives, financial situation, needs and circumstances. Refer to BIMAL’s Financial Services Guide at blackrock.com/au for more information. This material is not a financial product recommendation or an offer or solicitation with respect to the purchase or sale of any financial product in any jurisdiction. All currency in AUD unless otherwise stated.
Opinions are subject to change, and they are not a guarantee of future results. This information should not be relied upon as research, investment advice or a recommendation. Diversification and asset allocation may not fully protect you from market risk. This information has been provided by BlackRock Investment Management (Australia) Limited (BIMAL) for WealthHub Securities Limited (WSL) (ABN 83 089 718 249)(AFSL No. 230704). WSL is a Market Participant under the ASIC Market Integrity Rules and a wholly owned subsidiary of National Australia Bank Limited (ABN 12 004 044 937)(AFSL No. 230686) (NAB). NAB doesn’t guarantee its subsidiaries’ obligations or performance, or the products or services its subsidiaries offer. This material is intended to provide general advice only. It has been prepared without having regard to or taking into account any particular investor’s objectives, financial situation and/or needs. All investors should therefore consider the appropriateness of the advice, in light of their own objectives, financial situation and/or needs, before acting on the advice. Past performance is not a reliable indicator of future performance. Any comments, suggestions or views presented do not reflect the views of WSL and/or NAB. Subject to any terms implied by law and which cannot be excluded, neither WSL nor NAB shall be liable for any errors, omissions, defects or misrepresentations in the information or general advice including any third party sourced data (including by reasons of negligence, negligent misstatement or otherwise) or for any loss or damage (whether direct or indirect) suffered by persons who use or rely on the general advice or information. If any law prohibits the exclusion of such liability, WSL and NAB limit its liability to the re-supply of the information, provided that such limitation is permitted by law and is fair and reasonable. For more information, please click here.
Important Information: This material has been created with the co-operation of BlackRock Investment Management (Australia) Limited (BIMAL) ABN 13 006 165 975, AFSL 230 523 on 28 July 2025. Comments made by BIMAL employees here represent BIMAL’s views only. This material provides general advice only and does not take into account your individual objectives, financial situation, needs or circumstances. Read the Product Disclosure Statement (PDS) and Target Market Determination (TMD) at blackrock.com/au to see if the products referenced are appropriate for you. Before making any investment decision, you should obtain financial advice tailored to you having regard to your individual objectives, financial situation, needs and circumstances. Refer to BIMAL’s Financial Services Guide at blackrock.com/au for more information. This material is not a financial product recommendation or an offer or solicitation with respect to the purchase or sale of any financial product in any jurisdiction. MKTGH0825A/S-4706059.