Playing with fire – lessons from the go-go years
Key takeaways
- Looking at past investment cycles, we have observed that periods of sky-high valuations and market concentration often precede significant market downturns
- Today’s market leaders feel reminiscent of the tech giants of the Nifty Fifty era, and history has shown that sustaining high valuations amid competitive pressures is very challenging over the long term
- With Warren Buffett as an example, we believe long-term investment success hinges not only on successful stock-picking, but also on minimizing the impact of market bubbles and strategically reducing risk during market highs
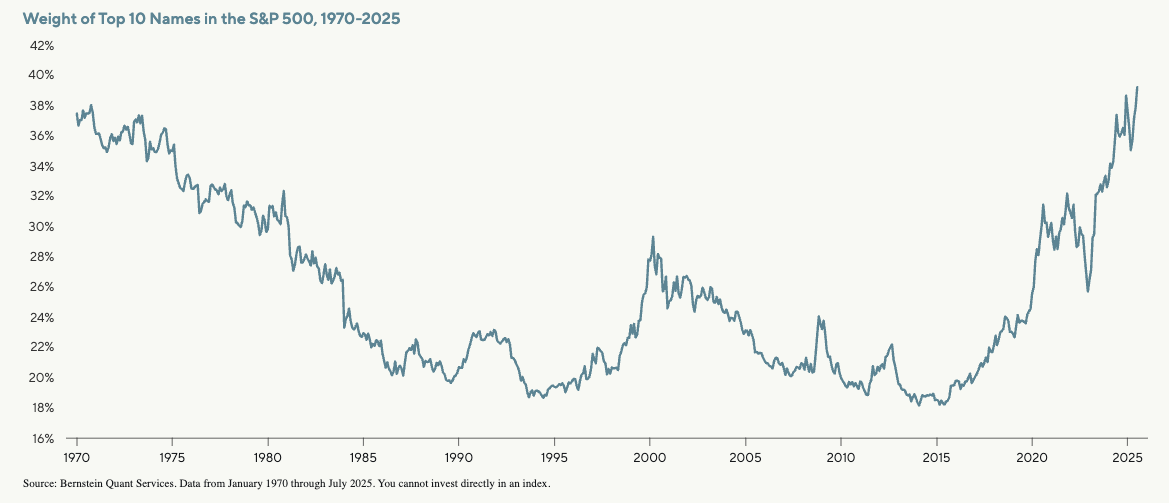
As investors, we have seen this story before—earnings and revenue growth march higher, stock appreciation continues to climb, and the market converges around a handful of appealing companies whose valuations seem to know no limits. We think this is true today and was true in the past, most notably in the 1990s and the late 1960s to early 1970s. As investors who rode the highs during those periods were likely subsequently squashed, might we see a repeat today given current conditions?
In our view, current valuations for market leaders are untenable, and growth prospects of these companies are insufficient to support current market optimism. As a result, we have been actively reducing risk. To share our views within the context of a historical perspective, we present a two part series. Part I is below.
The clever Mr Buffett
In May, America’s most famous investor, Warren Buffett, stepped down from his post at Berkshire Hathaway, having achieved a remarkable record of selecting stocks that appreciated, and equally important, avoiding blowups. While many recognize his skill in stock selection and his willingness to invest during slumps like the 2007-2008 financial crisis, an often-unappreciated element of his successful tenure was his ability to walk away from stock market bubbles. In many ways, his reputation was established in 1969 when he dissolved a successful 12-year-old investment partnership amid the protracted “Go-Go Years.” This era was labeled by hordes of investors who wrongly believed the party would just keep going because the prospects of the underlying companies were good, even if their valuations were stratospherically high.
In the early 1970s, Mr. Buffett’s move seemed premature. A sharp correction led to a rebound and even higher prices in 1973. But that peak was followed by a crash in 1974, and it would take almost a decade for the broad indexes to match their 1973 levels. Buyers who piled into the broader market in 1970 and 1971, years before the peak, would not recover their principal until four to eight years after the market bottom. (Notably, this is in nominal terms and not adjusted for inflation, which was significant at the time.)
The sharp market decline of the mid-1970s had widespread repercussions, wiping out not only the savings of the most optimistic investors but also major brokerage firms, including the second largest, DuPont Walton, and a coterie of fund managers who had gained fame for their commitment to companies with strong prospects.
The Nifty Fifty
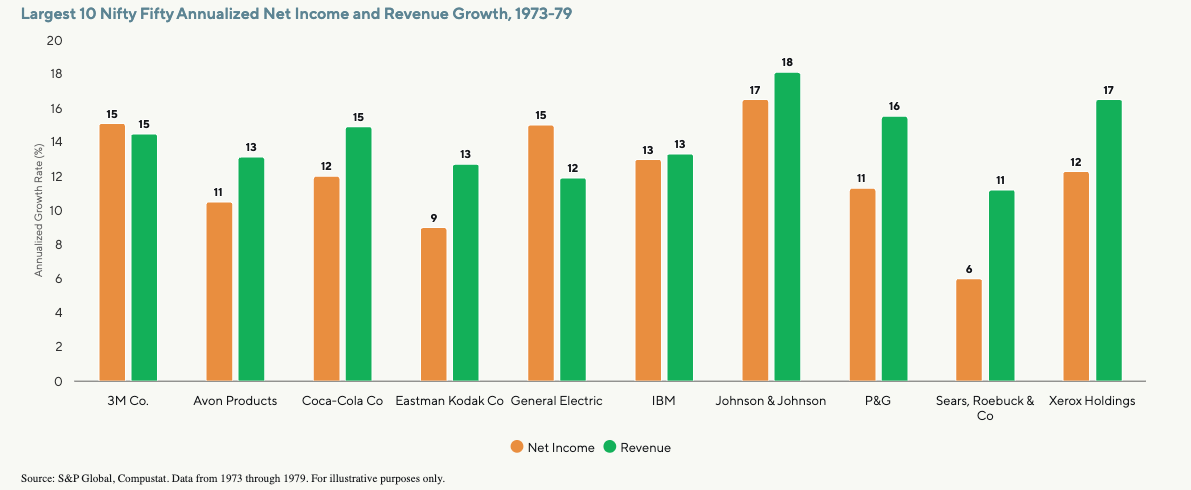
The signature benchmark for the period was the so-called Nifty Fifty, a compilation of large-cap companies in areas like pharmaceuticals, imaging, and cosmetics. Many investors believed these companies would shape the future and should be held in portfolios in perpetuity, regardless of price. To a significant extent, this confidence proved to be somewhat justified. While America’s economy slumped under a combination of rising prices, high interest rates, and persistent inflation throughout the 1970s, earnings and sales for these favoured companies continued to grow.
What eventually collapsed for these companies was their valuations as investors reduced the multiples they were willing to pay for future growth. This was true for both companies that performed well then and continue to do well today, as well as companies that faded into irrelevance over time. After dramatic plunges and modest recoveries, the total return at the end of the 1970s for companies that grew unperturbed to the present day were (-33%) for Johnson & Johnson (NASDAQ: JNJ), (-20%) for Procter & Gamble (NASDAQ: PG), and (-41%) for Coca Cola (NASDAQ: KO).
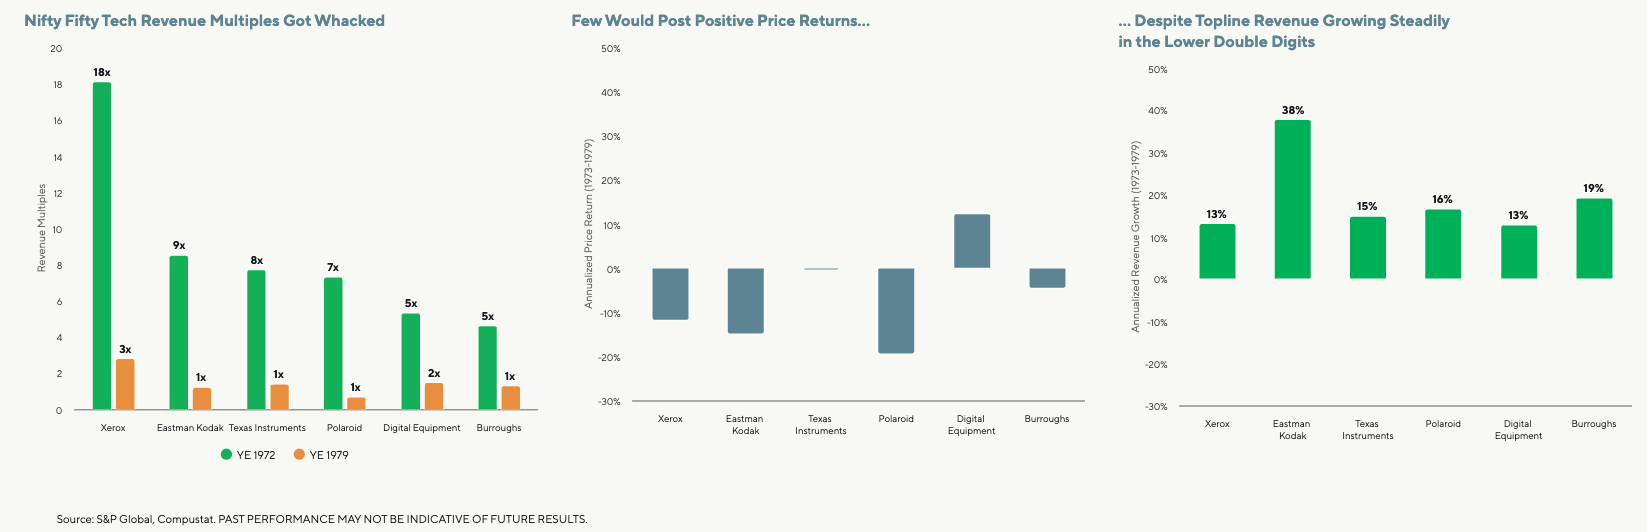
Losses were even more profound for companies that truly excited investors due to their leadership in then-advanced technologies, including Polaroid, Xerox, Kodak, Digital Equipment, Burroughs, and Texas Instruments. In the latter half of the 1970s, these companies experienced an average 80% compression in their price-to-sales multiples—a staggering loss of confidence, in our view. Over the longer term, it became evident that the market had been prescient: all but Texas Instruments fell into reorganization or stumbled and were absorbed into other companies.
Looking back, the most famous defence of the Nifty Fifty’s “buy-at-any-price” approach was published in 1998 by Jeremy Siegel, a professor at the University of Pennsylvania’s Wharton School. He concluded that investors who hung on would have done almost, but not quite, as well as the broader market.(1) A more detailed study by professors at Pomona College in 2002 found that the most highly valued Nifty Fifty companies badly trailed the average.(2) Conversely, the most lucrative holdings turned out to be the most prosaic ones: Philip Morris in the Siegel study and Wal-Mart in the Pomona study.
Apple (NASDAQ: AAPL), Nvidia (NASDAQ: NVDA), and Meta (NASDAQ: META), which are among the most highly valued companies today, provide computing power, imaging, and chips, like the Nifty Fifty’s tech companies from half a century ago. High valuations have historically attracted competition not only from existing companies but also from new ones. Therefore, we believe it is highly possible that they too will face valuation headwinds, if not outright competition, despite their seemingly assured growth prospects.
The Buffett indicator
By any standard, Mr. Buffett’s retirement at the age of 94 would be long overdue. That would have been just as true even two decades ago, when his contrarian sentiments were effectively deployed and he took risk off the table before the chaos of the great financial crisis (GFC).
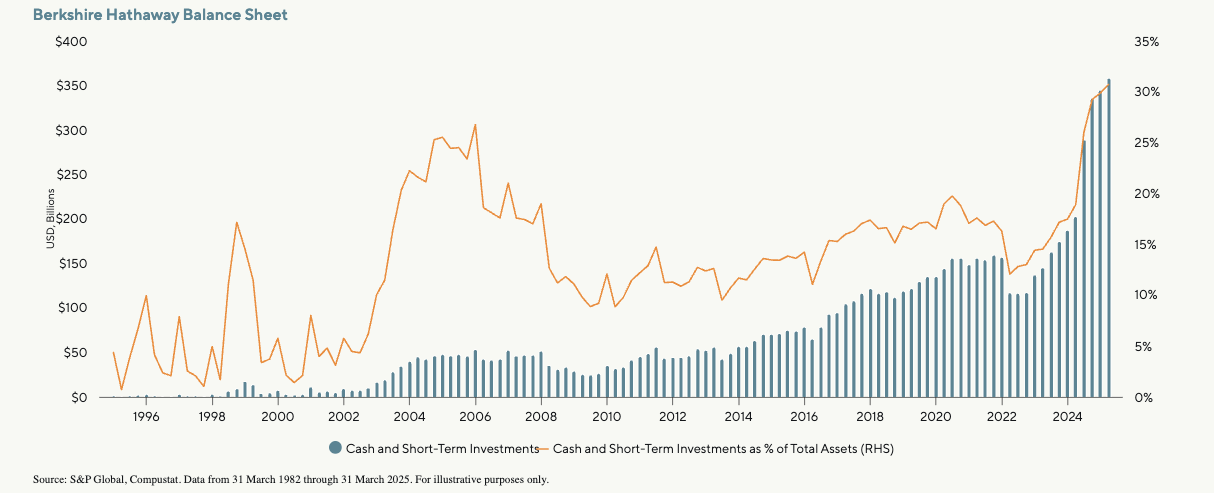
An argument could be made that Mr. Buffett has been walking away from risk in recent years as stock valuations reached new heights. Cash on the balance sheet of Berkshire Hathaway has been steadily rising since 2022 and recently surpassed the prior peak that facilitated his discounted purchases during the GFC.
Berkshire’s large cash position has occurred at the same time that the so-called “Buffett Indicator,” a ratio of the value of American stocks to America’s gross domestic income—a kind of price-to-sales ratio for the overall market—has exceeded the levels of the dotcom boom which preceded yet another bust.
Behind today’s peak is the disproportionate impact of a handful of companies that constitute the modern version of the Nifty Fifty. These are remarkable businesses that have commanding roles in the businesses of the future of technology and artificial intelligence.
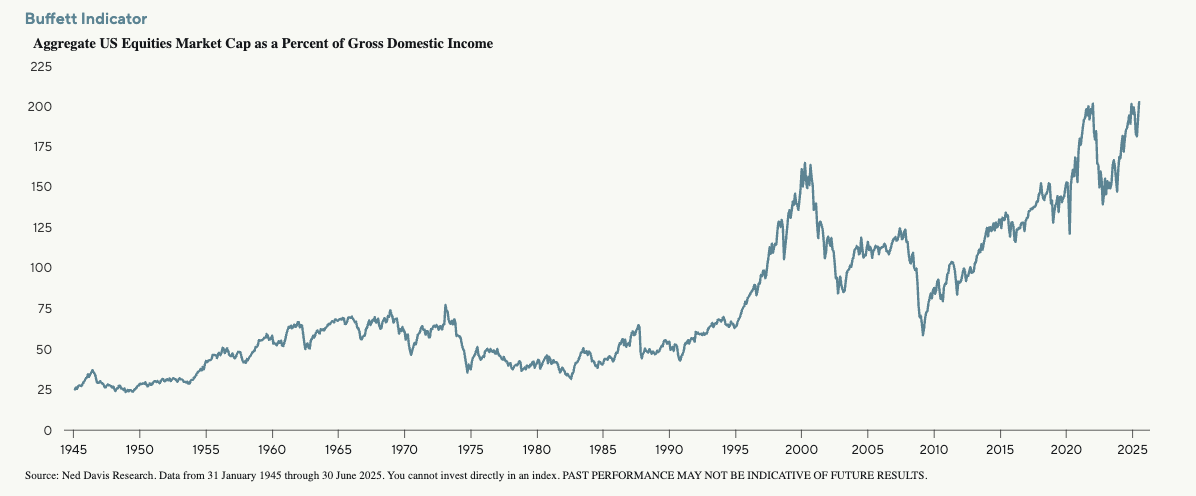
For me, the message of this chart is this: If the percentage relationship falls to the 70%-80% area, buying stocks is likely to work very well for you. If the ratio approaches 200%, as it did in 1999 and part of 2000, you are playing with fire.” – Warren Buffett, Forbes, 2001
We use history not as a predictor but as a guide. Looking at the past 30 years, we reviewed every company in the S&P 500 that traded at or above 10 times revenues to trailing 12-month sales. We found a consistent, disconcerting result: very few were able to maintain these high multiples over time, and on average, the multiple declined by 60% over the ensuing five years. Even the largest markets become saturated, and competitors enter.
There is, of course, the possibility that this time is different. We could be wrong. However, it is also conceivable that the Go-Go Years of the past have made a reappearance. And if market history repeats itself, as it often does, Mr. Buffett will once again have cleverly timed his exit.
Sources: (1) Siegel, Jeremy. “Valuing Growth Stocks: Revisiting the Nifty Fifty.” AAll Journal. October 1998.
(2) Fesenmaier, Jeff. Smith, Gary. “The Nifty-Fifty Re-Revisited.” The Journal of Investing. Fall 2002.
Learn how the industry leaders are navigating today's market every morning at 6am. Access Livewire Markets Today.
All prices and analysis at 13 August 2025. This document was originally published in Livewire Markets on 13 August 2025. This information has been prepared by GQG Partners LLC (“GQG”), a limited liability company and authorised representative of GQG Partners (Australia) Pty Ltd, ACN 626 132 572, AFSL number 515673. The content is distributed by WealthHub Securities Limited (WSL) (ABN 83 089 718 249)(AFSL No. 230704). WSL is a Market Participant under the ASIC Market Integrity Rules and a wholly owned subsidiary of National Australia Bank Limited (ABN 12 004 044 937)(AFSL No. 230686) (NAB). NAB doesn’t guarantee its subsidiaries’ obligations or performance, or the products or services its subsidiaries offer. This material is intended to provide general advice only. It has been prepared without having regard to or taking into account any particular investor’s objectives, financial situation and/or needs. All investors should therefore consider the appropriateness of the advice, in light of their own objectives, financial situation and/or needs, before acting on the advice. Past performance is not a reliable indicator of future performance. Any comments, suggestions or views presented do not reflect the views of WSL and/or NAB. Subject to any terms implied by law and which cannot be excluded, neither WSL nor NAB shall be liable for any errors, omissions, defects or misrepresentations in the information or general advice including any third party sourced data (including by reasons of negligence, negligent misstatement or otherwise) or for any loss or damage (whether direct or indirect) suffered by persons who use or rely on the general advice or information. If any law prohibits the exclusion of such liability, WSL and NAB limit its liability to the re-supply of the information, provided that such limitation is permitted by law and is fair and reasonable. For more information, please click here.