Unemployment rate steady at 4.1% in May
Tapas Strickland | Market Economics
Key points:
- Unemployment rate held at 4.1% (4.057% unrounded)
- Employment fell -2.5k vs, but trend reasonable at 28k m/m
- Squaring the circle, part rate fell a tenth to a still elevated 67.0%
- NAB still expects a July RBA rate cut, and terminal at 3.1% by November
- Stable unemployment suggests little rationale to cut below neutral
Details:
The unemployment rate in May held steady at 4.1% (consensus 4.1%; NAB 4.1%) and has been averaging 4.0-4.1% in a trend sense since March 2024. The surprise this month was employment which fell -2.5k (consensus 21.2k; NAB 30.0k) after having increased by 87.6k in April. Looking through the volatility, trend employment growth has been averaging around 28k a month.
The participation rate fell back a tenth after its three-tenths rise in April to a still very elevated 67.0%. Other measures of the labour market such as underemployment fell a tenth to 5.9%, with the underemployment rate is broadly where it was in February 2023. Hours worked rose 1.3% m/m to bring it in line with the level of employment growth after it fell in April which coincided with the bookended ANZAC/Easter holiday period and weather disruptions.
The full/part time split of employment was favourable (full +38.7k; part -41.1k), but given the volatility shown in the split we suggest not reading too much into this. Across the states the unemployment rate remains a little more elevated in VIC (4.4%) than in NSW (4.1%) or WA (3.9%). Interestingly the unemployment rate fell to 3.7% in QLD, which if sustained would have unemployment at its lowest levels since 2023.
Implications:
For the quarter average so far, the unemployment rate at 4.1% is a marginal one-tenth below the RBA’s May SoMP forecast of 4.2%. We think there are good reasons to believe the labour market is not as tight as the headline unemployment rate suggests and we still look for the RBA to cut rates in July, followed by August and November to take the cash rate to 3.1% - a rate which we consider to be around neutral.
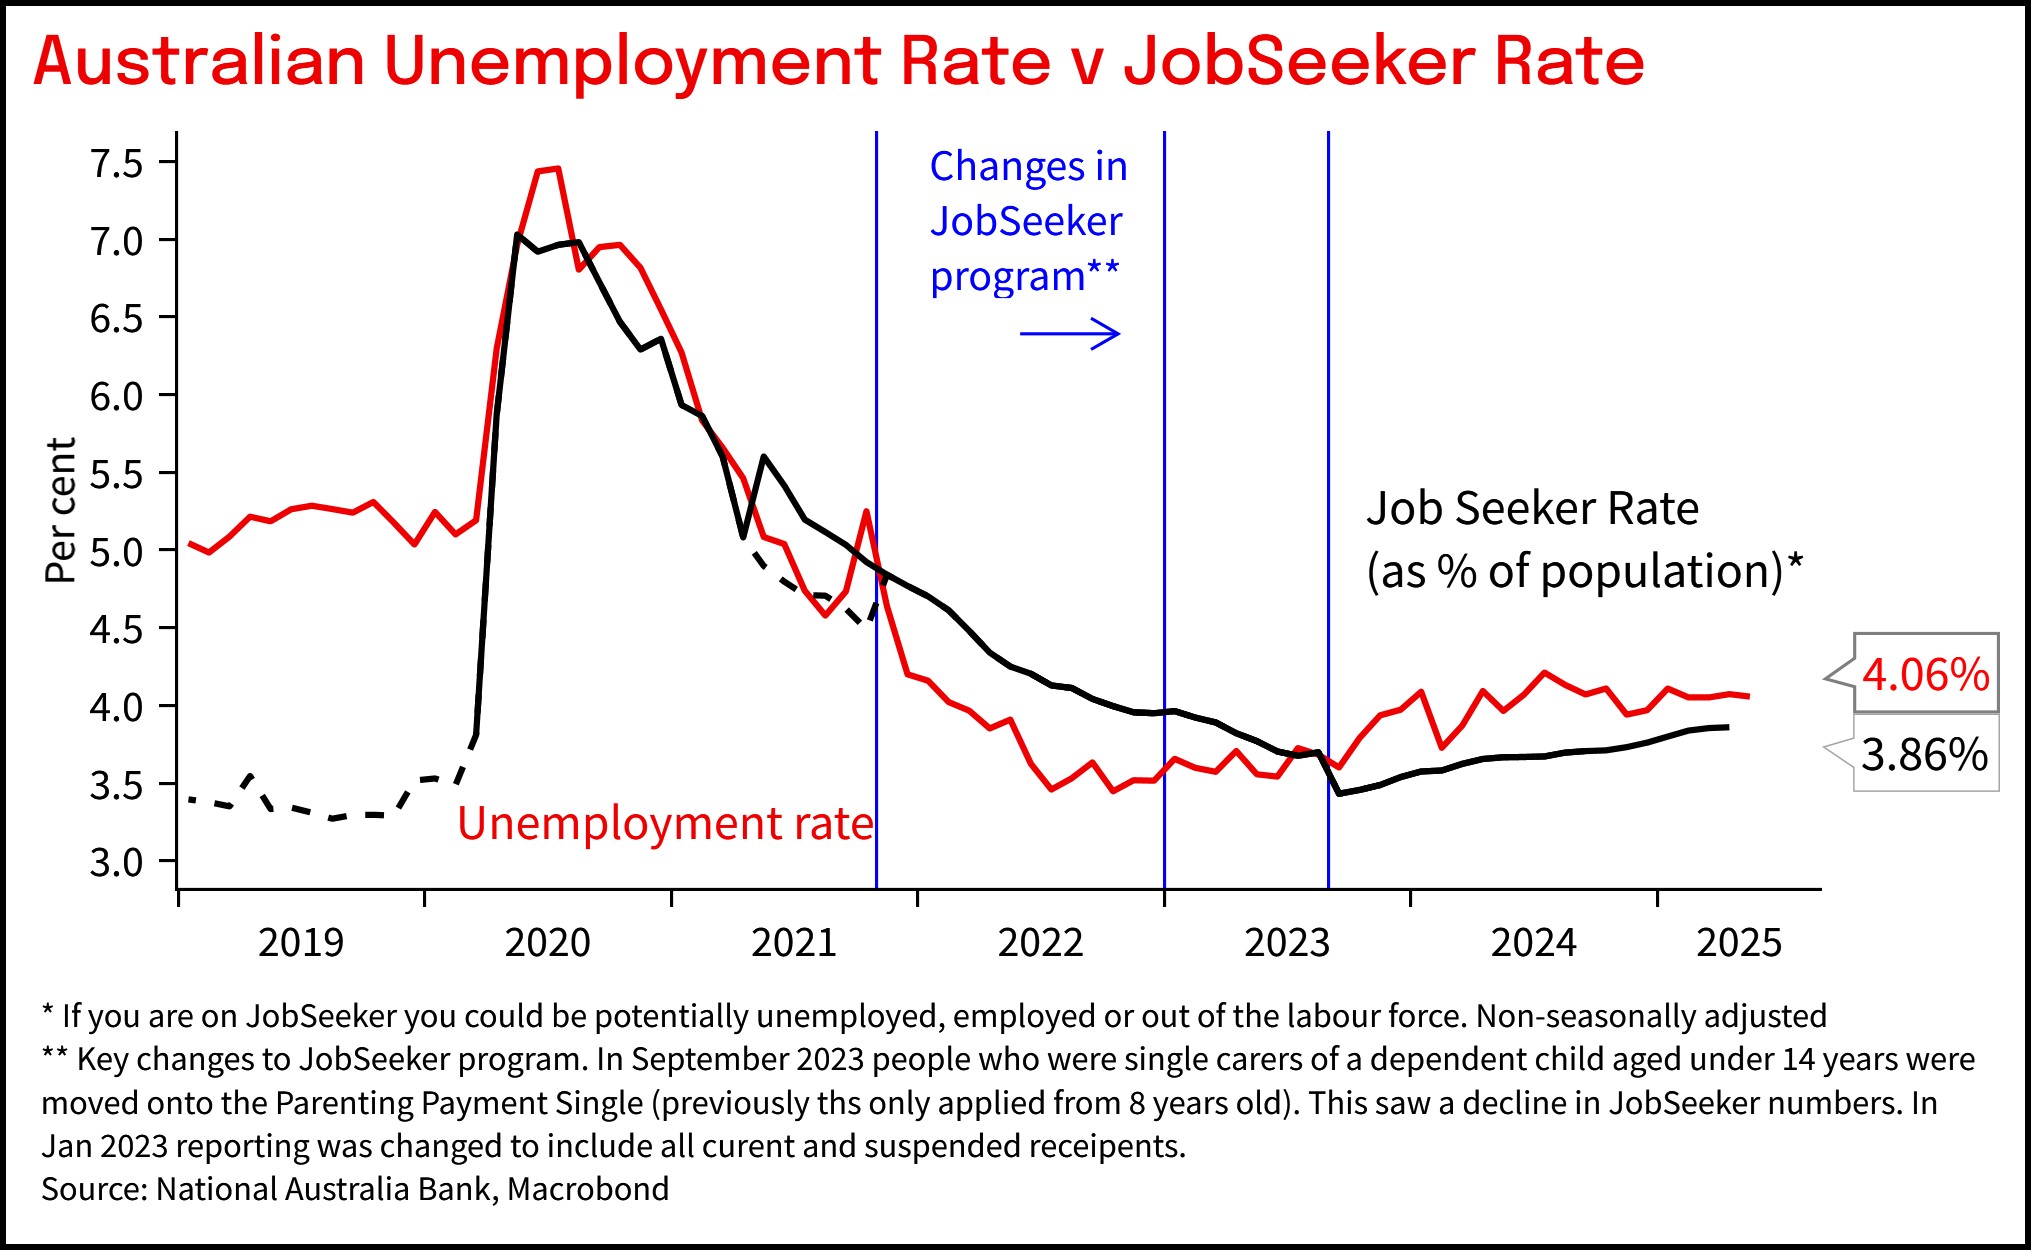
The puzzle for policy makers and economists is in reconciling soft activity growth and what appears to be a remarkably steady unemployment rate. That steadiness is also seen in the JobSeeker (unemployment benefit) rate which has also been broadly steady. A high share of government hiring in the post pandemic period is one part of the explanation. But the steadiness in the unemployment rate will also likely keep the RBA cautious in assessing how supportive policy needs to be.
Chart 1: The unemployment rate held steady at 4.1% in May
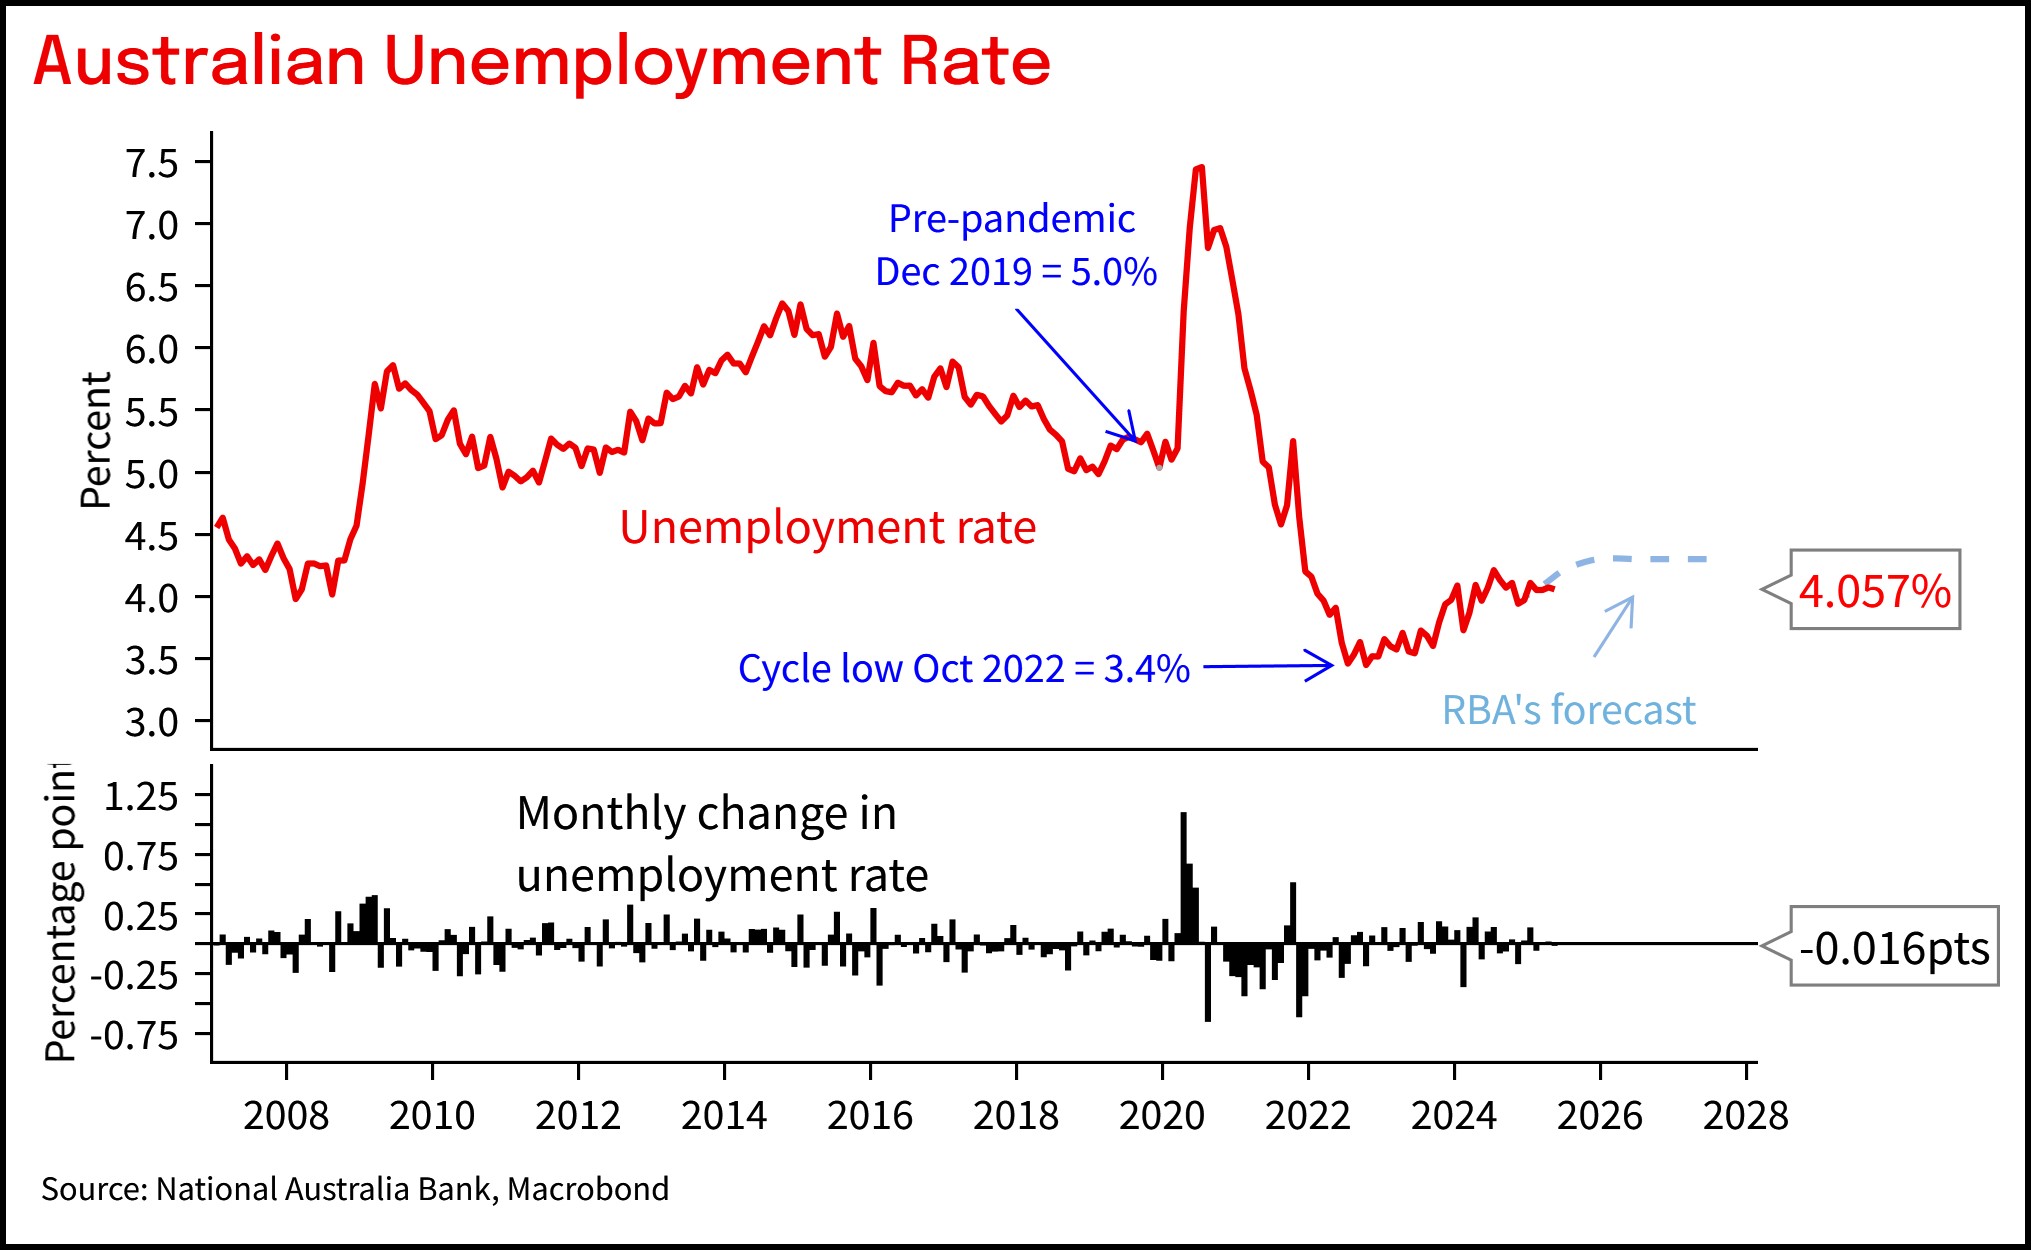
Chart 2: Looking through volatility, trend employment growth remains solid
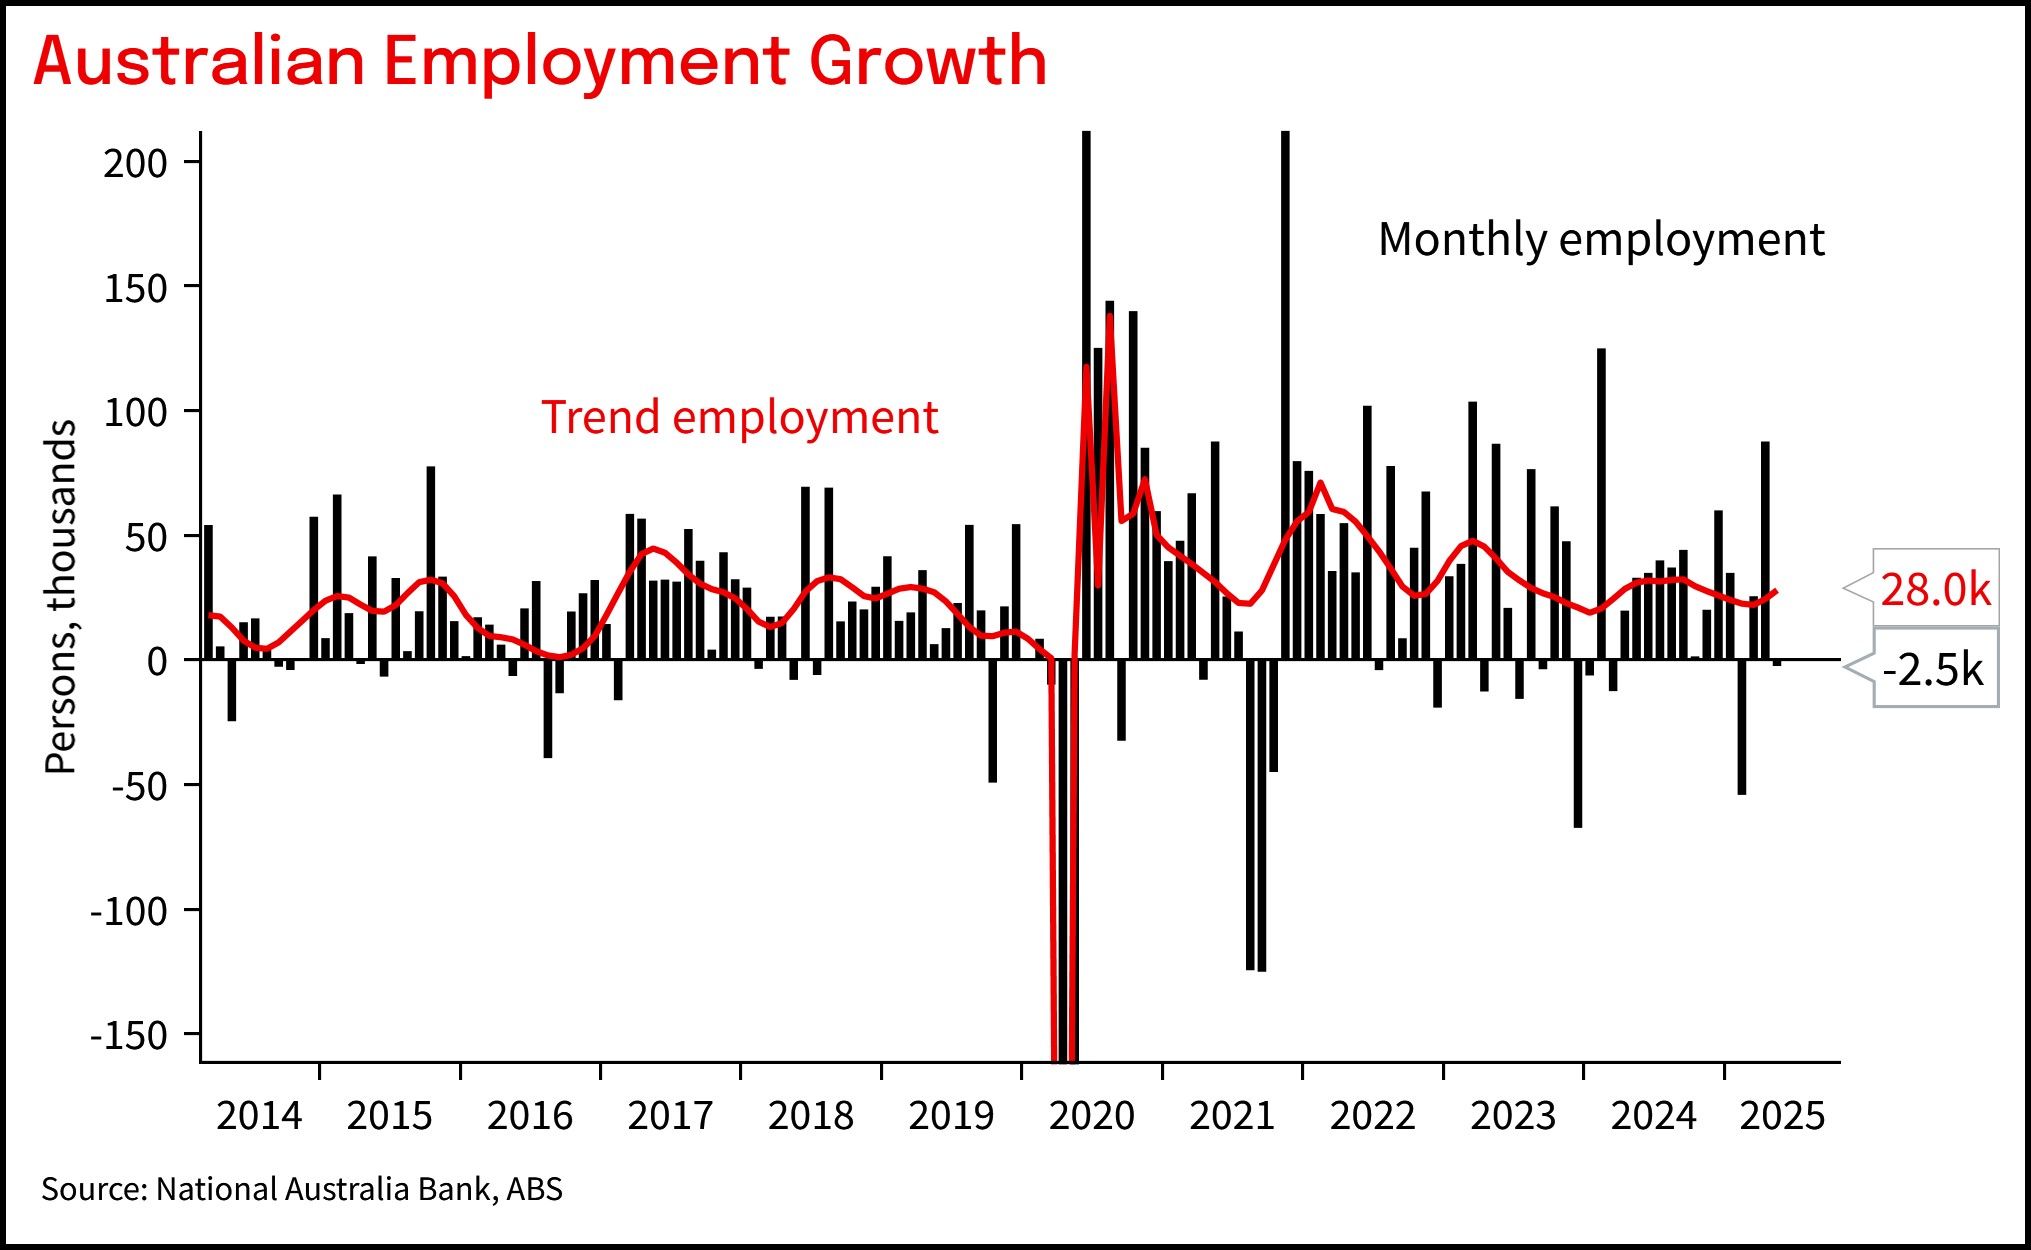
Chart 3: Par rate fell back a tenth after rising three tenths last month
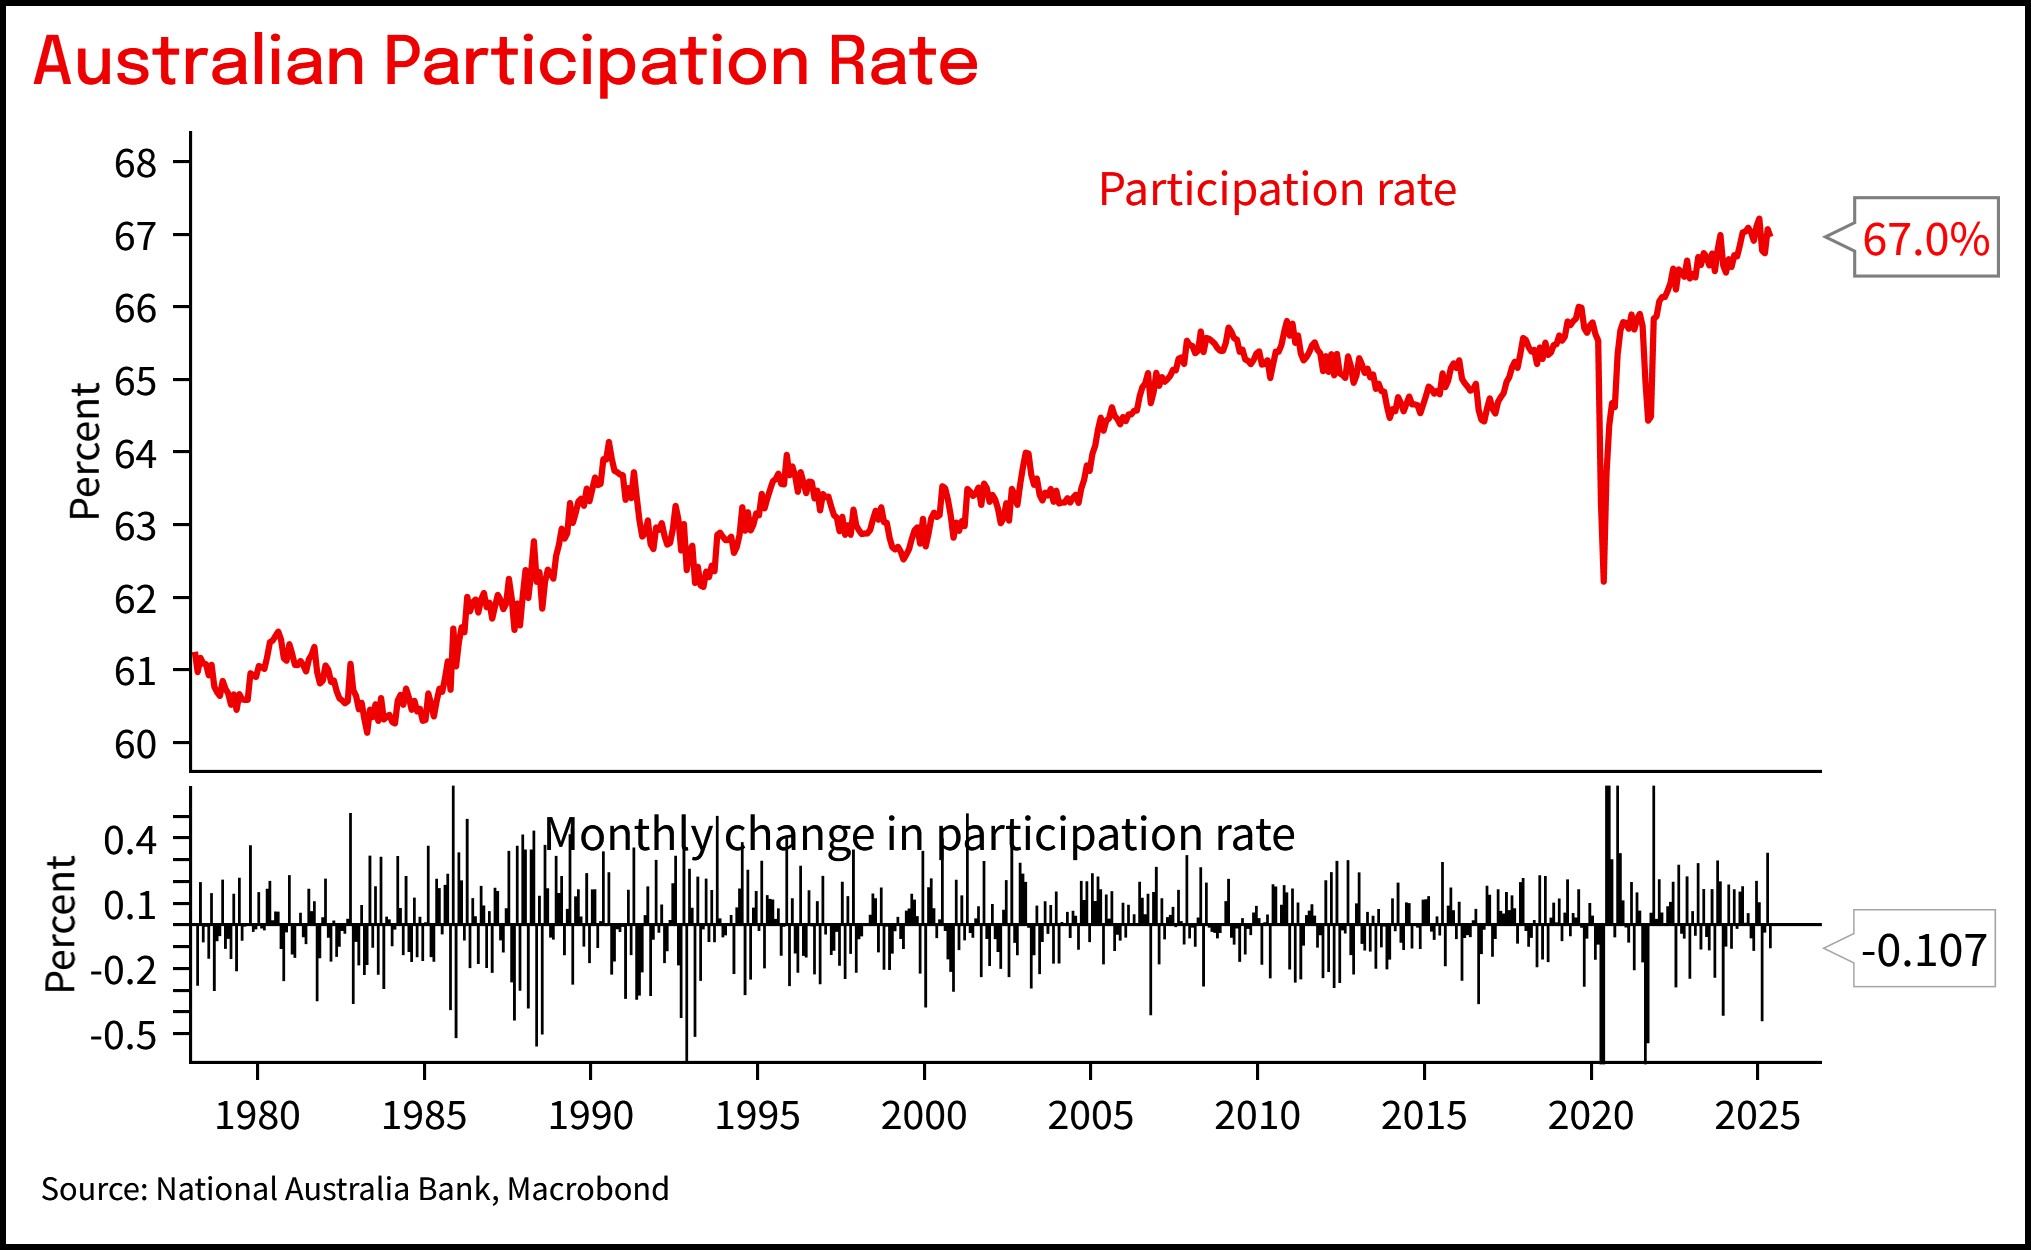
Chart 4: Hours worked rose to be more consistent with the level of employment
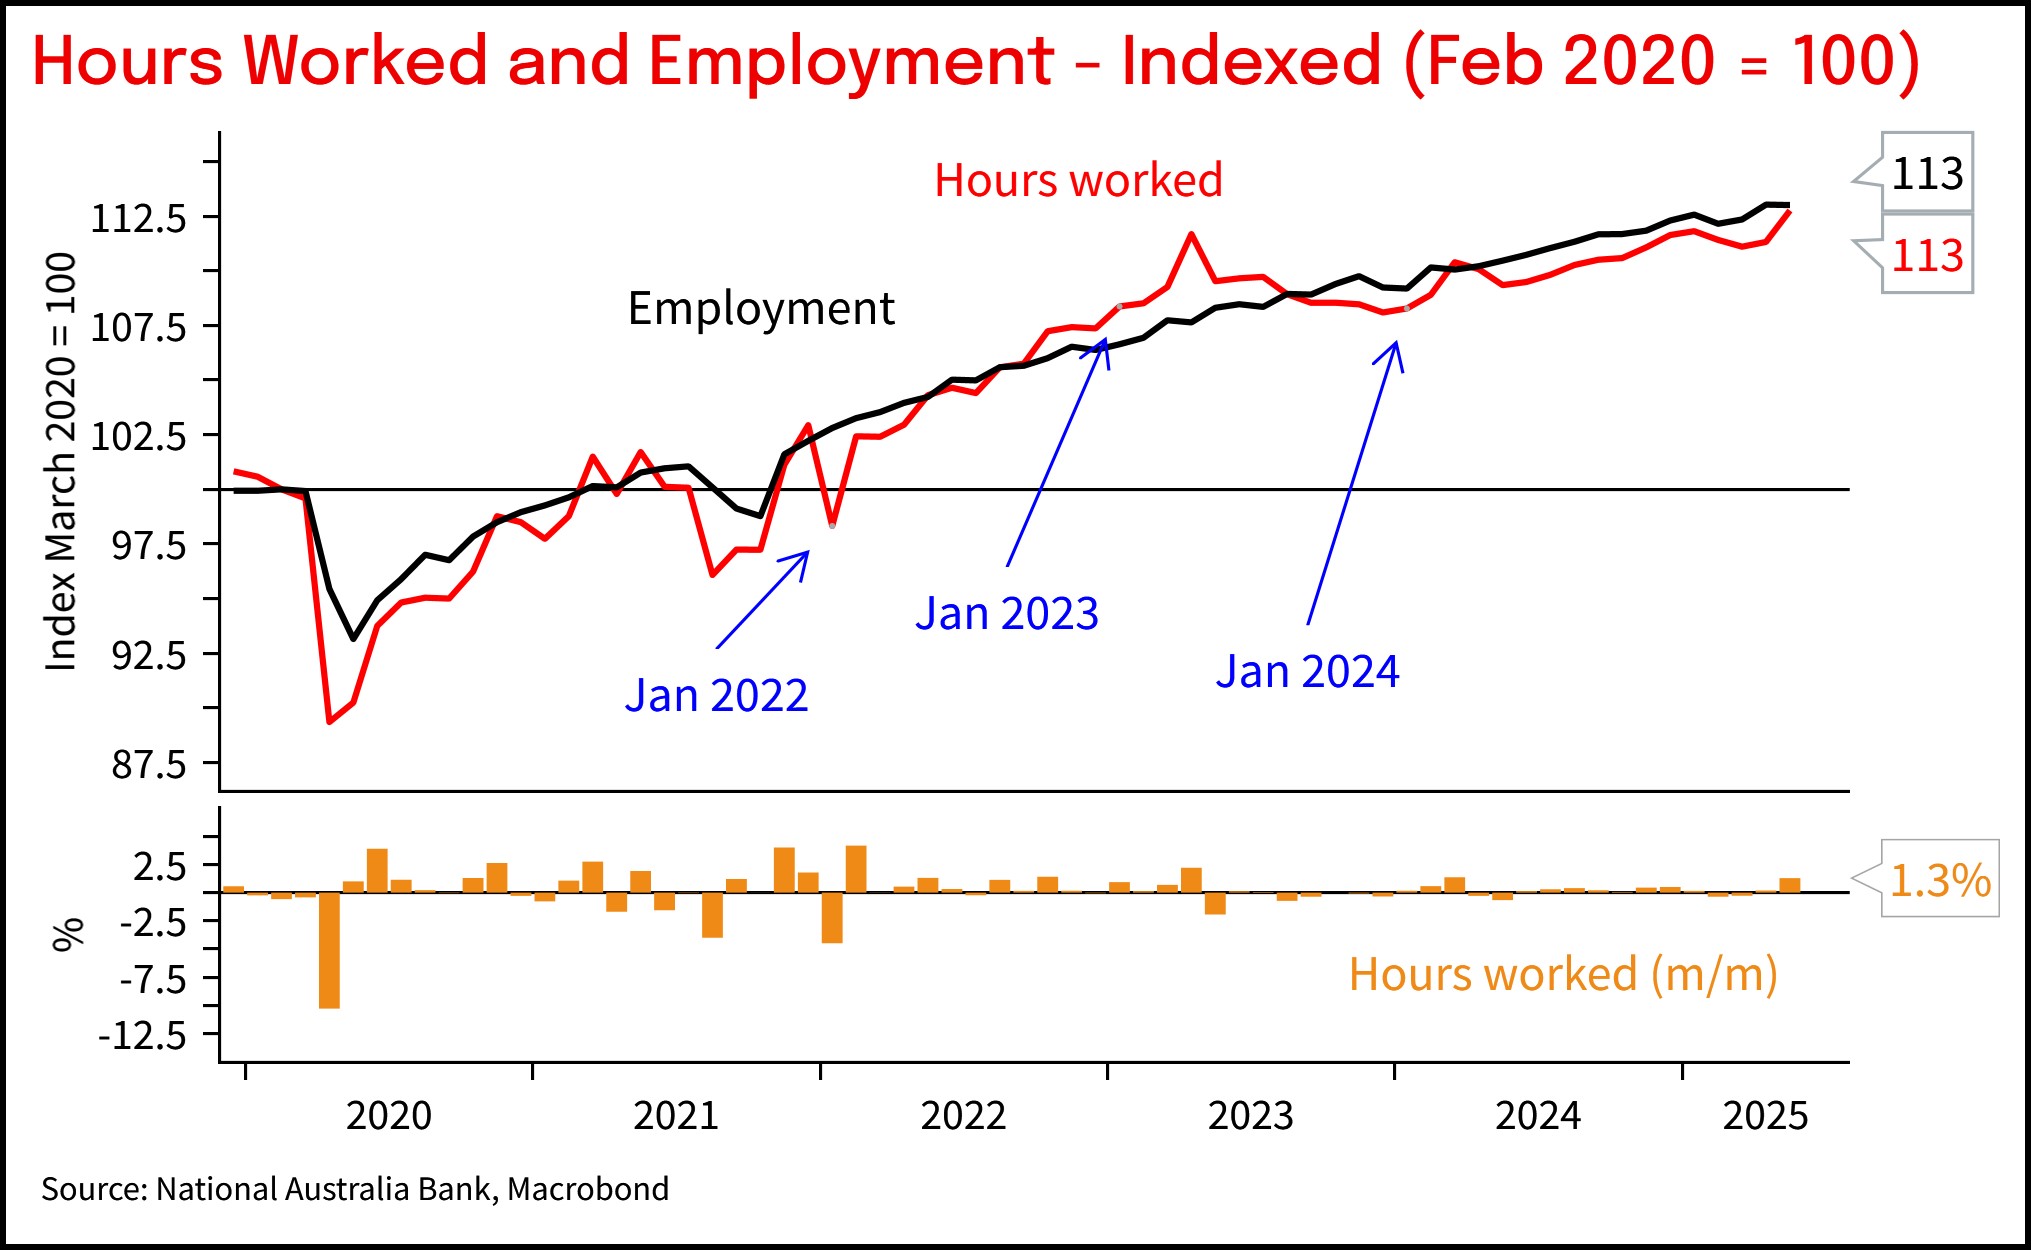
Chart 5: VIC unemployment still higher than elsewhere, QLD very low
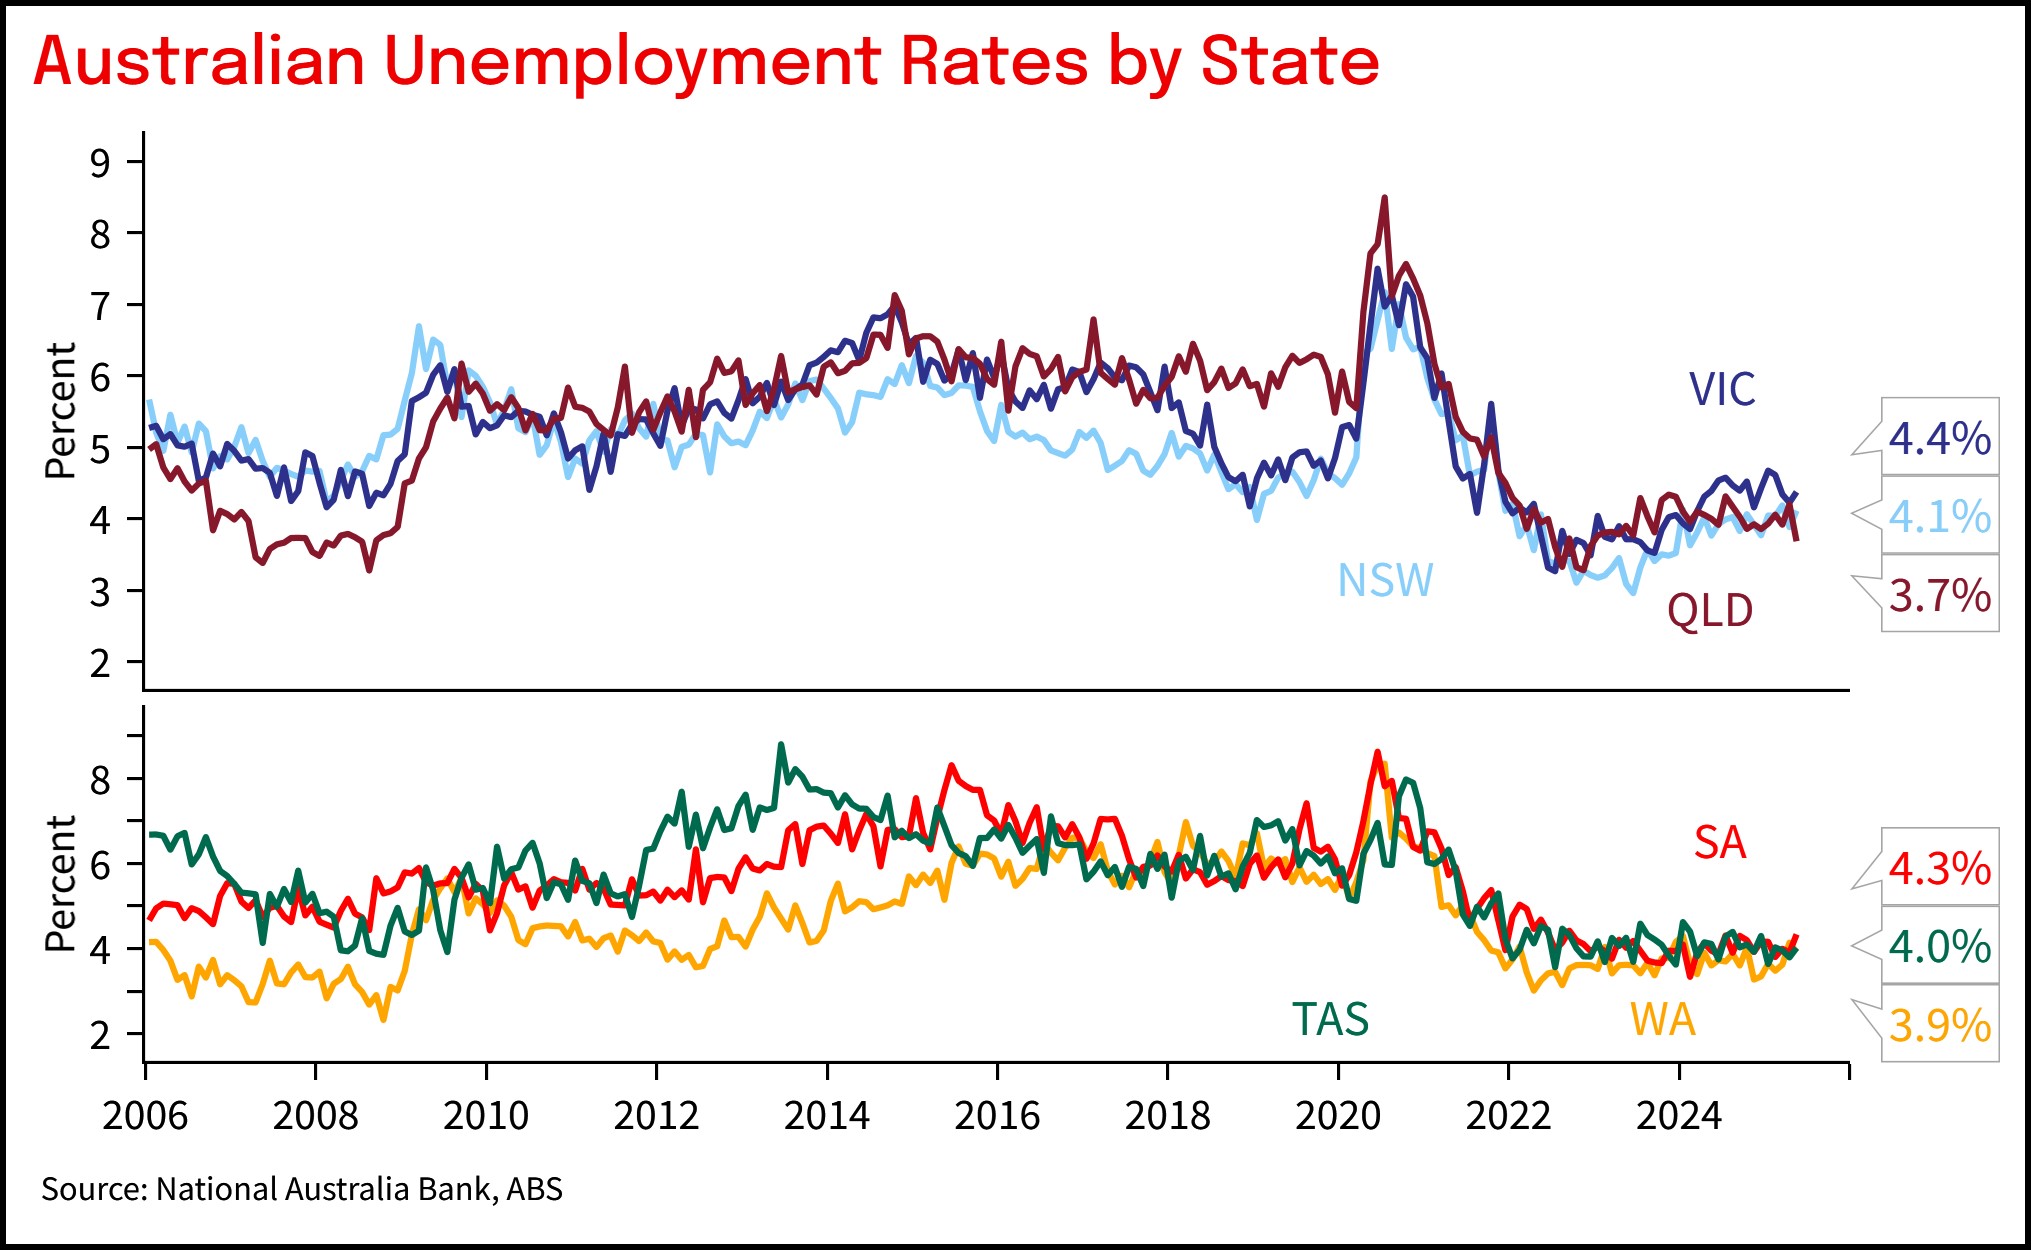
Chart 6: Australian unemployment rate steady and similar to the US
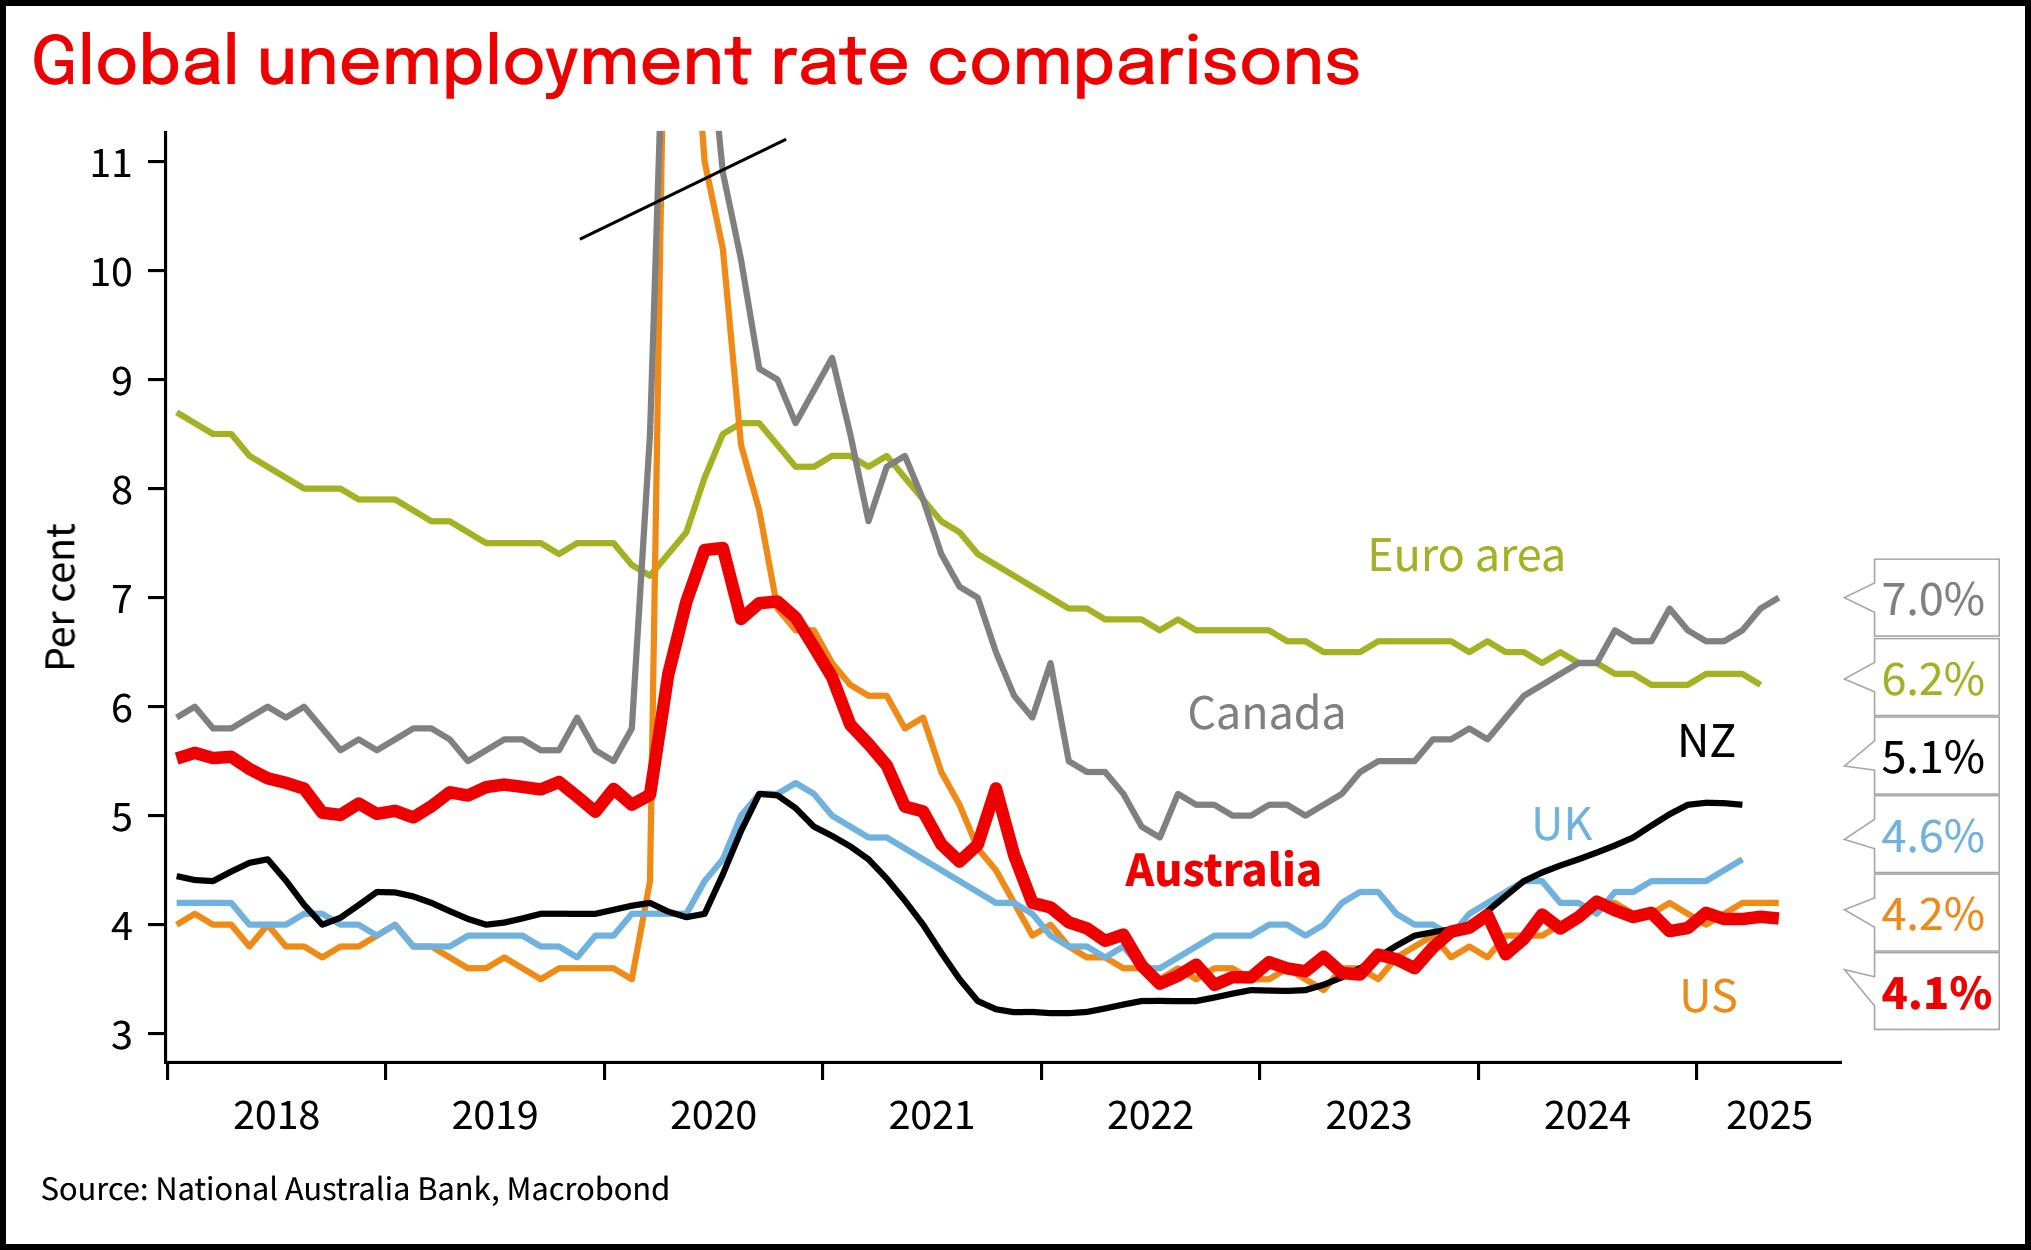
Chart 7: In contrast to offshore, the particpation rate in Australia has remained high
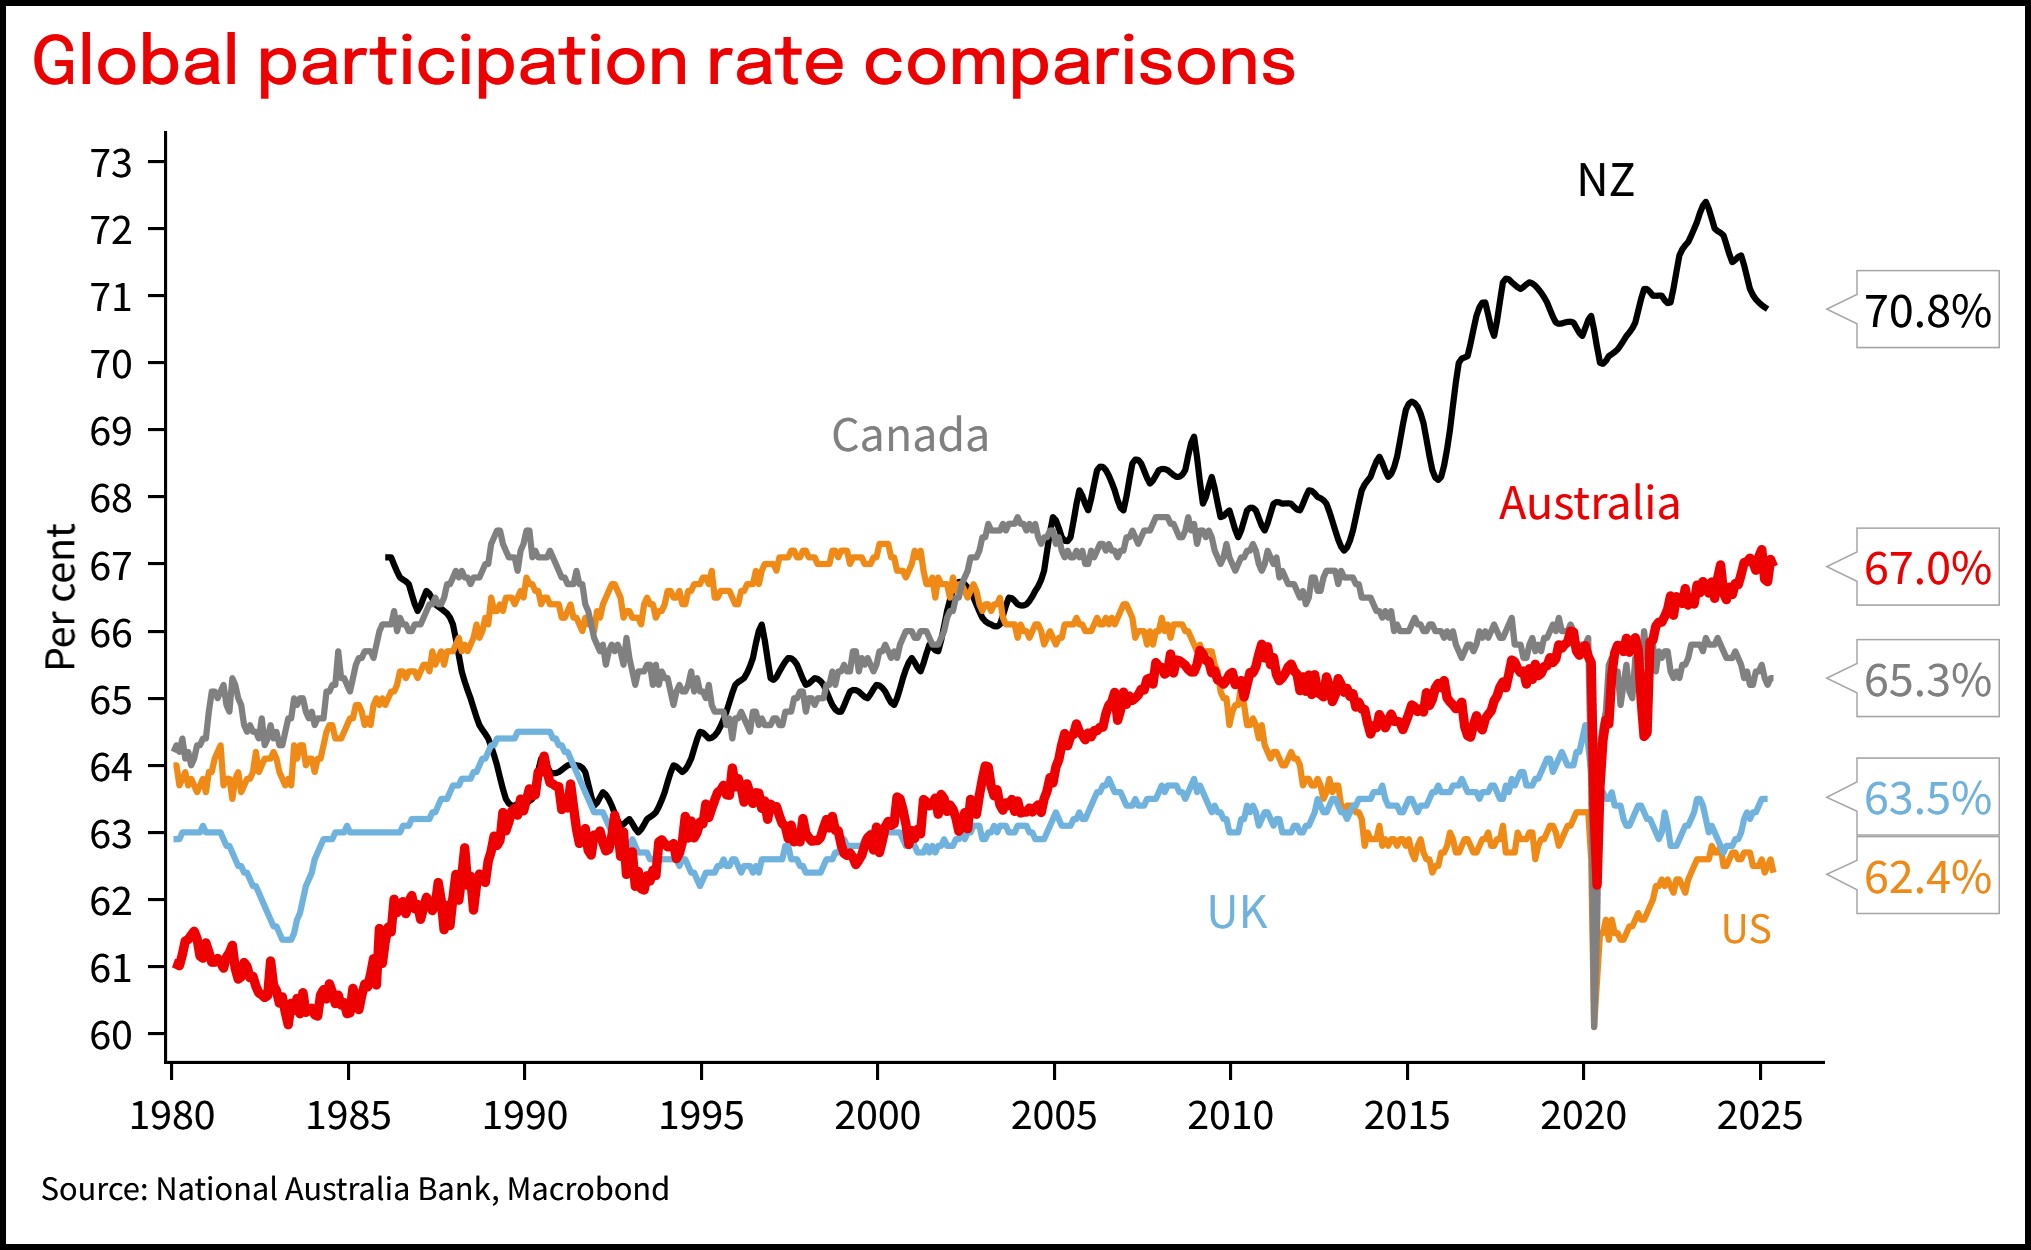
Chart 8: Unemployment rate showing similar trends to unemployment benefits
This document has been prepared by National Australia Bank Limited ABN 12 004 044 937 AFSL 230686 ("NAB"). Any advice contained in this document has been prepared without taking into account your objectives, financial situation or needs. Before acting on any advice in this document, NAB recommends that you consider whether the advice is appropriate for your circumstances. NAB recommends that you obtain and consider the relevant Product Disclosure Statement or other disclosure document, before making any decision about a product including whether to acquire or to continue to hold it. Please Click Here to view our disclaimer and terms of use. Please Click Here to view our NAB Financial Services Guide.
All prices and analysis at 19 June 2025. This information has been prepared by National Australia Bank Limited ABN 12 004 044 937 AFSL 230686 ("NAB"). The content is distributed by WealthHub Securities Limited (WSL) (ABN 83 089 718 249)(AFSL No. 230704). WSL is a Market Participant under the ASIC Market Integrity Rules and a wholly owned subsidiary of National Australia Bank Limited (ABN 12 004 044 937)(AFSL No. 230686) (NAB). NAB doesn’t guarantee its subsidiaries’ obligations or performance, or the products or services its subsidiaries offer. This material is intended to provide general advice only. It has been prepared without having regard to or taking into account any particular investor’s objectives, financial situation and/or needs. All investors should therefore consider the appropriateness of the advice, in light of their own objectives, financial situation and/or needs, before acting on the advice. Past performance is not a reliable indicator of future performance. Any comments, suggestions or views presented do not reflect the views of WSL and/or NAB. Subject to any terms implied by law and which cannot be excluded, neither WSL nor NAB shall be liable for any errors, omissions, defects or misrepresentations in the information or general advice including any third party sourced data (including by reasons of negligence, negligent misstatement or otherwise) or for any loss or damage (whether direct or indirect) suffered by persons who use or rely on the general advice or information. If any law prohibits the exclusion of such liability, WSL and NAB limit its liability to the re-supply of the information, provided that such limitation is permitted by law and is fair and reasonable. For more information, please click here.