Five charts to keep in mind in uncertain times like now
Dr Shane Oliver | AMP
Every so often the degree of uncertainty around investment markets surges and that’s been the case this year with President Trump’s tariffs.
It’s gone into hyperdrive in the last week with Israel attacking Iran, Iran retaliating and now the US using its bunker busting bombs on Iran’s three “key nuclear enrichment facilities [that] have been completely and totally obliterated” according to Trump (although their obliteration is being questioned).
While the loss of life in any war is horrible share markets only get really concerned if there is a meaningful economic disruption – and the main way this can occur from conflicts in the Middle East is via disruption to oil supplies. So far, oil prices are up on the uncertainty - but only by 12% since the war started & it’s still below average 2024 levels.
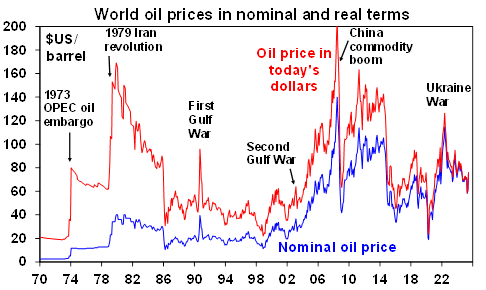
Source: Bloomberg, AMP
However, the US intervention has substantially increased the risk, with the key being what Iran does. If after a few token moves, Iran prioritises regime survival and “surrenders unconditionally” as Trump demands, then oil prices will quickly settle down and shares will rally. This market reaction is basically what happened when the US coalition entered the first and second Gulf wars.
However, Iran has said it “reserves all options” and is reportedly considering its response. This could involve an attack on US military bases in the region which, if more than a token attack, would likely see retaliation by the US and keep markets on edge. Or it could see Iran strike neighbouring oil producers (unlikely) or disrupt shipping in the Strait of Hormuz.
As 20% of global oil supplies and 25% of LNG trade flows through the Strait any disruption could push oil prices above $US100 a barrel, possibly to around $US150/barrel.
This would likely only be brief, as the US military would likely quickly move to stop Iran.
But even if it’s only for a few weeks it would still be a big blow to confidence regarding the economic outlook and so could push shares down by 5-10% at least. $US100 a barrel oil could add another 25 cents a litre to Australian petrol prices on top of the 15 cents a litre rise implied by current oil prices.
But trying to work out how all this plays out is not easy. As always, the turmoil is being met with much prognostication, some of which is enlightening but much is just noise adding to uncertainty. No one likes to see falls in the value of their investments so in times of uncertainty a natural inclination is to retreat to safety.
But as my colleague Diana Mousina has shown here, looking at shares around major geopolitical events, the typical playout is for a sharp fall initially averaging around 8% but then a recovery over the next 12 months averaging around 14%.
Of course, each shock is different with wide ranges around these averages. And more fundamentally given the uncertainty now is a critical time to stick to basic principles of investing.
This note revisits five charts I find useful in times of uncertainty.
Chart #1 - The power of compound interest
This is my favourite chart. It shows the value of $1 invested in various Australian assets in 1900 allowing for the reinvestment of dividends and interest along the way.
That $1 would have grown to $271 if invested in cash, to $987 if invested in bonds and to $989,055 if invested in shares up until the end of May.
While the average return since 1900 is only double that in shares relative to bonds, the huge difference between the two owes to the impact of compounding - or earning returns on top of returns over time.
So, any return earned in one period is added to the original investment so that it all earns a return in the next period. And so on. Out of interest, residential property is similar to shares over the long term.
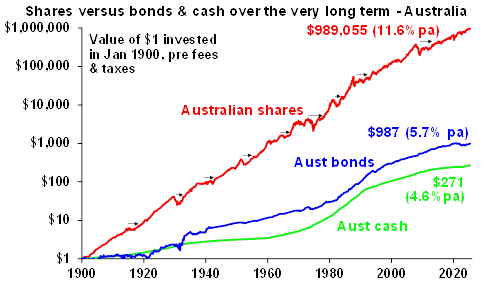
Source: Bloomberg, AMP
Key message: to grow our wealth, we must have exposure to growth assets like shares and property.
Chart #2 - Don’t get blown off by cyclical swings
The trouble is that shares can have lots of setbacks along the way, e.g. as highlighted by the arrows on the previous chart.
Even annual returns in the share market are highly volatile, but longer-term returns tend to be solid and relatively smooth, as can be seen in the next chart. Since 1900, for Australian shares roughly two years out of ten have had negative returns but there are no negative returns over rolling 20-year periods.
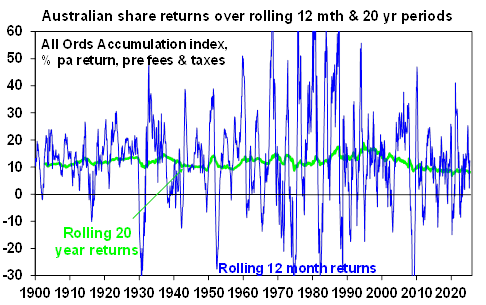
Source: Bloomberg, AMP
Understanding that these periodic setbacks are just an inevitable part of investing is important in being able to stay the course and get the benefit of the higher long-term returns shares and other growth assets provide.
Key message: short-term violent swings in share markets are a fact of life but the longer the time horizon, the greater the chance your investments will meet their goals. So, in investing, time is on your side and it’s best to invest for the long-term when you can.
Chart #3 - The roller coaster of investor emotion
It’s well-known investment markets move more than can be justified by moves in investment fundamentals, because investor emotion plays a huge part. The next chart shows the roller coaster that investor emotion traces through the course of an investment cycle.
Once a cyclical bull market turns into a bear market, euphoria gives way to anxiety, denial, capitulation and ultimately depression at which point the asset class is under loved and undervalued and everyone who is going to sell has – and it becomes vulnerable to good (or less bad) news.
This is the point of maximum opportunity for investors to buy into an asset at depressed prices. Once the cycle turns up again, depression gives way to hope, optimism and eventually euphoria. This is the point of maximum risk.
The roller coaster of investor emotion
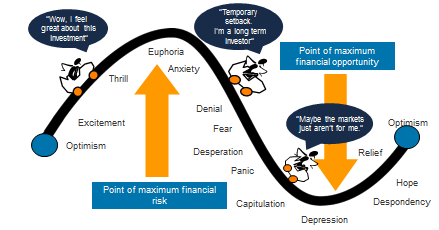
Source: Russell Investments, AMP
Key message: investor emotion plays a huge role in driving swings in markets. The key for investors is not to get sucked into this emotional roller coaster. Of course, this is easier said than done, so many investors end up getting wrong footed – by buying at the top when everyone is bullish and selling at the bottom when everyone is bearish (like back in April on tariffs, or maybe soon on worries about the Middle East).
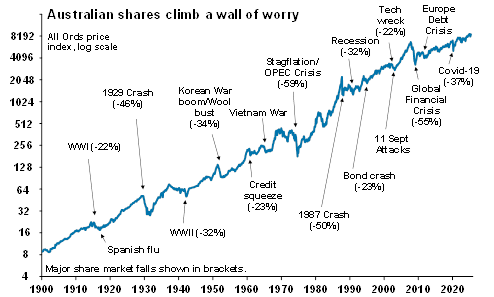
Chart #4 - The wall of worry
There is always something for investors to worry about. And in a world where social media is competing intensely with old media it’s more magnified and so seems more worrying.
This is arguably evident again now in relation to uncertainty about tariffs and the war in the Middle East, with Trump’s contradictory and confusing utterances providing perfect clickbait but serving to add to fears.
The global economy has had plenty of worries over the last century, but it got over them with Australian shares returning 11.6% per annum since 1900, with a broad rising trend in the All Ords price index as evident in the next chart, and US shares returning 10% pa.
Note that this chart shows the All Ords share price index whereas the first chart shows the value of $1 invested in the All Ords accumulation index, which allows for capital growth & dividends.
Source: ASX, AMP
Key message: worries are normal around the economy and investments and sometimes they become intense – like now. But they eventually pass.
Chart #5 - Timing is hard
With the benefit of hindsight many swings in markets around things like the GFC and the 2022 inflation surge look inevitable and so it’s natural to think why not switch between say cash and shares within your super fund to anticipate market moves.
This is particularly the case in times of emotional stress when the news is bad. But trying to time the market is difficult. A good way to demonstrate this is with a comparison of returns if an investor is fully invested in shares versus missing out on the best (or worst) days.
The next chart shows that if you were fully invested in Australian shares from January 1995, you would have returned 9.6% pa (with dividends but not allowing for franking credits, tax and fees).
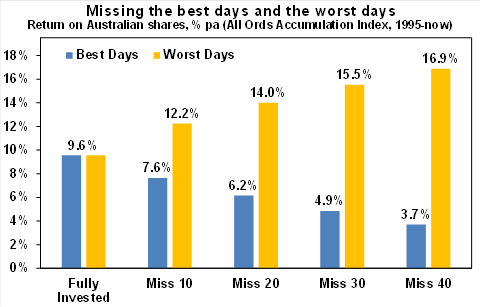
Covers Jan 1995 to May 2025. Source: Bloomberg, AMP
If by trying to time the market you avoided the 10 worst days (yellow bars), you would have boosted your return to 12.2% pa. And if you avoided the 40 worst days, it would have been 16.9% pa!
But many investors only get out after bad days and miss some of the best days.
If by trying to time the market you miss the 10 best days (blue bars), the return falls to 7.6% pa. If you miss the 40 best days, it drops to just 3.7% pa.
Key message: trying to time the share market is not easy. For most its best to stick to an appropriate well thought-out long-term investment strategy.
Learn how the industry leaders are navigating today's market every morning at 6am. Access Livewire Markets Today.
All prices and analysis at 23 June 2025. This document was originally published in Livewire Markets on 23 June 2025. This information has been prepared by AWM Services Pty Ltd (ABN 15 139 353 496)(AFSL No. 366121), part of the AMP Group. The content is distributed by WealthHub Securities Limited (WSL) (ABN 83 089 718 249)(AFSL No. 230704). WSL is a Market Participant under the ASIC Market Integrity Rules and a wholly owned subsidiary of National Australia Bank Limited (ABN 12 004 044 937)(AFSL No. 230686) (NAB). NAB doesn’t guarantee its subsidiaries’ obligations or performance, or the products or services its subsidiaries offer. This material is intended to provide general advice only. It has been prepared without having regard to or taking into account any particular investor’s objectives, financial situation and/or needs. All investors should therefore consider the appropriateness of the advice, in light of their own objectives, financial situation and/or needs, before acting on the advice. Past performance is not a reliable indicator of future performance. Any comments, suggestions or views presented do not reflect the views of WSL and/or NAB. Subject to any terms implied by law and which cannot be excluded, neither WSL nor NAB shall be liable for any errors, omissions, defects or misrepresentations in the information or general advice including any third party sourced data (including by reasons of negligence, negligent misstatement or otherwise) or for any loss or damage (whether direct or indirect) suffered by persons who use or rely on the general advice or information. If any law prohibits the exclusion of such liability, WSL and NAB limit its liability to the re-supply of the information, provided that such limitation is permitted by law and is fair and reasonable. For more information, please click here.