Unemployment still moving sideways as employment bounces
Taylor Nugent | Markets Research
Key points:
- The unemployment rate was steady at 4.1% in April (NAB and consensus 4.1%)
- Employment surprised sharply higher at +89k (Consensus +22.5, NAB +25)
- The participation rate rebounded to 67.1% (NAB and consensus 66.8%)
- Looking through the month-to-month volatility, trend employment growth at 26k has been keeping pace with population growth and the unemployment rate has been moving sideways.
Bottom line and assessment
The unemployment rate was 4.1% in April, unchanged from March. March data did not show much statistical payback from February’s sharp recorded fall in employment and drop in participation rate, but it came this month instead. The 89k surge in employment growth was alongside a 3-tenth lift in the participation rate. That takes the participation rate back near December/January levels and offsets tentative slowing that had been suggested in trend employment growth.
The throughline of recent volatility in employment data is an unemployment rate that has tracked sideways. We continue to assess that the labour market is close to balance and do not view an unemployment rate in the low 4s as a barrier to sustaining inflation near target, as discussed in a recent macro thematic - ‘RBA not yet convinced on lower NAIRU’. That said, nothing about the recent data flow suggests the RBA’s views on this slow-moving assessment need evolve quickly. We see modest upward pressure on the unemployment rate in the second half of 2025, but for now forward indicators including job ads are consistent with near-term stability.
RBA
NAB’s RBA view is that a deterioration in the global backdrop would see the RBA move more quickly, starting with a 50bp cut next week, to both offset downward pressure on the outlook for growth and inflation and to better position policy for a shifted balance of risks. NAB continues to assess the RBA needs to get to neutral, a policy rate in the low 3s, relatively quickly but the risk quite clearly sits with slower path of easing.
Domestic data flow has done little to change the calculus for the RBA. While the scale of the trade policy shock remains highly uncertain and is a moving target, it has receded somewhat with scaled back direct tariffs and with financial and confidence channels retreating as acute concerns relative to a few weeks ago.
Detail
Hours worked was unchanged after 2 consecutive monthly falls despite the strong (mostly full time) growth in employment and more than usual people working reduced hours due to ex-Tropical Cyclone Alfred and other major weather events in New South Wales and Queensland in the prior month. The underemployment rate rose a tenth to 6.0% in April.
Flows data continues to show that employment growth is supported by fewer employment exits, with flows from employment into unemployment and to out of the labour force lower than historical average. The job finding rate remains low relative to the low level of unemployment.
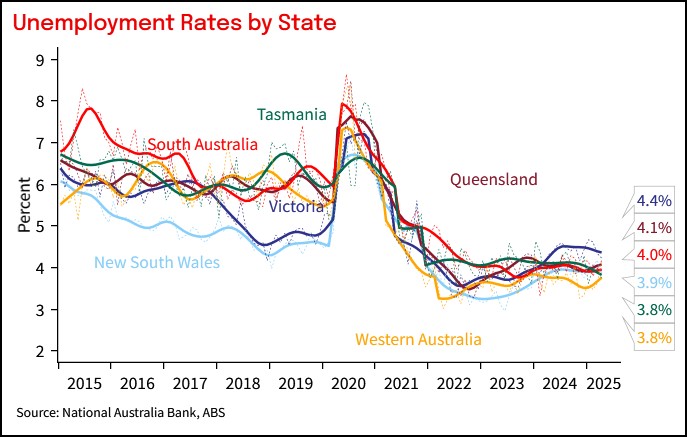
Indicators at the state level tend to be even more volatile month to month than the aggregate outcomes, but on a trend basis there has been some flattening out from the earlier more pronounced lift in the unemployment rate in Victoria. Trend unemployment at 4.4% remains elevated relative to other states and much nearer pre-pandemic levels.
Chart 1: Employment and unemployment
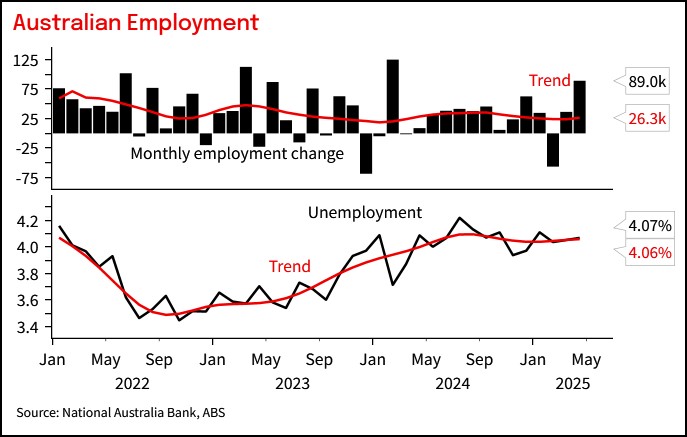
Chart 2: The unemployment rate was steady at 4.1% in April while the underemployment rate held at 6.0%.
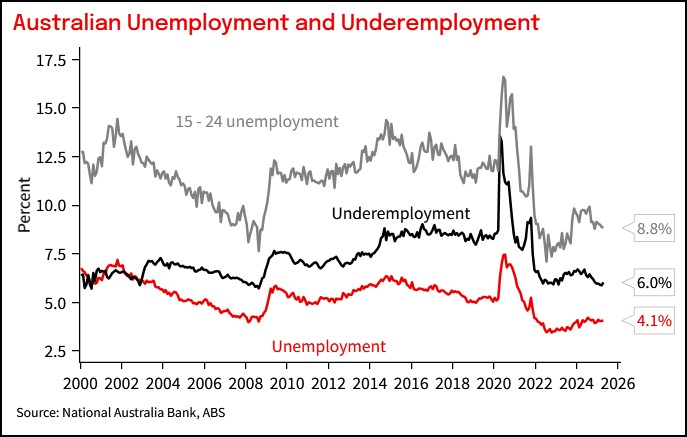
Chart 3: The RBA forecast 4.2% for Q2 unemployment back in February.
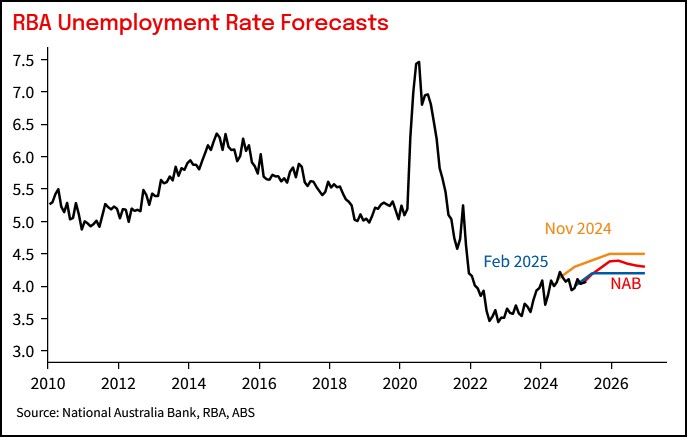
Chart 4: Measures of labour demand
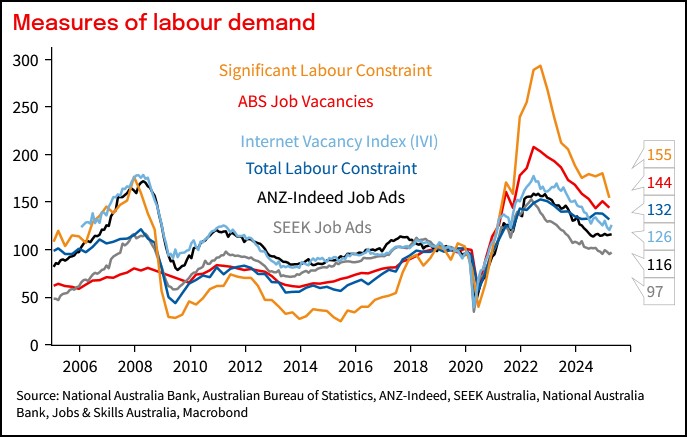
Chart 5: The job-finding rate has fallen back near long run average and is low relative to the unemployment rate
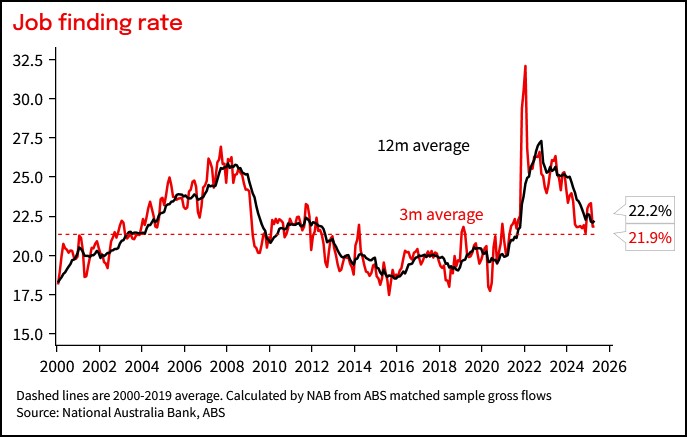
Chart 6: The participation rate and employment are being supported by lower-than-usual outflows, rather than elevated inflows.
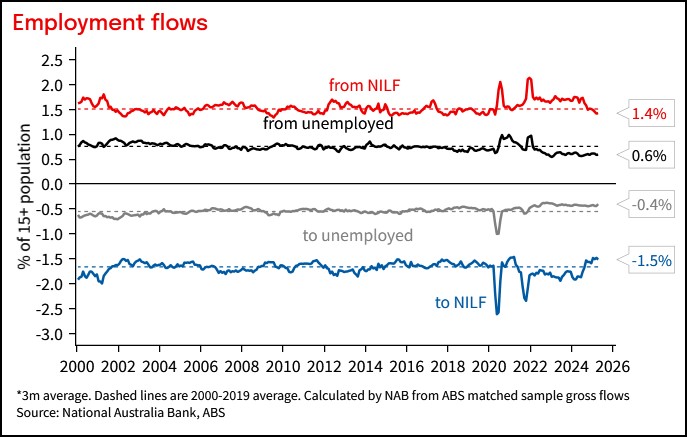
Chart 7: The participation rate rebounded from its February fall.
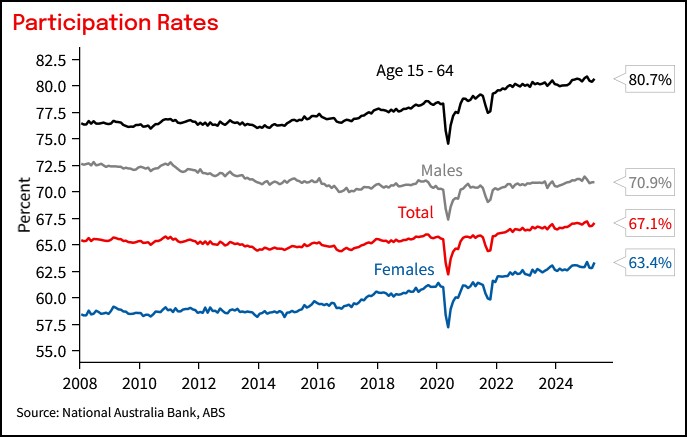
Chart 8: Employment as a share of the working age population was 64.4%
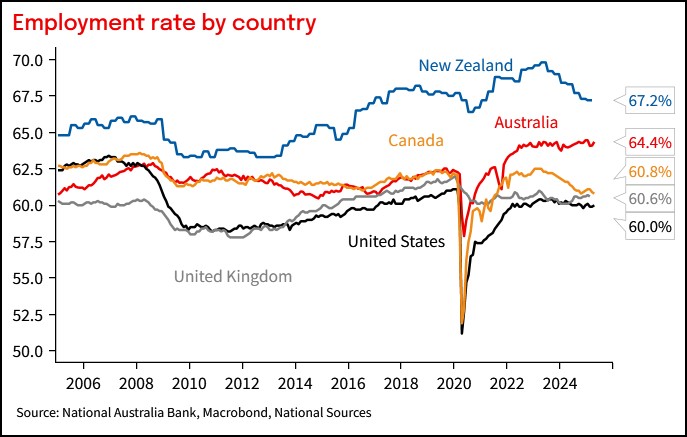
Chart 9: Unemployment rates by country

Chart 10: Trend unemployment by state
This document has been prepared by National Australia Bank Limited ABN 12 004 044 937 AFSL 230686 ("NAB"). Any advice contained in this document has been prepared without taking into account your objectives, financial situation or needs. Before acting on any advice in this document, NAB recommends that you consider whether the advice is appropriate for your circumstances. NAB recommends that you obtain and consider the relevant Product Disclosure Statement or other disclosure document, before making any decision about a product including whether to acquire or to continue to hold it. Please Click Here to view our disclaimer and terms of use. Please Click Here to view our NAB Financial Services Guide.
All prices and analysis at 15 May 2025. This information has been prepared by National Australia Bank Limited ABN 12 004 044 937 AFSL 230686 ("NAB"). The content is distributed by WealthHub Securities Limited (WSL) (ABN 83 089 718 249)(AFSL No. 230704). WSL is a Market Participant under the ASIC Market Integrity Rules and a wholly owned subsidiary of National Australia Bank Limited (ABN 12 004 044 937)(AFSL No. 230686) (NAB). NAB doesn’t guarantee its subsidiaries’ obligations or performance, or the products or services its subsidiaries offer. This material is intended to provide general advice only. It has been prepared without having regard to or taking into account any particular investor’s objectives, financial situation and/or needs. All investors should therefore consider the appropriateness of the advice, in light of their own objectives, financial situation and/or needs, before acting on the advice. Past performance is not a reliable indicator of future performance. Any comments, suggestions or views presented do not reflect the views of WSL and/or NAB. Subject to any terms implied by law and which cannot be excluded, neither WSL nor NAB shall be liable for any errors, omissions, defects or misrepresentations in the information or general advice including any third party sourced data (including by reasons of negligence, negligent misstatement or otherwise) or for any loss or damage (whether direct or indirect) suffered by persons who use or rely on the general advice or information. If any law prohibits the exclusion of such liability, WSL and NAB limit its liability to the re-supply of the information, provided that such limitation is permitted by law and is fair and reasonable. For more information, please click here.