Why investors need to be aware of the psychology of investing
Dr Shane Oliver | AMP
Until the 1980s the dominant theory was that financial markets were efficient – in other words all relevant information was rationally reflected in asset prices.
Faith in the so-called Efficient Market Hypothesis (EMH) began to unravel with the 1987 share market crash, as it was impossible to explain why US shares fell over 30% and Australian shares fell 50% in a two-month period when there was little in new information.
It’s also hard to explain the 80% slump in the tech heavy Nasdaq index between 2000 and 2002 on just fundamentals. Or the roughly 55% fall in shares in the GFC. Study after study has shown share volatility is too high to be explained by investment fundamentals alone. Something else is at play, and that is investor psychology.
Most investors are not rational
Numerous studies by psychologists have shown that (apart from me and you!) people are not always rational. In fact, they suffer from various lapses of logic, particularly when it comes to financial habits and behaviours. The most significant examples are as follows:
- Extrapolating the present – people tend to downplay uncertainty and assume recent trends, whether good or bad, will continue.
- Overweighting personal experience – people tend to give more weight to recent spectacular or personal experiences in assessing the probability of events. This drives an emotional involvement with an investment – if an investor has experienced a winning investment lately, he or she is likely to expect it will remain so.
- Overconfidence – people tend to be overconfident in their own investment abilities. Particularly men.
- Too slow to adjust – people tend to be overly conservative in adjusting their expectations to new information and do so slowly. This process of people “anchoring” their views partly explains why bubbles and crashes in shares normally unfold over long periods.
- Selective use of information – people tend to ignore information that conflicts with their views and favour information that confirms their views. This helps to perpetuate a bubble, or a surge in price beyond fundamentally justified levels.
- Wishful thinking – people tend to require less information to predict a desirable event than an undesirable one.
- Myopic loss aversion – people tend to dislike losing money more than they like gaining it. Various experiments have found that a potential gain must be twice the potential loss before an investor will consider accepting the risk. An aversion to any loss probably explains why shares traditionally provide a relatively high return (or risk premium) relative to “safer” assets like cash or bonds.
The madness of crowds
But individual irrationality tends to get magnified and reinforced by “crowd psychology”. Collective behaviour in investment markets requires the presence of several things:
- A means where behaviour can be contagious – Mass communication with the proliferation of social media is a perfect example of this. More than ever, investors are drawing their information from the same sources, which in turn results in an ever-increasing correlation of views, which reinforces trends.
- Pressure for conformity – Interaction with friends, monthly performance comparisons, industry standards and benchmarking, can result in “herding” amongst investors.
- A precipitating event or displacement – That gives rise to a general belief that motivates investors. The IT revolution of the late 1990s, the growth in China in the 2000s, cryptocurrencies and the rise of AI more recently are classic examples of this on the positive side. The demise of Lehman Brothers and problems with some cryptocurrencies, or even Trump’s worse than expected tariff announcements are examples of negative displacements.
- A general belief which grows and spreads – for example, that share prices can only go up. This helps reinforce the trend.
Bubbles and busts
The combination of lapses of logic by individuals in making investment decisions being magnified by crowd psychology go a long way to explaining why speculative surges in asset prices develop (usually after some good news) and how they feed on themselves (as individuals project recent price gains into the future, exercise “wishful thinking” and get positive feedback via the media, their friends and family).
Of course, the whole process goes into reverse once buying is exhausted, often triggered by news contrary to that which drove the rise initially. Investor psychology through a market cycle looks like what Russell Investments called the rollercoaster of investor emotion.
When times are good, investors move from optimism to excitement, and eventually euphoria as an investment’s price moves higher. So, by the time the market tops out investors as a group are maximum bullish and fully invested, often with no one left to buy. This sets the scene for a bit of bad news to push prices lower.
As selling intensifies and prices fall further, investor emotion goes from anxiety to desperation, and eventually depression. By the time the market bottoms out, investors are maximum bearish, and many are out of the market. This then sets the scene for the market to bottom as it only requires a bit of good (or less bad) news to bring back buying, and then the cycle repeats.
The rollercoaster of investor emotion through a market cycle
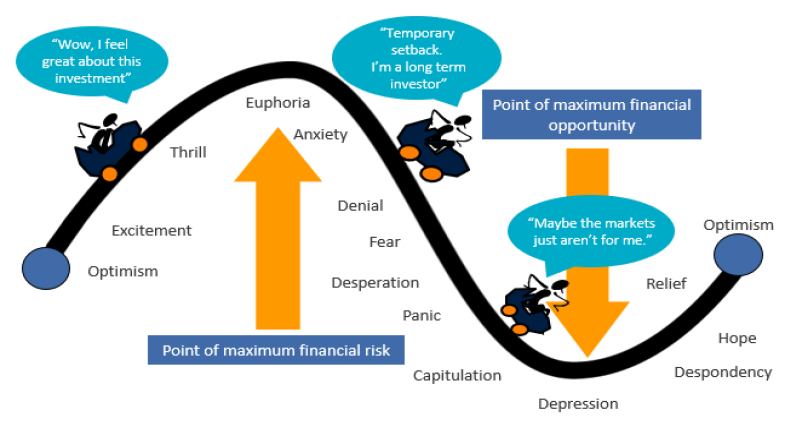 Source: Russell Investments, AMP
Things to be aware of
Firstly, confidence and investor psychology do not act in a vacuum. The move from depression at the bottom of a cycle to euphoria at the top is usually underpinned by fundamental developments, e.g. strong economic growth, easy money or an innovation from the bottom, or an economic downturn and negative government policy from the top. Investor psychology just magnifies it.
Second, at market extremes confidence is best read in a contrarian fashion – major bull markets do not start when investors are feeling euphoric and major bear markets do not start when they are depressed. Extreme low points in confidence are often associated with market bottoms, and vice versa for extreme highs.
Third, ideally one needs to look at what investors are thinking (sentiment) and what they are actually doing (positioning).
Finally, negative crowd sentiment can tend to be associated fairly quickly with market bottoms reflecting the steep declines associated with panics as a market falls. But during bull markets positive sentiment or even euphoria can tend to persist for a while as it takes investors longer to build exposures to assets than to sell them.
Where are we now in relation to shares?
The next chart shows the US share market and a measure of US investor sentiment that includes surveys of investment newsletter writers and individual investors and the ratio of puts (options to sell shares) to calls (options to buy).
It shows that extreme levels of pessimism tend to be associated with major market bottoms (green arrows) and extreme measures of optimism tend to be associated with tops (red arrows), although sentiment can be less reliable at tops.
The plunge in shares into Trump’s 2nd April tariff announcements saw investor sentiment collapse from moderate optimism to extreme pessimism. This in turn partly explains the sharp bounce in shares since the lows as Trump softened his position on the tariffs. Sentiment towards shares had turned so bad that it only took a slight improvement in Trump’s tariff comments to trigger a strong rise in shares.
Right now, investor sentiment is still wary but is becoming less negative as shares have bounced. This is not to say that we have necessarily seen the bottom as shares could still fall further if the news on tariffs worsens anew (e.g. if China and the US remain in a stand-off or US trade talks with other countries fail), but cautious investor sentiment is a positive sign for shares on a medium-term view.
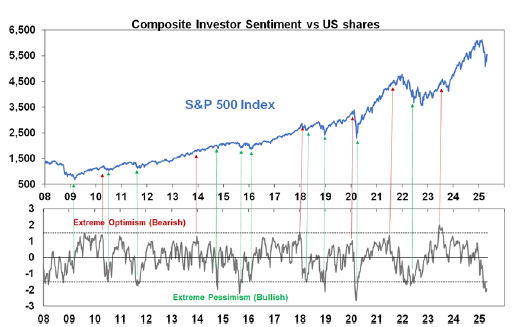
Source: Bloomberg, AMP
In Australia, the proportion of those surveyed by the Westpac/Melbourne Institute consumer who regard shares as the wisest place for saving remains relatively low suggesting there is no extreme optimism towards shares in Australia.
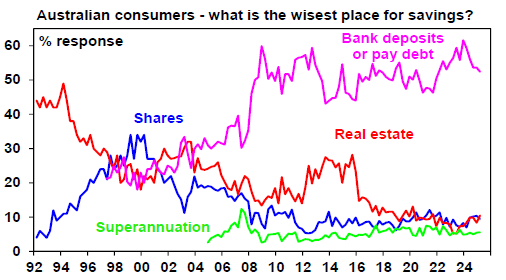
Source: Westpac/Melbourne Institute, AMP
What does this mean for investors?
There are several implications for investors:
- First, recognise that investment markets are not only driven by fundamentals, but also by the often irrational and erratic behaviour of an unstable crowd of investors that can magnify the impact of fundamental developments, both up and down. The key is to be aware of past market booms and busts, so that when they arise you understand them and do not overreact by buying at the top and selling at the bottom.
- Second, try and be aware of how you are influenced by lapses in your own logic and crowd influences. For example, you could ask yourself: “Am I highly affected by recent developments? Am I too confident in my expectations? Can I bear a paper loss?”
- Thirdly, to guard against emotional responses choose an investment strategy which can withstand inevitable crises whilst remaining consistent with your financial objectives and risk tolerance. Then stick to this.
- Fourthly, if you are tempted to trade, do so on a contrarian basis. Buy when the crowd is bearish, sell when it is bullish. Extremes of bullishness often signal eventual market tops, and extremes of bearishness often signal bottoms. But also recognise contrarian investing is not fool-proof – just because the crowd looks irrationally bullish (or bearish) doesn’t mean it can’t get more so.
These points are important in times of uncertainty, like now with Trump’s tariffs on the downside but the positives of technological innovation flowing from artificial intelligence on the upside.
Learn how the industry leaders are navigating today's market every morning at 6am. Access Livewire Markets Today.
All prices and analysis at 29 April 2025. This document was originally published in Livewire on 29 April 2025. This information has been provided by AWM Services Pty Ltd (ABN 15 139 353 496)(AFSL No. 366121), part of the AMP Group. The content is distributed by WealthHub Securities Limited (WSL) (ABN 83 089 718 249)(AFSL No. 230704). WSL is a Market Participant under the ASIC Market Integrity Rules and a wholly owned subsidiary of National Australia Bank Limited (ABN 12 004 044 937)(AFSL No. 230686) (NAB). NAB doesn’t guarantee its subsidiaries’ obligations or performance, or the products or services its subsidiaries offer. This material is intended to provide general advice only. It has been prepared without having regard to or taking into account any particular investor’s objectives, financial situation and/or needs. All investors should therefore consider the appropriateness of the advice, in light of their own objectives, financial situation and/or needs, before acting on the advice. Past performance is not a reliable indicator of future performance. Any comments, suggestions or views presented do not reflect the views of WSL and/or NAB. Subject to any terms implied by law and which cannot be excluded, neither WSL nor NAB shall be liable for any errors, omissions, defects or misrepresentations in the information or general advice including any third party sourced data (including by reasons of negligence, negligent misstatement or otherwise) or for any loss or damage (whether direct or indirect) suffered by persons who use or rely on the general advice or information. If any law prohibits the exclusion of such liability, WSL and NAB limit its liability to the re-supply of the information, provided that such limitation is permitted by law and is fair and reasonable. For more information, please click here.