The ASX 200 is getting smashed - but is now the big opportunity you’ve been waiting for?
Carl Capolingua | Livewire Markets
Investors who have been patiently waiting for a pull back in the Australian stock market finally have their opportunity to buy. Don’t they?
Well, we have corrected – of that there can be no question! Since the 14 February peak of 8616, the S&P/ASX 200 has lost 680 points or about 7.9% of its value based on yesterday’s closing price of 7934. It was as bad as 883 points and 10.2% down at the lowest point of this correction, 7733, set on 12 March.
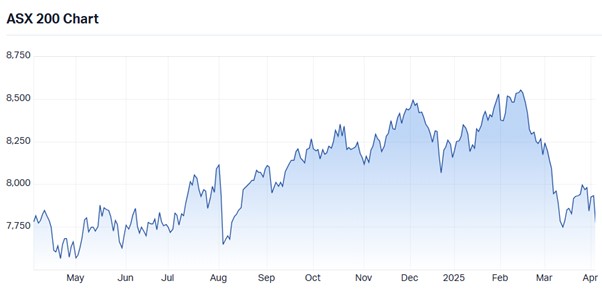
S&P/ASX 200 Index chart | Source: Livewire Markets
“Correction” – what does that term even mean? If Aussie stocks have just had a “correction”, does this mean they were “incorrect” before? As in, they shouldn’t have been as high as they were in the first place?
Maybe, and we’ll expand on that topic soon, but for now, let’s clarify that a correction relating to the stock market is defined as a 10% or greater decline from a market peak. It’s not to be confused with a bear market, which is defined as a 20% or greater decline from a market peak.
Let’s investigate whether investors are right to jump in now and take advantage of the current correction in terms of fundamental valuations, as well as where the Australian stock market sits in terms of whether this correction could transform into a rampaging bear market.
Buy, or wait for a better entry point? Let’s dive in!
ASX corrections and bear markets since 1980
Let’s do some research into corrections versus bear markets on the Australian stock market. I want to go way back, to 1980, so I’m going to use the All Ordinaries instead of the current benchmark ASX 200 as that index only began in 2000. (The All Ordinaries preceded the ASX 200 as the main benchmark, and therefore we have more data for it.)
There have been 17 corrections (including this one) and 12 bear markets since 1980 – so that’s one major market downturn approximately every 18 months on average. The last one occurred in 2023 – so the timing of the current downturn is about spot on.
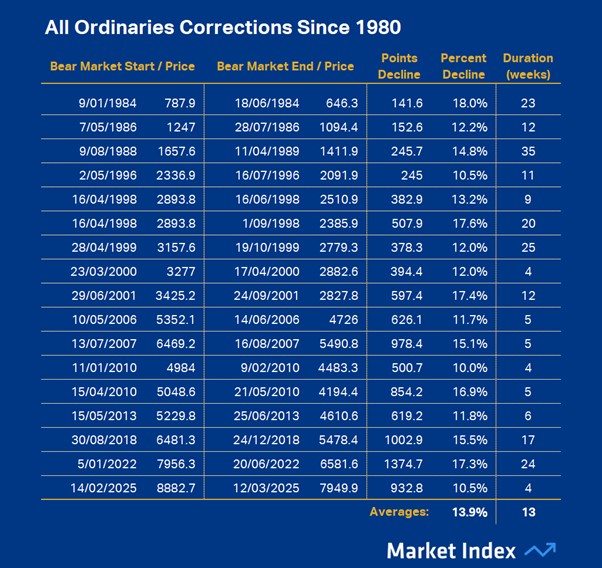
All Ordinaries Corrections Since 1980
As far as corrections go, 10% can be just the start of it, though. The average All Ordinaries correction since 1980 lasted approximately 13 weeks and sliced around 14% off the Aussie stock prices. Corrections greater than 15% were not uncommon, however, and whilst 7 of the 17 lasted less than a couple of months, there were nearly as many corrections that lasted for the better part of 6 months. It’s worth noting that the current correction deserves an asterisk because of its ongoing nature…ba-ba-baaammm 🚨!
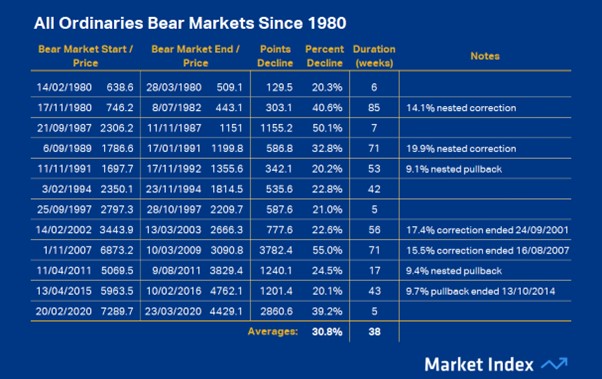
All Ordinaries Bear Markets Since 1980
Ok, bear markets now, and this is where things get really ugly! 12 in 45 years, that’s one every 3 years and 9 months. That feels way more common than it should – but that’s the thing about bear markets (and corrections) – they can occur at any time!
It was usually a combination of different stock price crushing factors that caused the last 12 bear markets – from recession, to political upheaval, to credit crunches, and to pandemics. This time it might even be a global trade war…(Cue the ba-ba-baaammm again 🚨!)
Yes, you never quite know when a bear market is about to pop up. Like 1987’s “Black Monday” induced 50% in 7 weeks – at least that was short and sharp – or 2007’s “Big Short” in which Aussie stocks lost a devastating 55% over 71 weeks during the worst global economic slowdown since the Great Depression.
The average bear market, however, saw 30.8% wiped off the All Ordinaries with an average duration of 38 weeks (approx. 9 months). But, within the averages, there are some interesting bear market notes to observe that may help provide context for the current market gyrations.
Corrections and near-correction pullbacks preceding bear markets are common. The 2002 and 2007 bear markets occurred within 6 months of corrections, and the 2015 bear market occurred within 6 months of a 9.7% pullback.
Then there are what I call “nested” corrections and nested near-correction pullbacks that occur during the early stages of a bear market. This means that the market corrected, rallied back up by at least as much from the correction low, and then plunged into a broader bear market. These whipsaw actions occurred before or at the start of more than half of the bear markets in the sample.
This suggests that corrections are not to be trifled with. They are often a harbinger of something more sinister potentially bubbling up under the surface of the macroeconomic backdrop. It also potentially suggests that many investors discounted the prevailing issues at first, because perhaps they were too focused on all the money they were making in the prior bull market – but then those issues suddenly became too dangerous to ignore (Cue the ba-ba-baaammm again 🚨!).
If this correction turns out to be the start of the next bear market, then there’s still a long way to go (10%-ish so far vs 30%-ish on average, and 7 weeks so far vs 38 weeks on average). So, as far as the question of “Is it time to buy the current dip?” is concerned, there may be no harm in waiting for more clarity on how President Trump’s trade war is going to impact the global economy – and therefore by extension – local stock prices.
Are ASX stocks cheap yet?
Perhaps the most commonly used yardstick of stock market valuation is the market P/E Ratio. “PE” stands for price to earnings. It’s a simple formula that divides the earnings expected from an asset over the next 12 months into its current price: P/E.
In short, the P/E implies that a higher E vs P results in a lower P/E Ratio. This is a good thing, because it means it costs less to buy one dollar’s worth of the asset’s earnings. Less to buy anything implies cheaper. Conversely, a lower E vs P results in a higher P/E Ratio, and we typically say this means the asset is more expensive.
So, are Aussie stocks cheap or expensive? That all depends on what you call cheap or expensive. The old rule of thumb as far as P/E Ratios go is:
- >20 = Expensive (many major market tops occurred when the market P/E Ratio rose above 20)
- ~15 = Fair value
- <10 = Cheap (many major market lows occurred when the market P/E Ratio fell below 10)
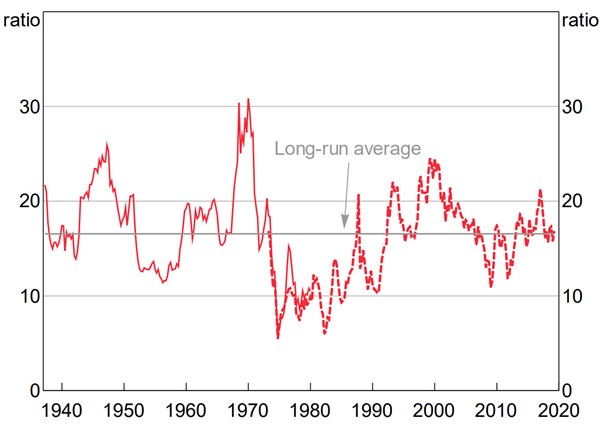
ASX 100 Price-to-earnings Ratio 12-month trailing earnings. Source: “Research Discussion Paper, A History of Australian Equities”, Thomas Mathews. Published by the Reserve Bank of Australia, April 2019.
My favourite way to get an idea of whether the Australian stock market is currently cheap or expensive is to look at major broker Macquarie’s “Market PER”. It’s a forward-looking P/E Ratio for a basket of Australian stocks representing the largest ASX-listed companies accounting for the bulk of the ASX’s market capitalisation.
Earlier this week, Macquarie noted its Market PER for the current financial half-year ending June 30 was 17.9x, and for the next financial half-year ending December 31 it was 17.0x. So, just using the old rule of thumb, even after their recent correction, Aussie stocks still appear to be on the wrong side of fair value – albeit modestly when considering next half-year’s Market PER of 17.0x.
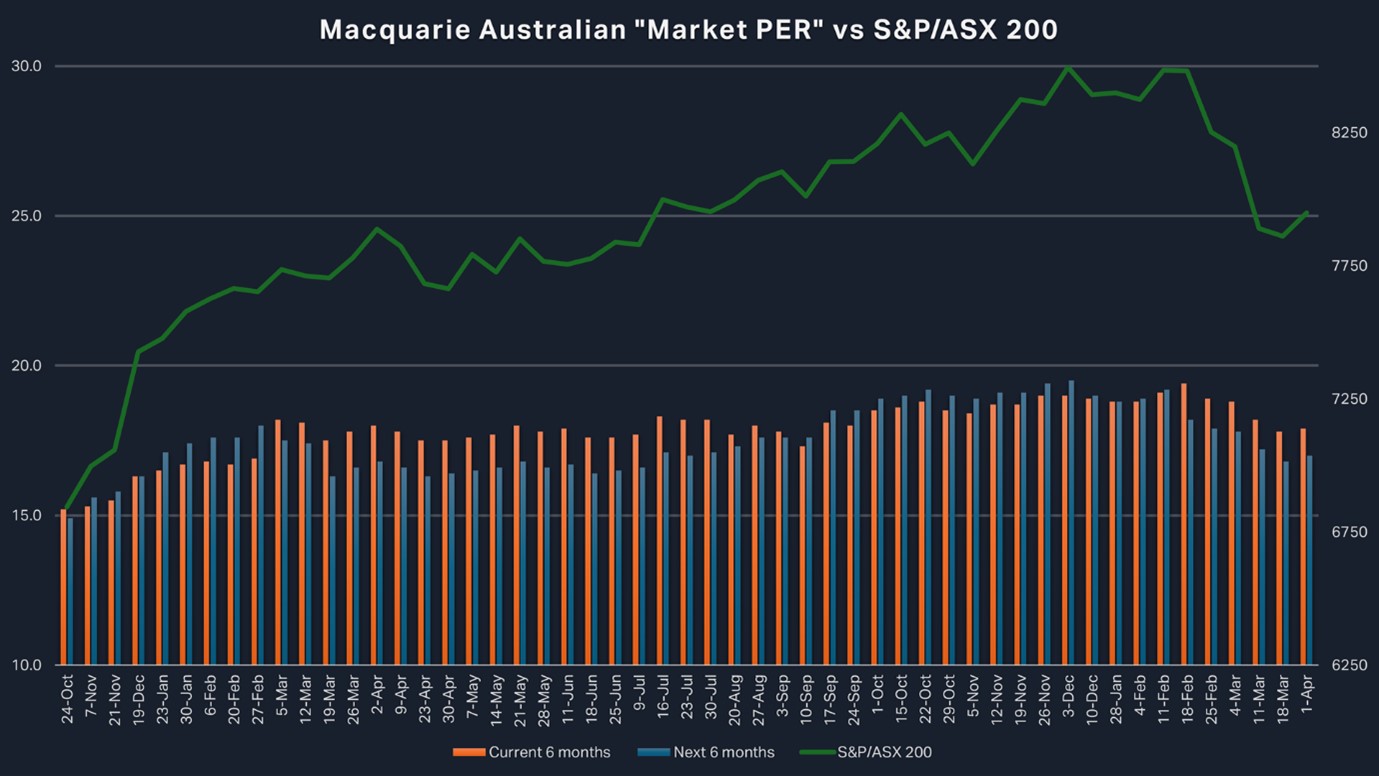 Macquarie Australian "Market PER" vs S&P/ASX 200
According to Macquarie’s Market PER, valuations on a next-6-month basis have improved by around 12.8% compared to the metric’s peak of 19.5x set in early December. So that, at least, is some good news for those looking for a value-based entry here – but arguably there is still a long way to go until Aussie stocks could be considered “cheap”.
Do the charts say it’s time to buy ASX stocks?
If you wait for a bargain – it may never come! So let’s turn our attention to the technicals – the charts.
If you follow along with my ChartWatch write ups in each edition of our Evening Wraps, then the current state of the ASX 200 would be no surprise to you at all. More than likely, you would have observed, as I did in ChartWatch, the key technical signals that indicated many weeks ago the short term uptrend in Australian stocks, and then the long term uptrend, was changing.
I will be brief here, but you may wish to check out my ChartWatch Primer for more details on how my technical model works. The first indication that something was “off” with the ASX 200 came on 20 February when a series of supply-side candles (i.e., black-bodied and or upward pointing shadows) caused the its price to close below the short term trend ribbon (light green).
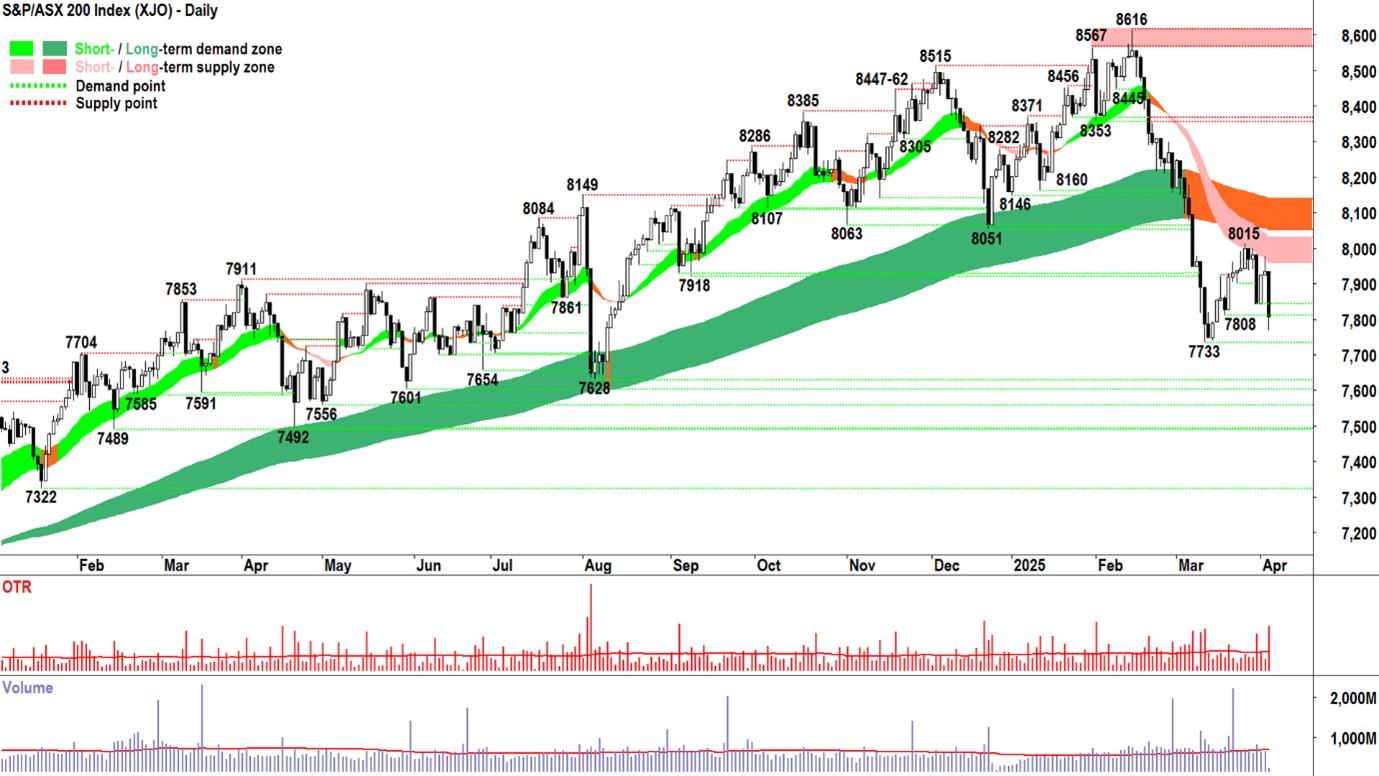 S&P-ASX 200 (XJO) chart | Source: Livewire Markets
That short term trend ribbon subsequently neutralised (amber), and then turned down (light pink), and soon, the ASX 200 repeated the same process at the long term trend ribbon (dark green to amber). This is a strong indication the supply-side of the market was growing in prominence and control.
At the same time, the price action switched from rising peaks and rising troughs (i.e., supply removal and demand reinforcement) to falling peaks and falling troughs (i.e., supply reinforcement and demand removal). The candles have remained predominantly supply-side in nature since.
At various points along this transitional journey – from demand side control prior to the 8616 peak on Valentine’s Day, to the current failure to reclaim the long term trend ribbon – I have noted my preference to move step-by-step to what I call my most conservative risk level – a maximum of two-thirds cash.
As for what happens next in the chart – I haven’t the foggiest! This is because I am a trend follower, not a trend prognosticator. Nobody can tell the future – not even the great Warren Buffett! So I don’t make predictions.
Simply, I just follow the trends I can see. More specifically, I look to manage my risk in accordance with how the smart money is controlling prices. If my analysis suggests they are creating an environment of excess supply – as is the case right now – I prefer to operate at maximum conservatism levels, but to also actively seek out a few strategic short selling opportunities.
I will not increase my risk settings until I see the smart money is again creating an environment of excess demand. Signs of this would be a return to:
- Prices above the trend ribbons and the trend ribbons rising, the trend ribbons are supporting the price on pullbacks
- Rising peaks and rising troughs
- A predominance of demand-side candles (i.e., white-bodied and or downward pointing shadows)
Conclusion
When you think about it, together, corrections and bear markets are a rather common occurrence – hitting markets by orders of magnitude every 18 months. So, if you don’t yet have a strategy for dealing with these disruptions, then you probably should.
Sure, the market is substantially higher today than it was 45 years ago, and one could argue one could just ride it out…don’t worry…it will go back up again…
But getting corrections and bear markets wrong or right can make a big difference. Let’s assume you were able to reduce the impact of corrections and bear markets by just half since just the year 2000 – you would have ended up over 300% ahead.
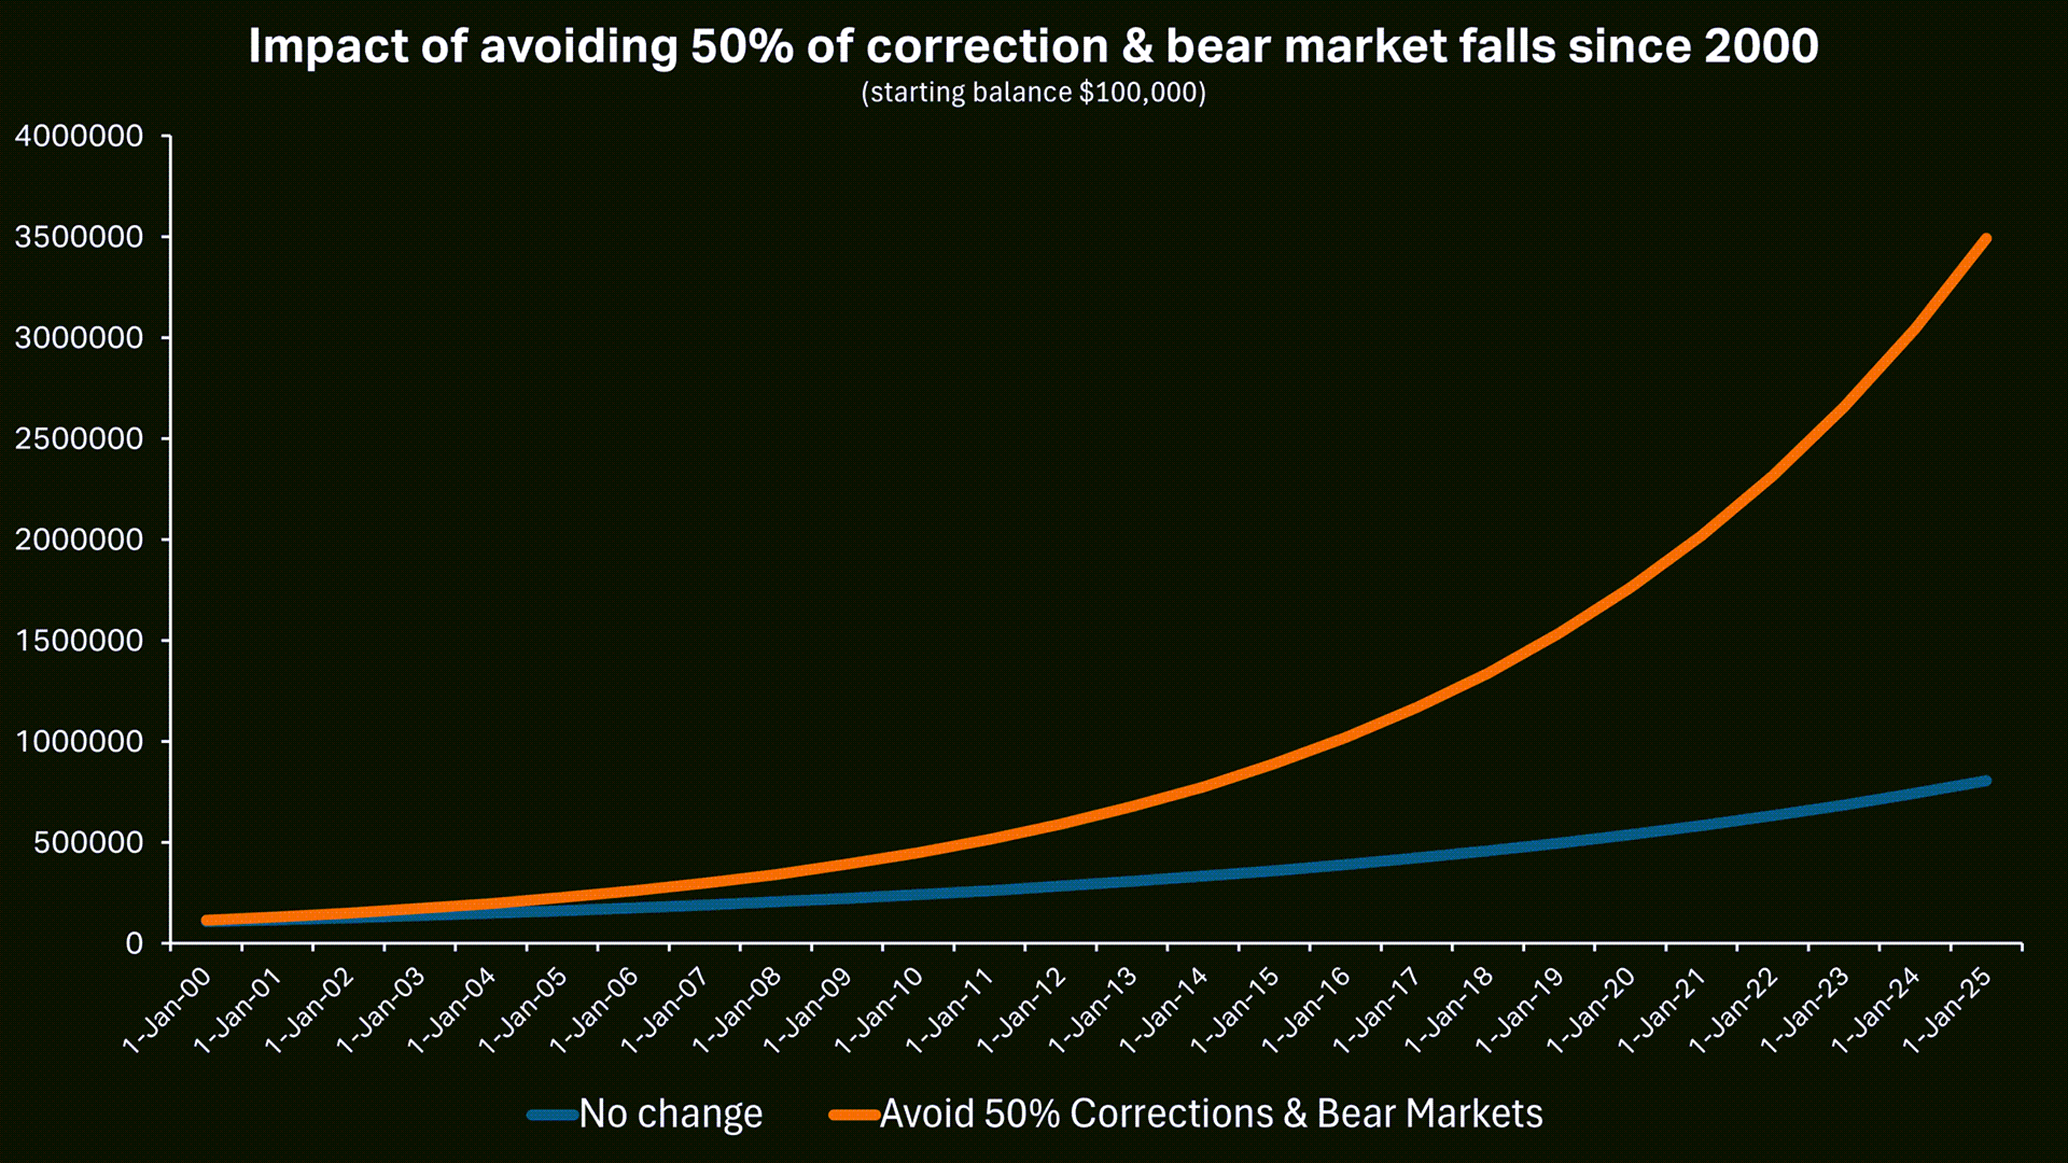 What if you were able to reduce the impact of corrections and bear markets by just half? | Source: Livewire Markets
There’s clearly plenty at stake when it comes to navigating major market downturns, particularly should this correction turn into another bear market. One could argue that there are just as many contributing uncertainties this time compared to previous market calamities.
As the saying goes, to be forewarned is to be forearmed. You just got warned. What are you going to do about it? Hopefully this article serves as a great starting point!
Learn how the industry leaders are navigating today's market every morning at 6am. Access Livewire Markets Today
All prices and analysis at 3 April 2025. This document was originally prepared and published by Livewire Markets Pty Ltd ACN 156 343 501 on 3 April 2025 and Livewire is solely responsible for its issue.The content is distributed by WealthHub Securities Limited (WSL) (ABN 83 089 718 249)(AFSL No. 230704). WSL is a Market Participant under the ASIC Market Integrity Rules and a wholly owned subsidiary of National Australia Bank Limited (ABN 12 004 044 937)(AFSL No. 230686) (NAB). NAB doesn’t guarantee its subsidiaries’ obligations or performance, or the products or services its subsidiaries offer. This material is intended to provide general advice only. It has been prepared without having regard to or taking into account any particular investor’s objectives, financial situation and/or needs. All investors should therefore consider the appropriateness of the advice, in light of their own objectives, financial situation and/or needs, before acting on the advice. Past performance is not a reliable indicator of future performance. Any comments, suggestions or views presented do not reflect the views of WSL and/or NAB. Subject to any terms implied by law and which cannot be excluded, neither WSL nor NAB shall be liable for any errors, omissions, defects or misrepresentations in the information or general advice including any third party sourced data (including by reasons of negligence, negligent misstatement or otherwise) or for any loss or damage (whether direct or indirect) suffered by persons who use or rely on the general advice or information. If any law prohibits the exclusion of such liability, WSL and NAB limit its liability to the re-supply of the information, provided that such limitation is permitted by law and is fair and reasonable. For more information, please click here.