Q1 trimmed mean a tenth above consensus but in line with RBA forecast
Taylor Nugent | Markets Research
Key points:
- Trimmed mean was 0.7% q/q and 2.9% y/y (NAB and Consensus 0.6%, RBA February SoMP 0.7%)
- We warned of upside risk to our 0.6% forecast and strength in administered prices in our preview and that was realised. The surprise came from strength in health inflation
- Headline was 0.9% q/q (NAB and consensus 0.8% q/q) as electricity rebounded after depressing the prior 2 prints.
Bottom Line
Trimmed mean inflation was 0.7% q/q (0.68% unrounded). A tenth above our and consensus forecasts but in line with the RBA. There is ongoing disinflation across the breadth of market services categories and housing components have cooled from their mid 2024 pace. That remains encouraging as the RBA’s assessment of domestic inflation pressures evolves.
Residual strength in today’s data is most evident in administered services prices. We had pencilled in elevated health inflation in the March quarter, but it was stronger than we forecast, and accounts for essentially all of the modest upside surprise. Administered services (including health) tend to be less responsive and slower to adjust to broader cost and inflation pressures in the economy.
Q4’s 0.5% q/q outcome was flattered by the increase in rent assistance, and we do not see today’s number as evidence of reacceleration in the inflation backdrop. Core inflation has annualised in the 2-3% target band for two successive quarters.
Implications
NAB’s view is that the RBA has been overly cautious on its outlook for inflation and data flow would support ongoing revision of its lingering concern that the labour market and demand backdrop remain overly inflationary. While today’s outcome is in line with the RBA’s forecast, it is only a modest upside surprise to our own projection and doesn’t dissuade us of that broader assessment given the detail remains consistent with the view that inflation will not get stuck above target on a forward-looking basis. The ongoing decline in services inflation should add to the Bank’s confidence that the “stickier” components of inflation are moderating towards target-consistent growth rates.
We also assess that a slower global growth environment as a result of substantially higher US tariff barriers, especially on China, and exceptionally elevated policy uncertainty are a headwind to domestic growth and net disinflationary in Australia. On top of cooler demand, incentives to reroute capacity previously directed to US purchasers will put some downward pressure on local prices. That argues for a forward-looking RBA to move quickly to neutral policy settings. NAB expects the RBA to move policy rates over the next 3 meetings to 3.1%, having pencilled in a 50bp move in May. We ultimately expect policy will move to modestly accommodative settings around 2.6% in 2026 before normalising back to 3.1% longer term.
Detail
- Overall, our heatmap in Table 1 shows that relative to last time inflation sustained at target, inflation remains elevated through grocery and alcohol prices, as well as administered prices. Higher electricity and fuel prices were a support for headline inflation. Goods prices were generally benign and were essentially flat in the quarter, but that is still a little stronger than prevailed during the post GFC experience.
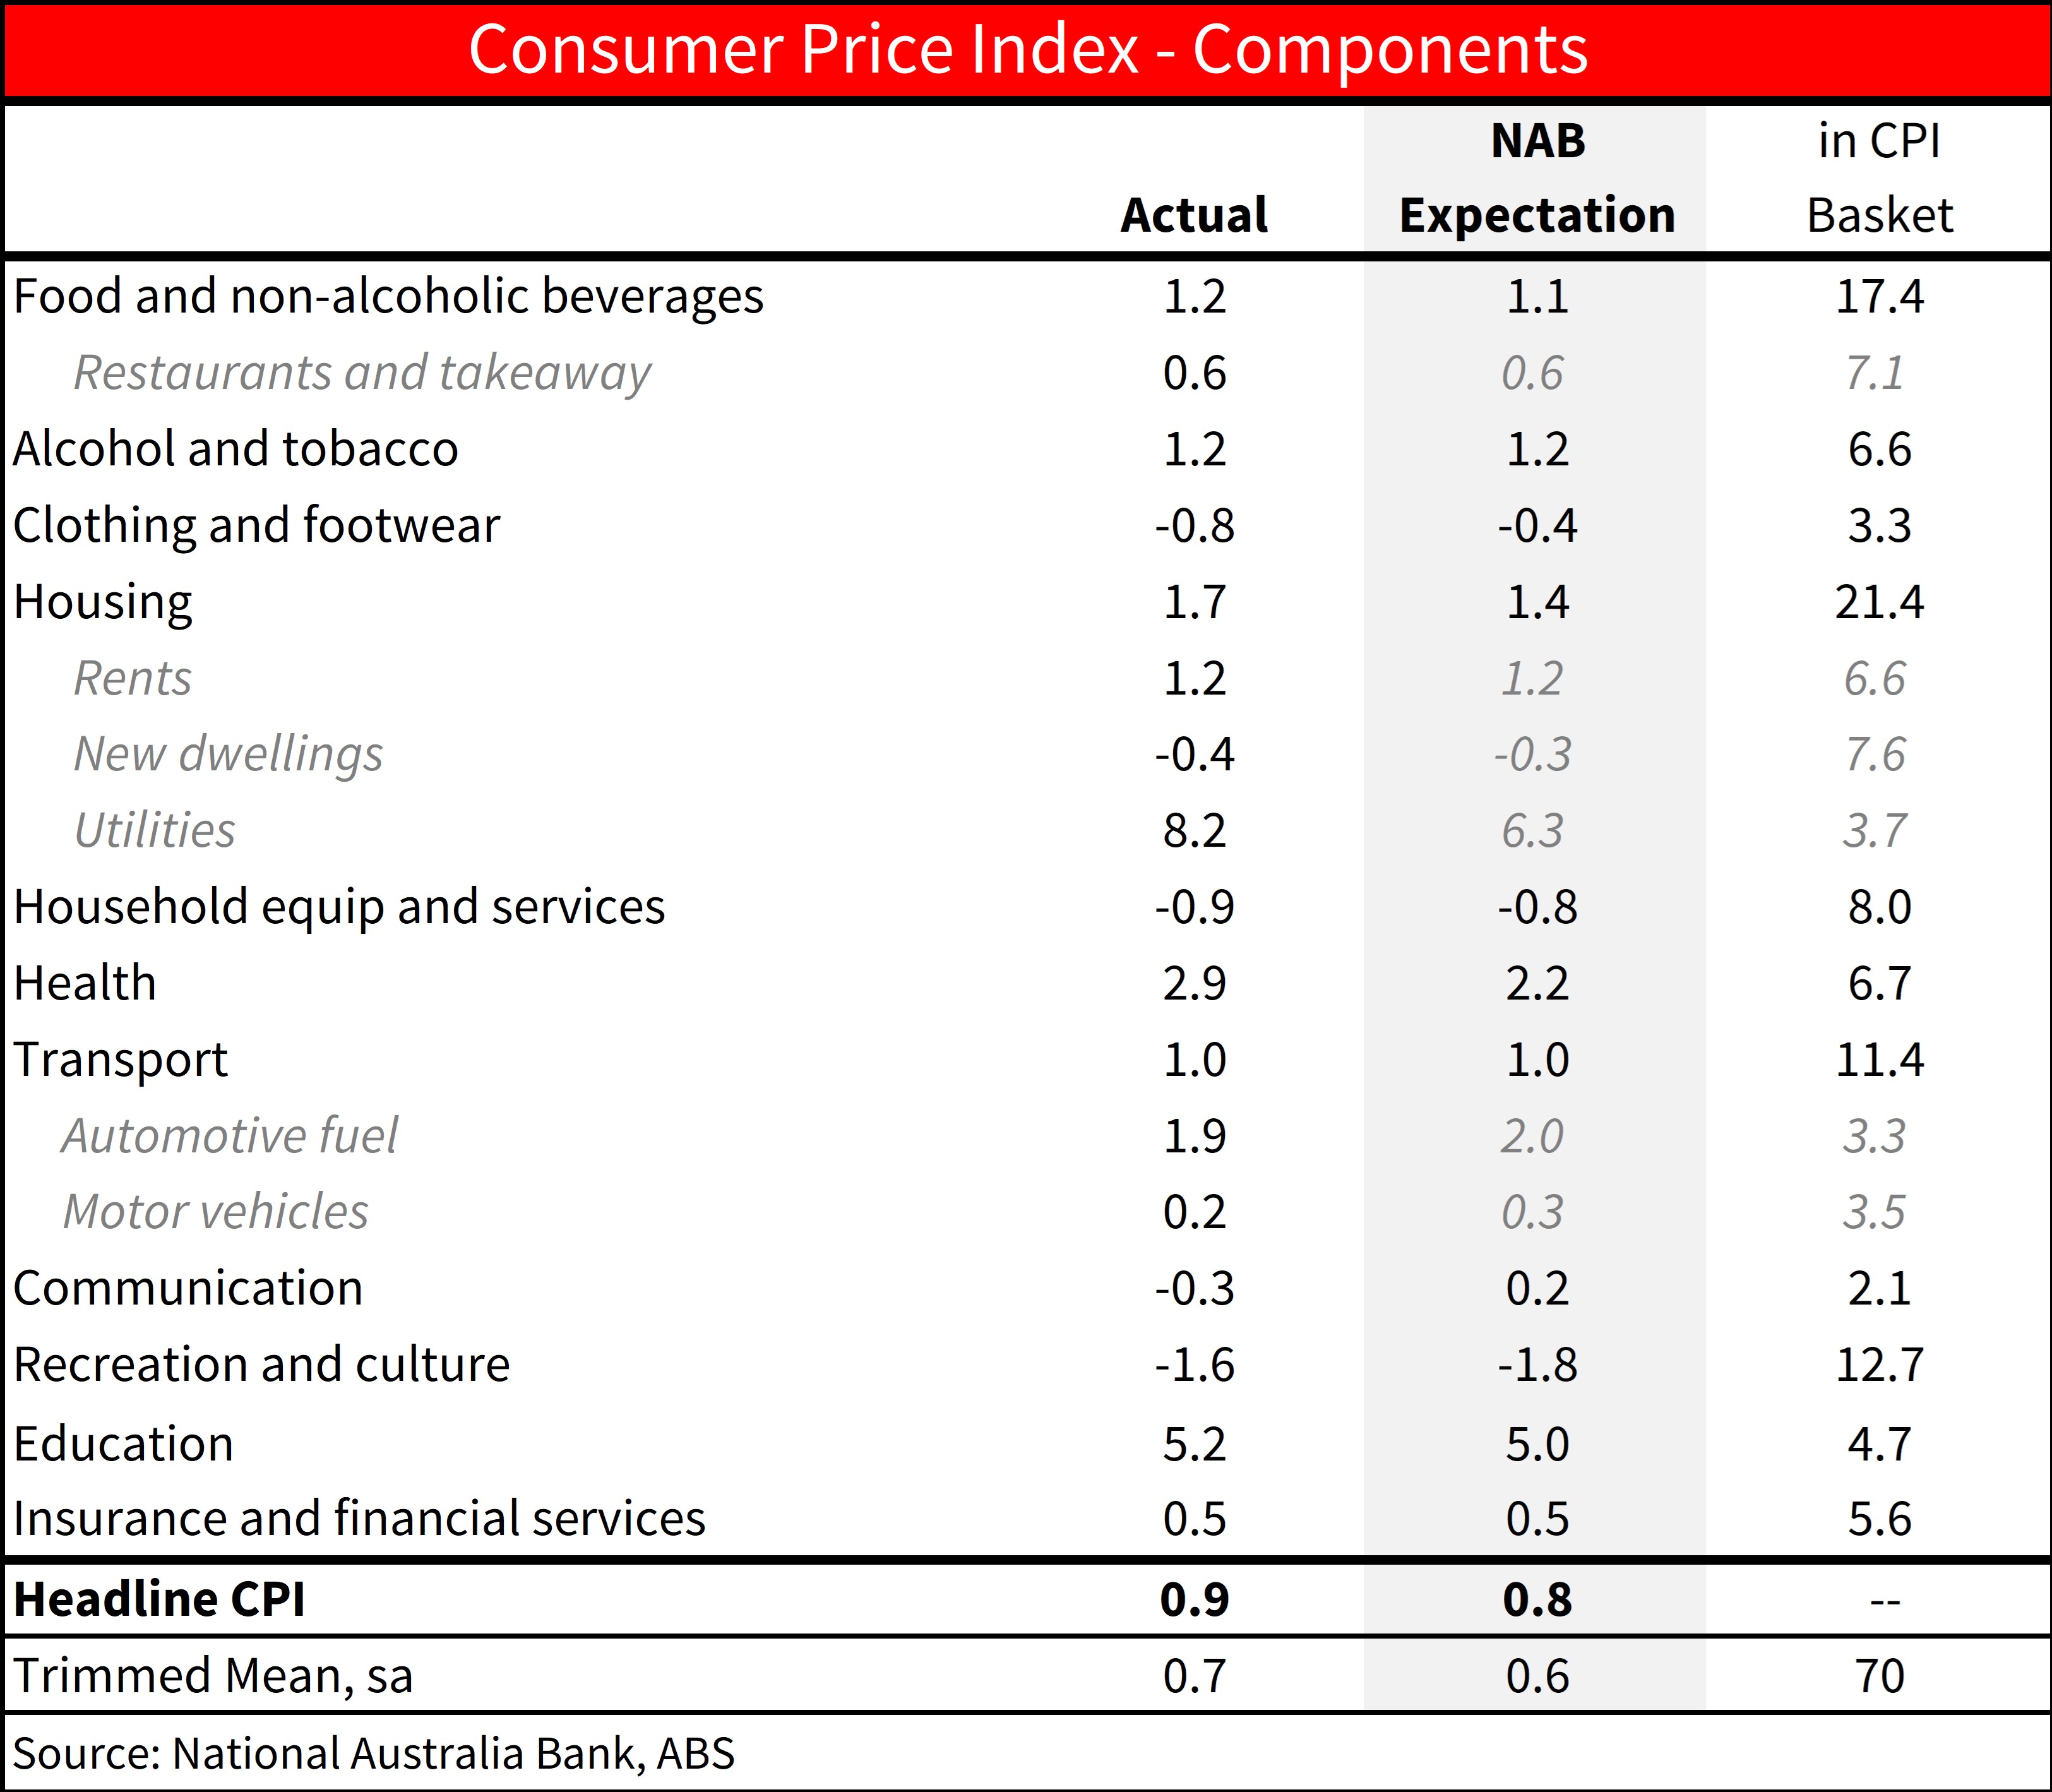
- New Dwelling construction costs and Rents are the two largest components of the CPI. New dwelling prices fell modestly in Q1 (-0.4%, NAB -0.3%). Cost push drivers of inflation through residential construction have slowed markedly even as prices have generally not fallen back, and the ABS notes increasing incentives and promotional offers to attract new customers, particularly in Sydney, Melbourne and Canberra as supporting the modest price declines.
- Rents inflation was 1.2% q/q (NAB 1.2%) and returned to 0.3% m/m in March after a surprise 0.5% m/m outcome in February. That consistent with the signal from more modest growth in advertised rents and we expect more modest rents inflation to sustain looking forward.
- Overall services inflation slowed to 3.7% y/y from 4.3% y/y, its slowest since Q2 2023 even as inflation through education and health remains elevated. Health prices tend to rise in Q1 as a result of the cyclical reduction in the proportion of consumers who qualify for subsidies under the Medicare Safety Net and Pharmaceutical Benefits Scheme (PBS). A freeze to indexation for PBS copayments limited the rise to pharmaceutical product prices as expected, but medical and hospital services price rises were larger than expected.
- Looking at a subset of services closely watched by the RBA as in indicator of domestic demand pressure, market services inflation excluding travel and telco was 0.8% q/q (NAB 0.8%). Further excluding rents shows market services inflation at 0.7% q/q, the slowest since Q2 2021 and no longer elevated relative to history. This category includes items sensitive to domestic cost and demand pressures like hairdressing and personal services, restaurant meal, cultural and sporting activities and financial services.
- Market goods prices outside of food, tobacco and new dwellings remain benign at 0.0% q/q (NAB 0.0%) and 0.1% y/y. We expect more balance demand conditions and the increase in US tariffs and trade policy uncertainty to, on net, put some further downward pressure on trade exposed consumer goods prices looking forward.
Chart 1: Headline and Trimmed Mean Inflation
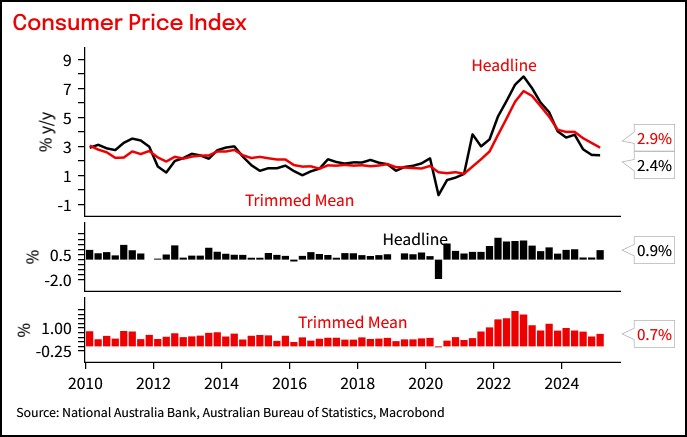
Chart 2: Contributions to CPI inflation
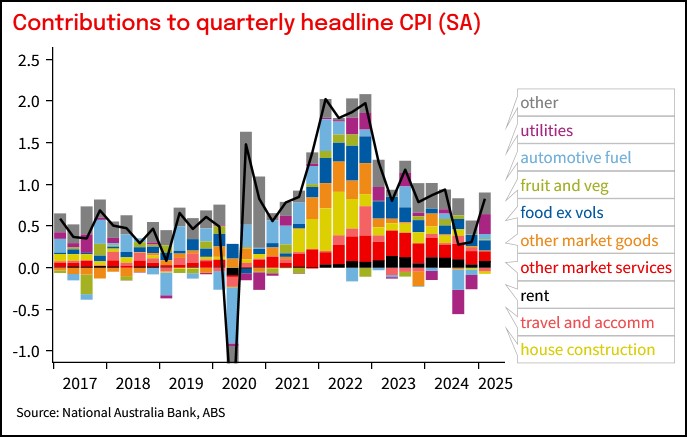
Table 1: CPI heat map. Shows 3-, 6- and 12m annualised outcomes. Shading reflects how far inflation is above or below a benchmark of the 6 years to 2015 when inflation averaged around the mid-point of the target
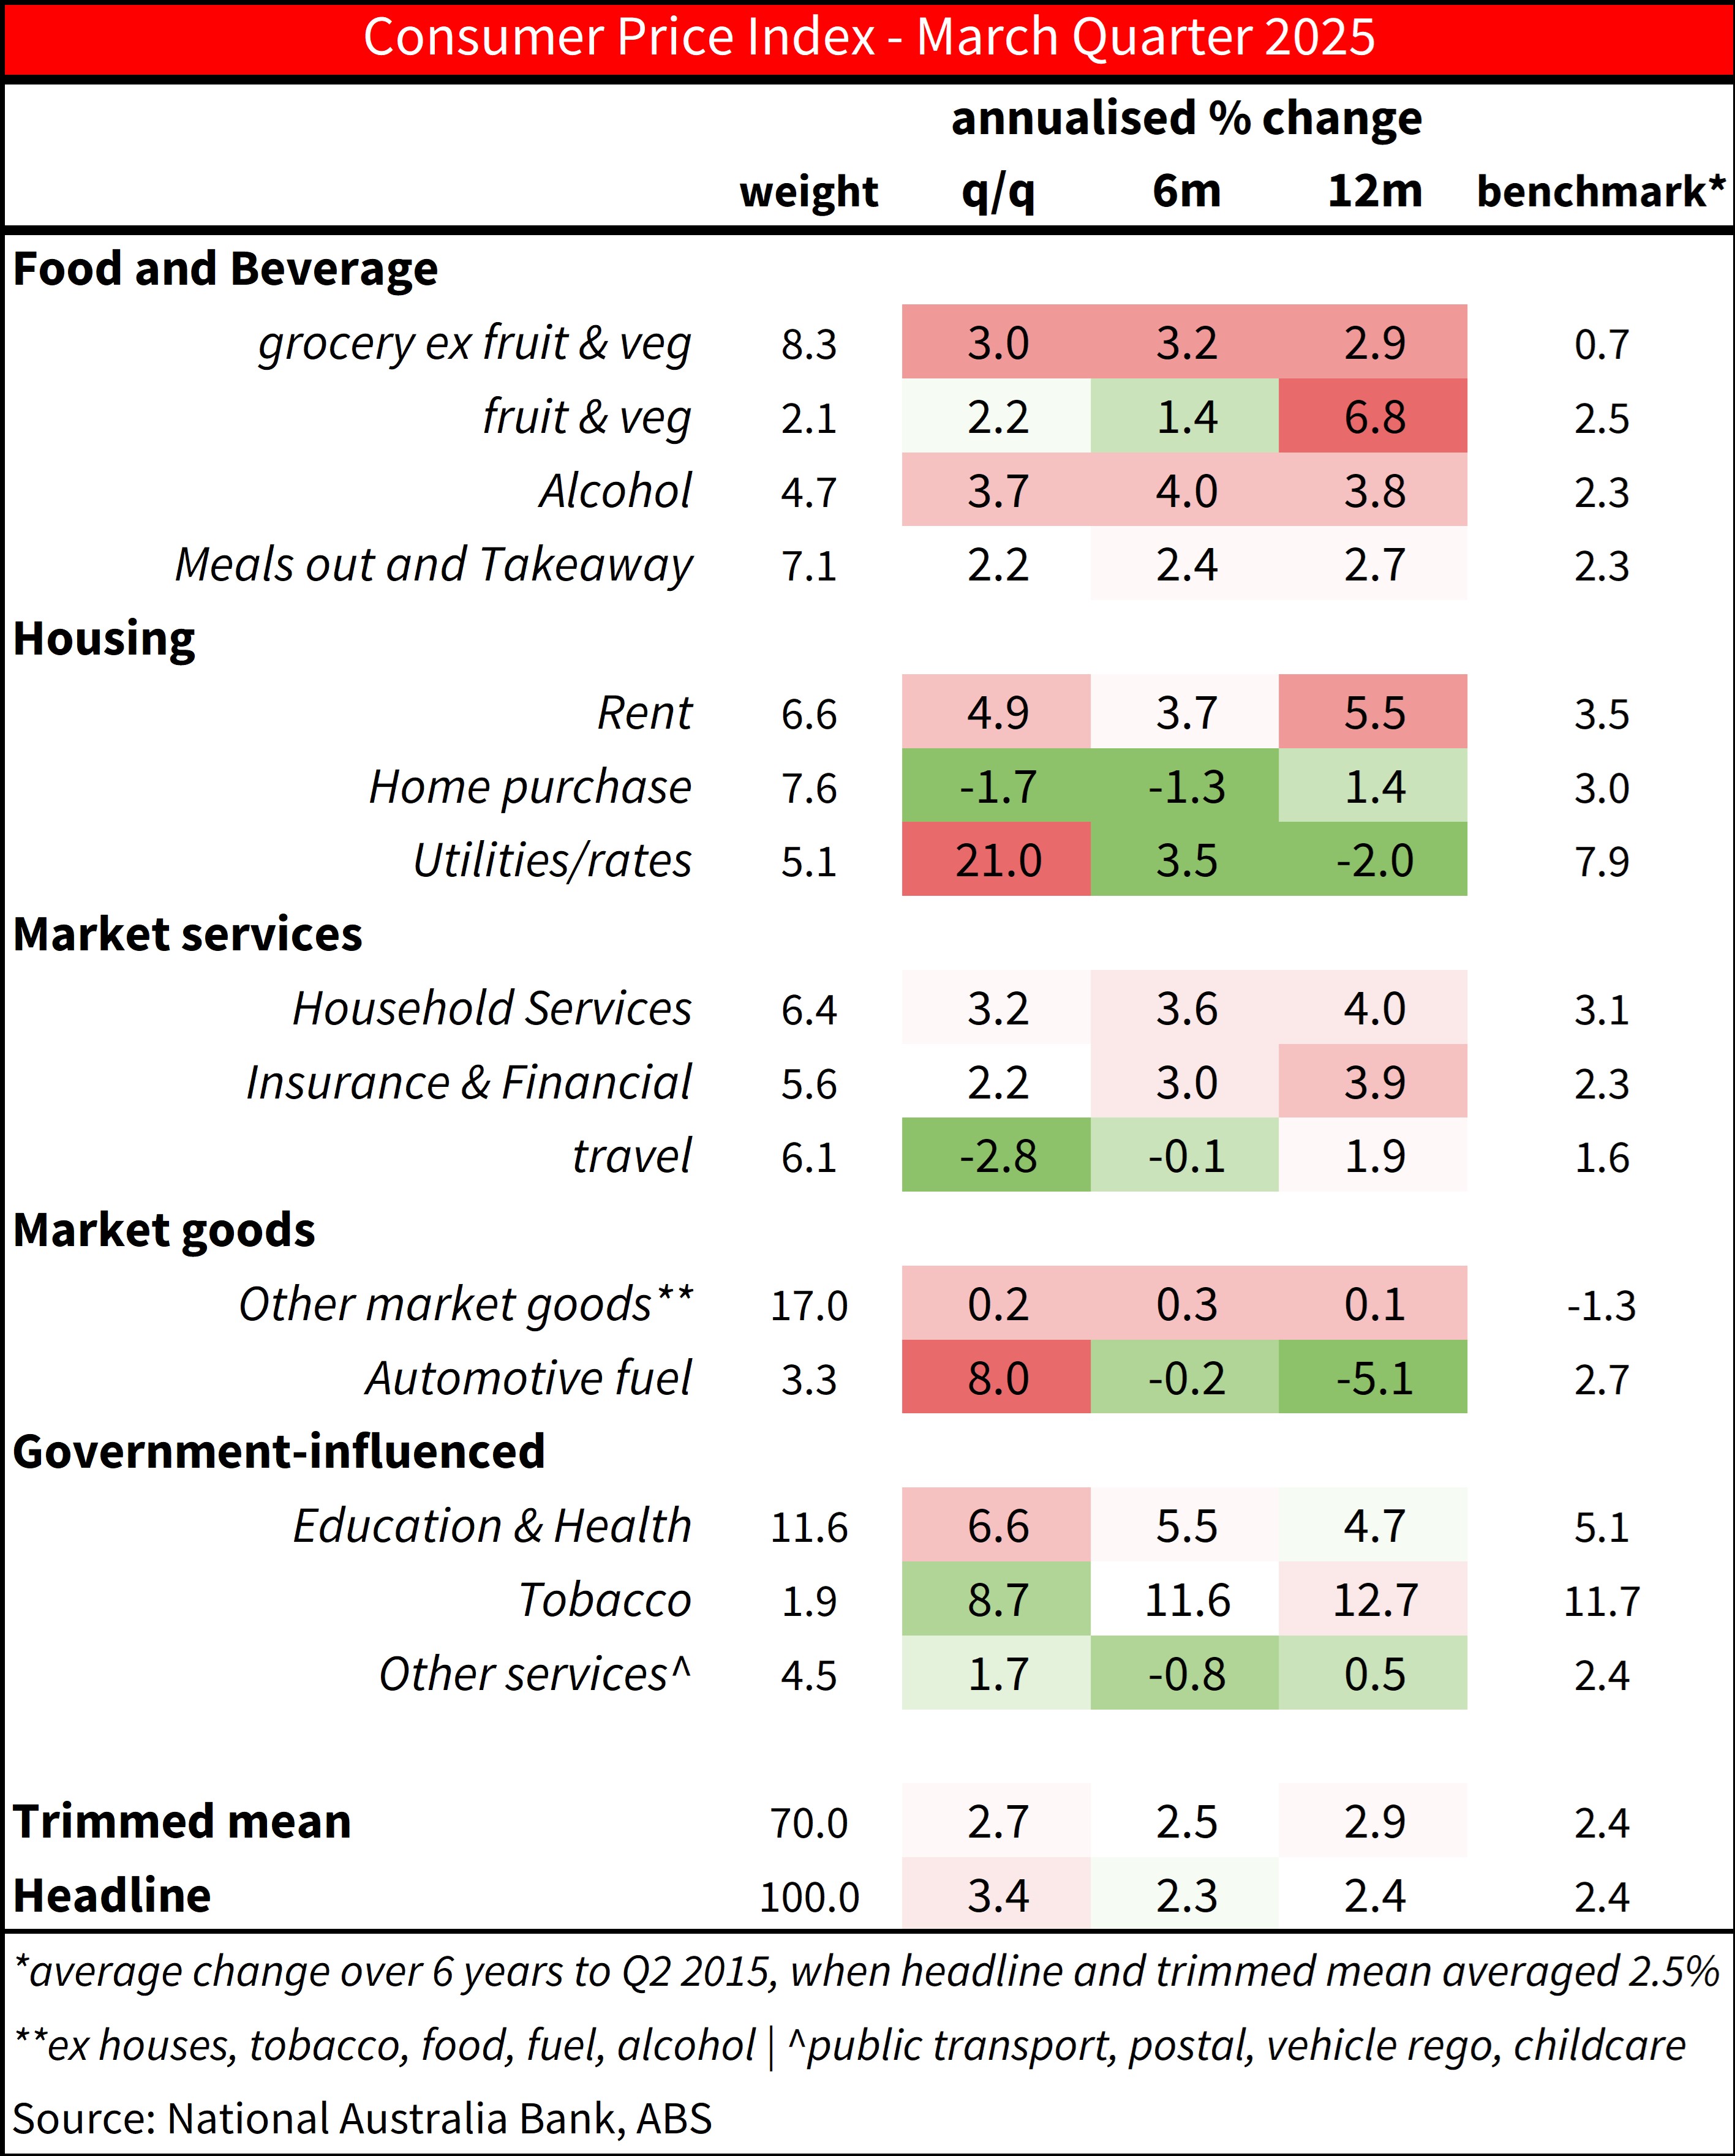
Chart 3: CPI excluding electricity
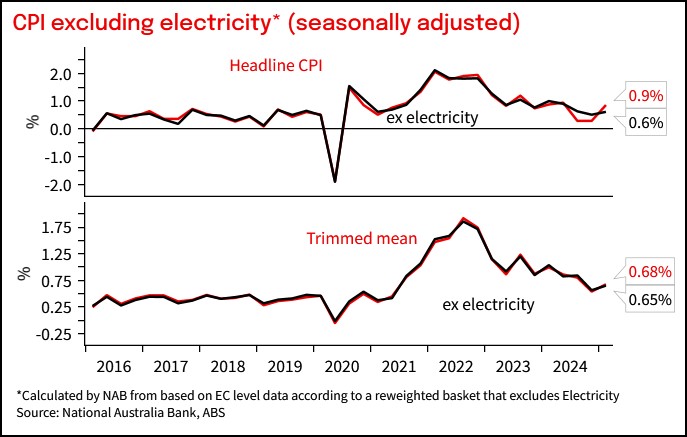
Chart 4: Tradable and non-tradable inflation.
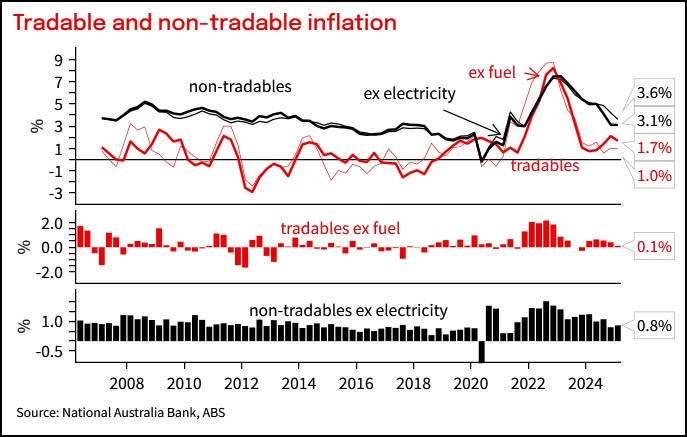
Chart 5: Market goods inflation
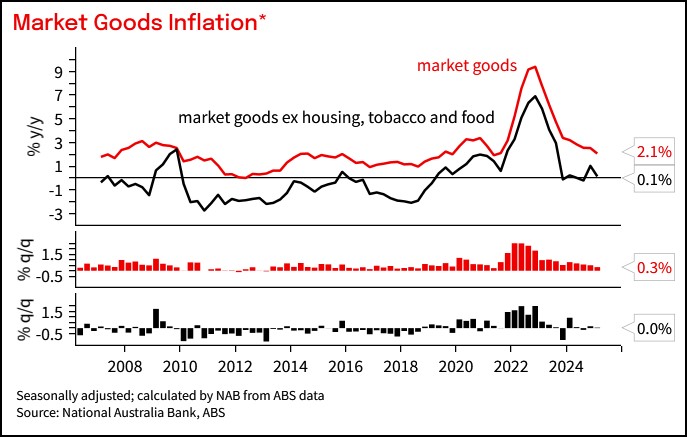
Chart 5: Market services inflation
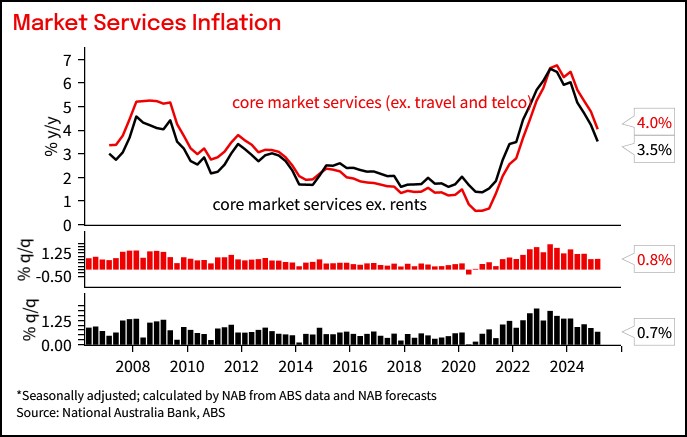
Chart 7: Share of basket with price rises faster than threshold level (quarterly annualised)
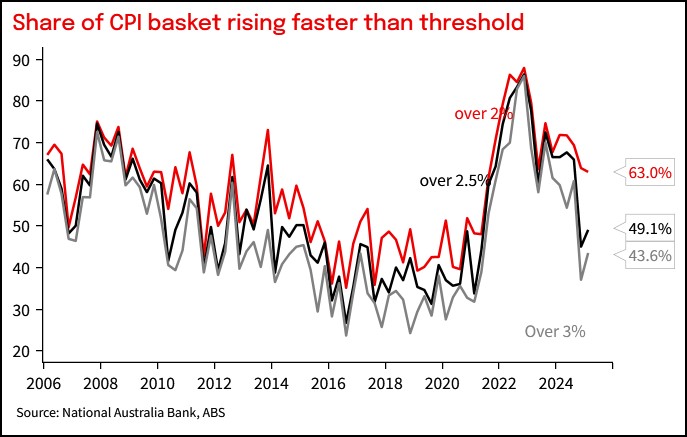
Chart 8: Distribution of seaosnally adjusted quarterly price increase, Q1 2025 and selected comparison quarters
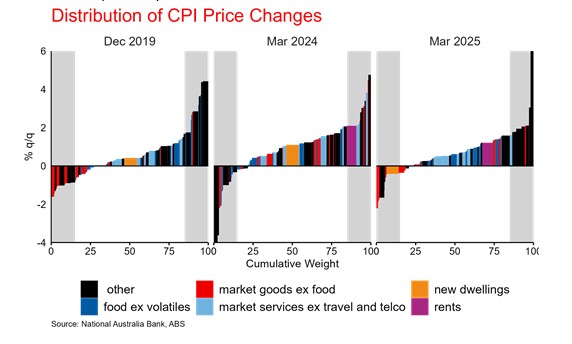
Chart 9: Indicative distribution of price increases shows the Q4 outcome was pulled down by a fat left tail, and the distribution of price rises generally has substantially normalised form the period of high inflation.
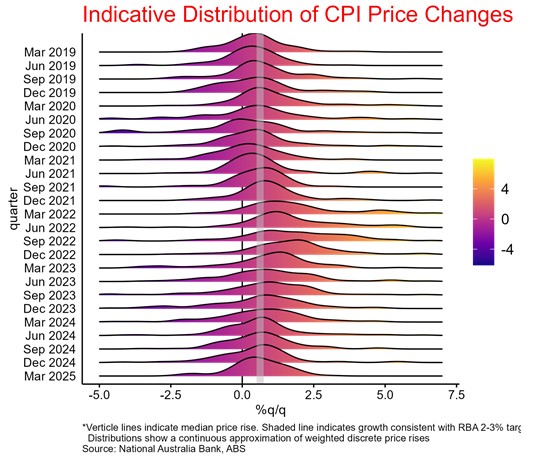
Table 2: Actuals relative to NAB forecasts
This document has been prepared by National Australia Bank Limited ABN 12 004 044 937 AFSL 230686 ("NAB"). Any advice contained in this document has been prepared without taking into account your objectives, financial situation or needs. Before acting on any advice in this document, NAB recommends that you consider whether the advice is appropriate for your circumstances. NAB recommends that you obtain and consider the relevant Product Disclosure Statement or other disclosure document, before making any decision about a product including whether to acquire or to continue to hold it.
Please Click Here to view our disclaimer and terms of use. Please Click Here to view our NAB Financial Services Guide.
All prices and analysis at 30 April 2025. This information has been prepared by National Australia Bank Limited ABN 12 004 044 937 AFSL 230686 ("NAB"). The content is distributed by WealthHub Securities Limited (WSL) (ABN 83 089 718 249)(AFSL No. 230704). WSL is a Market Participant under the ASIC Market Integrity Rules and a wholly owned subsidiary of National Australia Bank Limited (ABN 12 004 044 937)(AFSL No. 230686) (NAB). NAB doesn’t guarantee its subsidiaries’ obligations or performance, or the products or services its subsidiaries offer. This material is intended to provide general advice only. It has been prepared without having regard to or taking into account any particular investor’s objectives, financial situation and/or needs. All investors should therefore consider the appropriateness of the advice, in light of their own objectives, financial situation and/or needs, before acting on the advice. Past performance is not a reliable indicator of future performance. Any comments, suggestions or views presented do not reflect the views of WSL and/or NAB. Subject to any terms implied by law and which cannot be excluded, neither WSL nor NAB shall be liable for any errors, omissions, defects or misrepresentations in the information or general advice including any third party sourced data (including by reasons of negligence, negligent misstatement or otherwise) or for any loss or damage (whether direct or indirect) suffered by persons who use or rely on the general advice or information. If any law prohibits the exclusion of such liability, WSL and NAB limit its liability to the re-supply of the information, provided that such limitation is permitted by law and is fair and reasonable. For more information, please click here.