Why ASX miners will handily beat banks in the long-term
James Gruber | Firstlinks
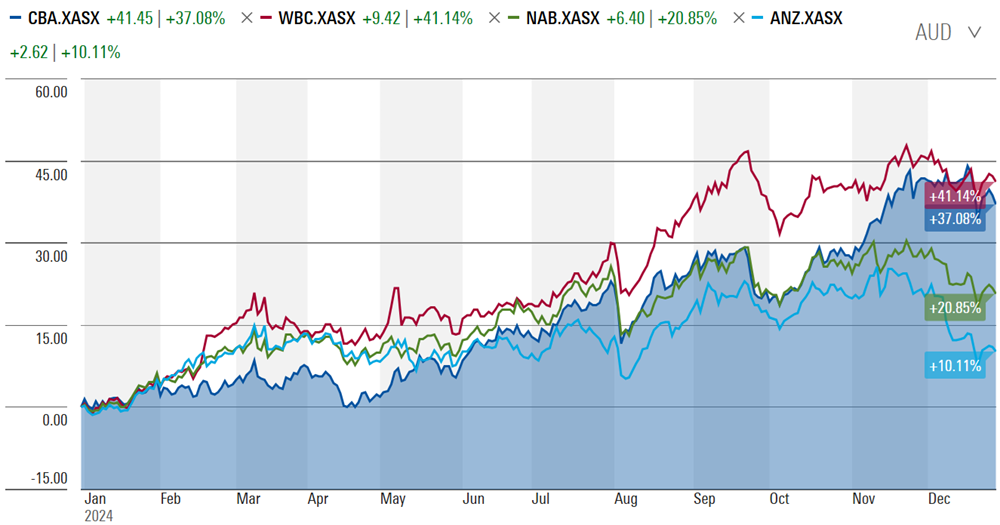
Banks crushed it in 2024. They were up 34%, easily outpacing the ASX 200’s 11% return. The stellar performance was led by Westpac (ASX:WBC), up 41% in price terms, closely followed by Commonwealth Bank’s rise of 37% (ASX:CBA). NAB (ASX:NAB) and ANZ (ASX:ANZ) lagged the big two banks, climbing 21% and 10% respectively.
 Source: Morningstar
The amazing part of the banks’ run is that it happened despite earnings going backwards. Normally, share prices follow earnings, yet that didn’t occur last year. The stocks rose purely due to an expansion in valuation multiples.
Why did this happen? Many blame passive investing, or a pool of liquidity via super funds that needed to find a home. Though it was more likely a case that miners were unloved, and if investors wanted to put money into the ASX, they didn’t have much choice but to invest in the banks.
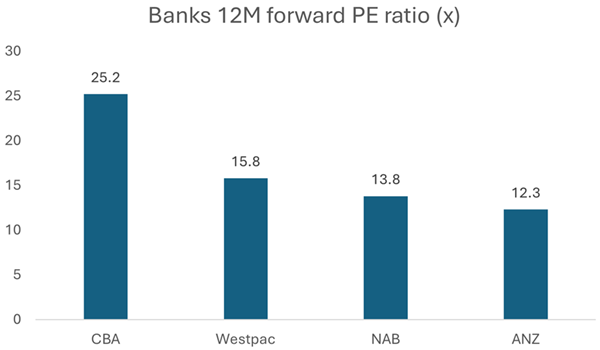
Valuations for banks now look steep. It’s especially so for CBA, which is trading at 27x trailing earnings and 25x forward earnings. Westpac isn’t cheap either, trading at 16x forward earnings. Meanwhile, the smaller banks are at much lower multiples.
Source: Morningstar
The Big Four banks’ price-to-earnings (PE) ratio is at a slight premium to the ASX 200’s forward multiple of 17.6x. That’s unusual versus history, and it’s difficult to square when the sector has struggled to grow recent earnings.
Is a great sector rotation imminent?
The big question for 2025 is whether bank profits can justify current valuations. And if they disappoint, will there be a great rotation out of the banks into the other ASX 200 heavyweight, resources?
Unlike the banks, miners had a terrible 2024. Their share prices were down 15%, trailing the ASX 200 by 26% and the banks by 47%.
They were pummelled by a stuttering Chinese economy that hit iron ore prices and the bursting of the lithium bubble. Big caps such as BHP (ASX:BHP) and Rio (ASX:RIO) held up better than most miners, ending the year down 22% and 18% respectively.
It’s left the resources sector at far cheaper valuation multiples compared to the rest of the ASX. The miners are trading at a 12-month forward PE ratio of 11.2x, a 36% discount to the ASX 200 and a 37% discount to the ASX financials sector.
There might also be a ‘double discount’ with miners too. Not only are they on inexpensive multiple, but their earnings are also at depressed levels after recent commodity price falls.
The short-term case for a rotation
It wouldn’t take much for a sharp rotation to happen from the banks into miners. Given the spluttering economy and slowing credit and house price growth, it wouldn’t surprise if bank earnings disappointed the already modest projections of analysts.
On the flip side, expectations for the resource companies are the low end. The market will jump on any sign of good news.
The long-term case for a rotation
There’s a good case to be made that a rotation out of banks into miners could last a long time, rather than just a few years.
Over the past week, I’ve spent too much time staring at the following chart:
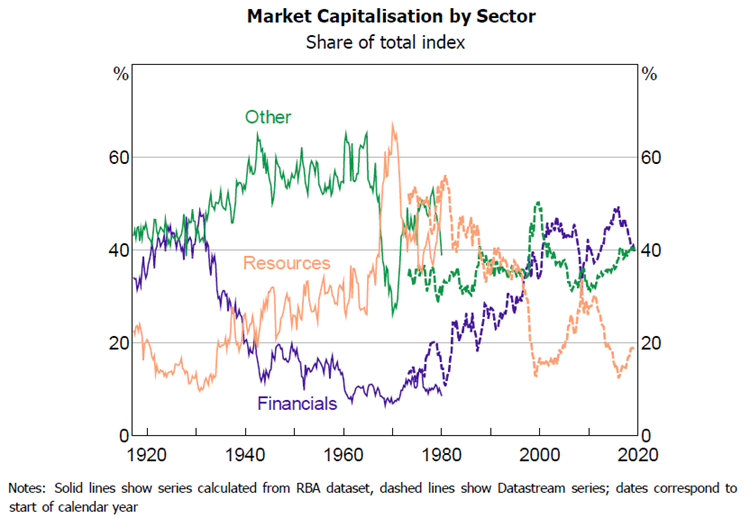
Source: Thomas Mathews, RBA Discussion Paper: ‘A history of Australian Equities’.
The chart tracks the market cap share of different sectors of the ASX 100 from 1917 to mid-2019.
It’s a chart that’s mesmorised me for a few reasons:
- Investors nowadays are trained to think short-term, when business, equity, and capital cycles can often last decades, and this chart reflects that.
- Look at how the financials and resources sectors have mostly moved inversely to each other. When you think about it, this shouldn’t surprise because they are the two largest ASX sectors.
- Notice how the peak share for the financials sector topped out at similar levels in 1930 and then again 78 years later in 2018.
- Banks performed horribly for 40 years between 1940 and 1980. This was principally due to stricter regulation post the Great Depression and World War Two.
- Also notable is how the resources sector bottomed in the mid to low teens share in 1930, 1999, and 2017-2018.
- The ‘other’ sector – comprising all the remaining sectors in the ASX 100 – was huge between 1940 and 1980, reflecting the rise of Australian manufacturers. However, since the decline of many manufacturers, the market cap share has been relatively steady, hovering mostly between 35% and 45%.
The chart finishes in 2019. Updating it to now, the market share of banks in the ASX 100 has increased over the past five years to 42%, while resources have also risen to 22%.
Zooming in on the banks since 1980, their share of the market has lifted from close to 10% to what it is today. It’s been a remarkable rise.
It’s partly been a global story of growing financialisation – the increase in the size and influence of financial institutions vis-à-vis the economy and other sectors. Macquarie’s Viktor Shvets estimates that the value of financial assets around the globe is at least 5x greater than the real economy, and possibly 10x including gross derivatives and private capital.
Financialisation has been driven by the massive uptick in global debt, aided by lower interest rates, over the past 45 years. Total world debt reached US$322 trillion in the third quarter of last year, around 326% of global GDP. That percentage is up from around 230% of GDP in 2000.
It isn’t just an overseas phenomenon. In Australia, housing - valued at $11 trillion – is almost 4x larger than the size of our economy. Superannuation has also grown into a behemoth, with assets above $4 trillion.
The financialisation of our economy has undoubtedly helped the ASX banks. Another beneficial factor has been the deregulation of the economy since the 1980s.
Both these powerful tailwinds appear unsustainable in the short and long terms. A reversal of financialisation would see capital flowing out of the financial sector into tangible assets such as commodities.
And economic deregulation already appears to be on the outer. For the banks, regulation has increased since the Royal Commission into banking, and that’s crimped credit growth. It’s no accident that the Royal Commission concluded its work in early 2019, and the banks’ share of the ASX 100 peaked in 2018.
Going back to the chart on market capitalization by sector, history would suggest that the banks’ share is close to topping out, while resources may have a long way to run. In other words, a convergence in the shares of the two sectors would appear more likely than not.
And even a minor reversal in the structural drivers which have helped banks and hindered resources in recent decades could make this happen.
Put simply, I think there are favourable odds that ASX resources will handily beat the banks over the next 10+ years.
First published on the Firstlinks Newsletter. A free subscription for nabtrade clients is available here.
All prices and analysis at 29 January 2025. This document was originally published on firstlinks.com.au on 29 January has been prepared Firstlinks, a Morningstar publication (Morningstar Australasia Pty Limited (“Morningstar”) ABN: 95 090 665 544 AFSL: 240 892). The content is distributed by WealthHub Securities Limited (WSL) (ABN 83 089 718 249)(AFSL No. 230704). WSL is a Market Participant under the ASIC Market Integrity Rules and a wholly owned subsidiary of National Australia Bank Limited (ABN 12 004 044 937)(AFSL No. 230686) (NAB). NAB doesn’t guarantee its subsidiaries’ obligations or performance, or the products or services its subsidiaries offer. This material is intended to provide general advice only. It has been prepared without having regard to or taking into account any particular investor’s objectives, financial situation and/or needs. All investors should therefore consider the appropriateness of the advice, in light of their own objectives, financial situation and/or needs, before acting on the advice. Past performance is not a reliable indicator of future performance. Any comments, suggestions or views presented do not reflect the views of WSL and/or NAB. Subject to any terms implied by law and which cannot be excluded, neither WSL nor NAB shall be liable for any errors, omissions, defects or misrepresentations in the information or general advice including any third party sourced data (including by reasons of negligence, negligent misstatement or otherwise) or for any loss or damage (whether direct or indirect) suffered by persons who use or rely on the general advice or information. If any law prohibits the exclusion of such liability, WSL and NAB limit its liability to the re-supply of the information, provided that such limitation is permitted by law and is fair and reasonable. For more information, please click here.