Q4 CPI undershoots RBA forecasts on lower housing inflation
Taylor Nugent | Markets Research
Key points:
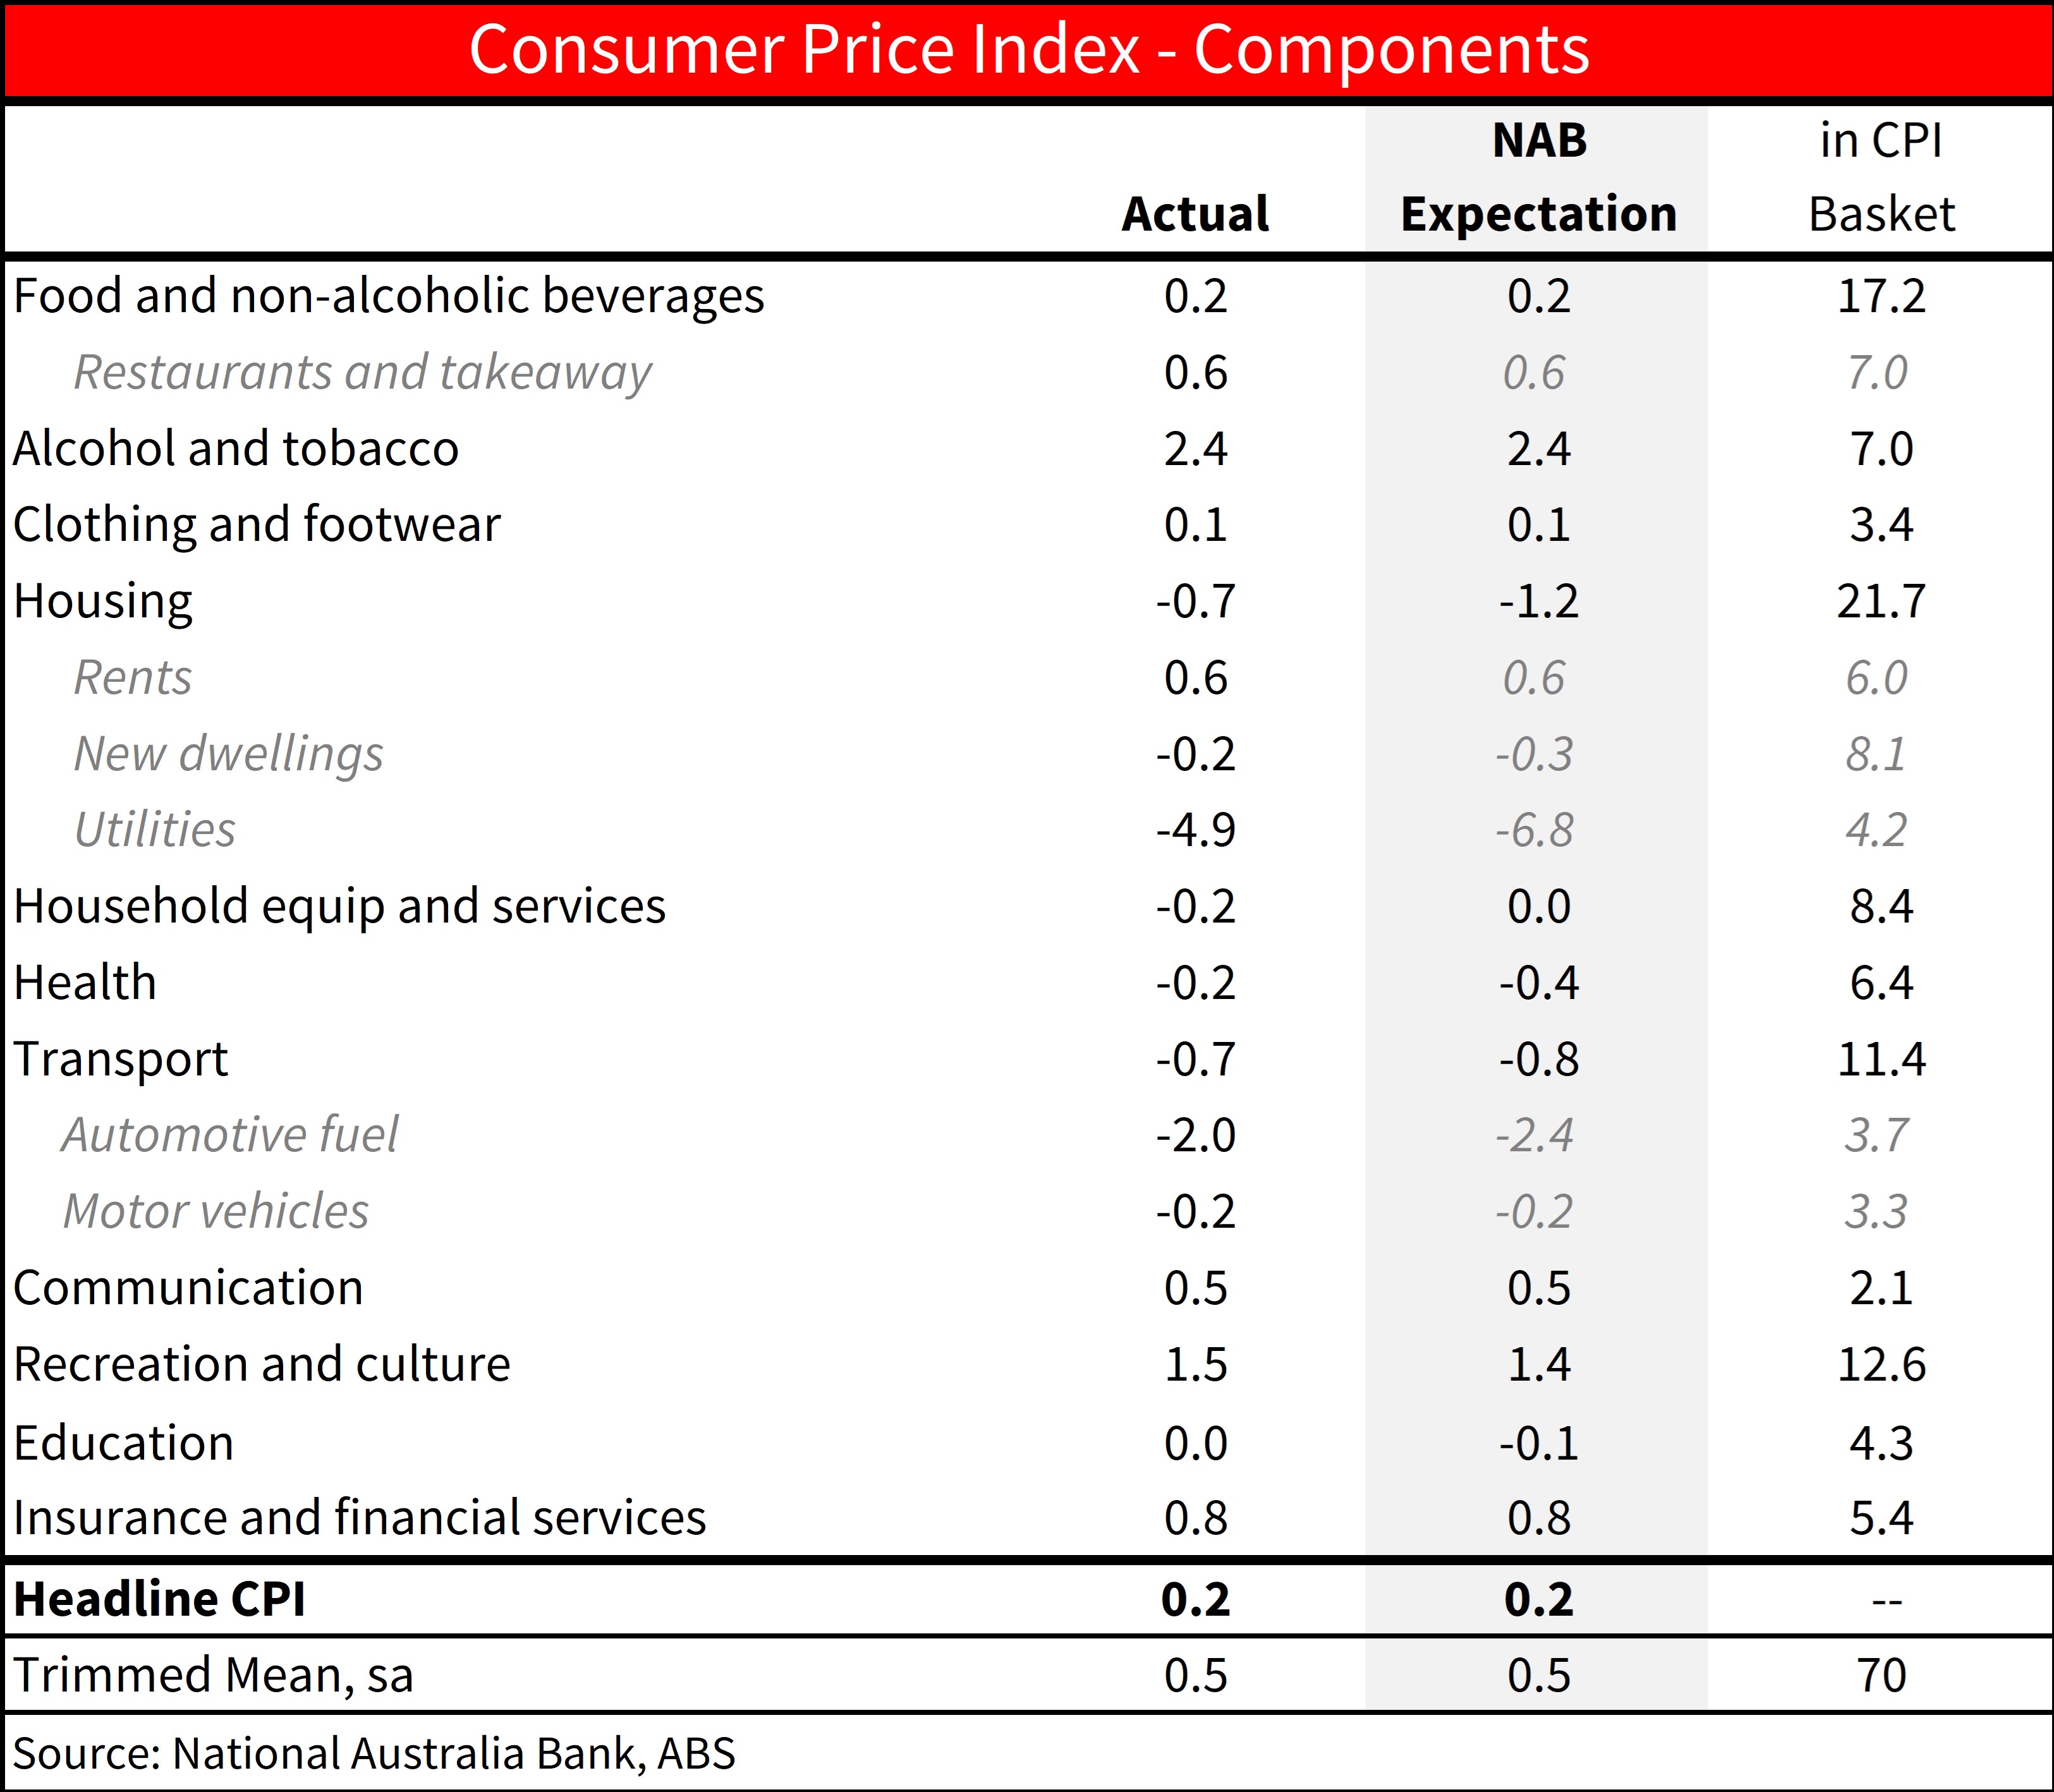
- Trimmed mean at 0.5% q/q and 3.2% y/y (NAB 0.5%, Consensus 0.6%)
- Soft headline (0.2% q/q and 2.4% y/y) is once again driven by drags from fuel and electricity. (NAB 0.2%, Consensus 0.3%)
- Trimmed mean inflation is 2 tenths below the RBA’s dated November forecast
- Inflation is not a barrier to cuts and the February meeting remains live
- NAB’s cash rate forecast is under review
Bottom Line:
Q4 CPI was in line with our expectations. Weighing on headline again this quarter was a measured fall in electricity prices which fell 9.9% q/q, without the rebates they would have risen 0.2% q/q. Volatile fuel prices fell 2.0% q/q after a 6.7% fall last quarter. Housing accounted for almost all of the improvement in trimmed mean inflation in the quarter. Some of that is temporary, but the plateauing in house construction costs are an important and helpful shift in the CPI backdrop that support downward revisions to the RBA’s near term outlook. Further out, given unemployment has noticeably undershot their forecasts, the extent to which the RBA remains comfortable inflation will stay near target depends on the extent to which they re-assess the degree of spare capacity in the labour market.
Inflation is not a barrier to a cut in February and the meeting is live. NAB’s RBA call is under review. Our call has been that on balance the RBA would hold fire before cutting in May given there is little urgency to cut and there is option value in waiting to better assess the trajectory of the labour market and the extent of the pickup in growth, before delivering 75bp of cuts this year. By April, the RBA would have 2 more unemployment prints, Q4 GDP, Q4 WPI, and the February CPI Indicator. By May, the RBA would have Q1 CPI and an additional 2 employment prints.
Detail:
Overall, our heatmap in Table 1 shows inflation was especially soft in the quarter through housing components and volatile items including fruit and veg, automotive fuel, and travel. Subsidy impacts also weighed in the quarter, from electricity to rent assistance to cheaper vehicle rego in Queensland. None of that is to dispute that the RBA’s November inflation forecasts were too pessimistic and the inflation detail is meaningfully better than the RBA feared when they drew their pessimistic November forecasts.
New Dwelling construction costs and Rents are the two largest components of the CPI. A 0.2% q/q decline in New Dwelling costs marks a rapid slowdown from its recent pace, and the component contributed 14bp less to trimmed mean in Q4 than in Q3. A 10% increase in rent assistance also subtracted 10bp from trimmed mean CPI. Together, these components accounted for almost all of the slowdown in trimmed mean. Rents will rebound in Q1 before gradually cooling from late 2025. New Dwellings, however, will be an ongoing source of lower inflation relative to earlier in 2024, and are a hugely important shift in the CPI backdrop
Services: Overall services inflation slowed to 4.3% from 4.6% y/y. Looking at a subset of services closely watched by the RBA as in indicator of domestic demand pressure, market services inflation excluding travel and telco was 0.8% q/q (in line with our forecast), its lowest since Q2 2021. That includes the impact of rent assistance. Further excluding rents shows market services inflation at 0.8% q/q after 1.0% and 0.9%. Consistent with ongoing gradual progress on services inflation. Elevated insurance inflation had been a key driver of elevated services inflation, in large part reflecting catch-up to earlier underlying cost pressures through car and dwelling replacement and repair costs, but, as already confirmed in the November monthly outcome, are now fading.
Goods: Durable goods prices (outside of new dwellings) remain broadly benign, though market goods prices outside of food, tobacco and new dwellings as rose 0.2% q/q (NAB 0.3% q/q) and 1.0% y/y. Grocery price inflation continues to annualise above 2% y/y, above the 0.7% y/y pace that prevailed last time inflation was sustainably near target.
Chart 1: Headline and Trimmed Mean Inflation
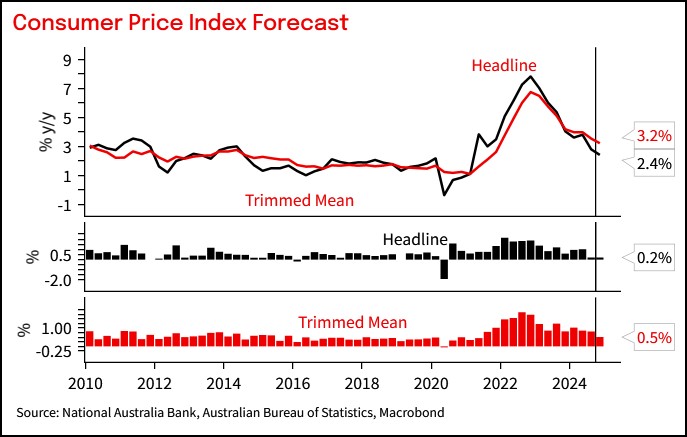
Chart 2: Contributions to CPI inflation
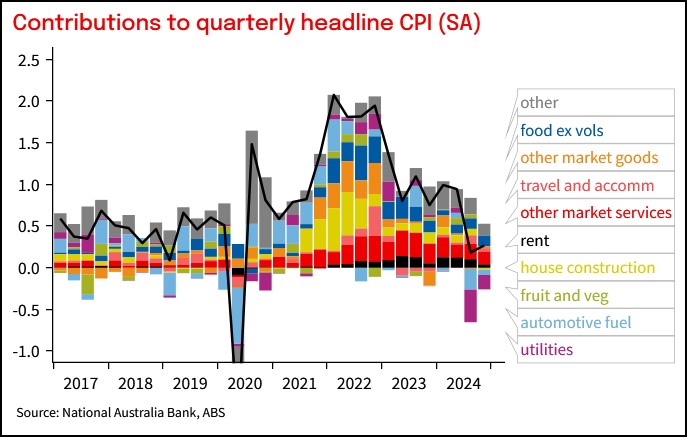
Table 1: CPI heat map. Shows 3-, 6- and 12m annualised outcomes. Shading reflects how far inflation is above or below a benchmark of the 6 years to 2015 when inflation averaged around the mid-point of the target
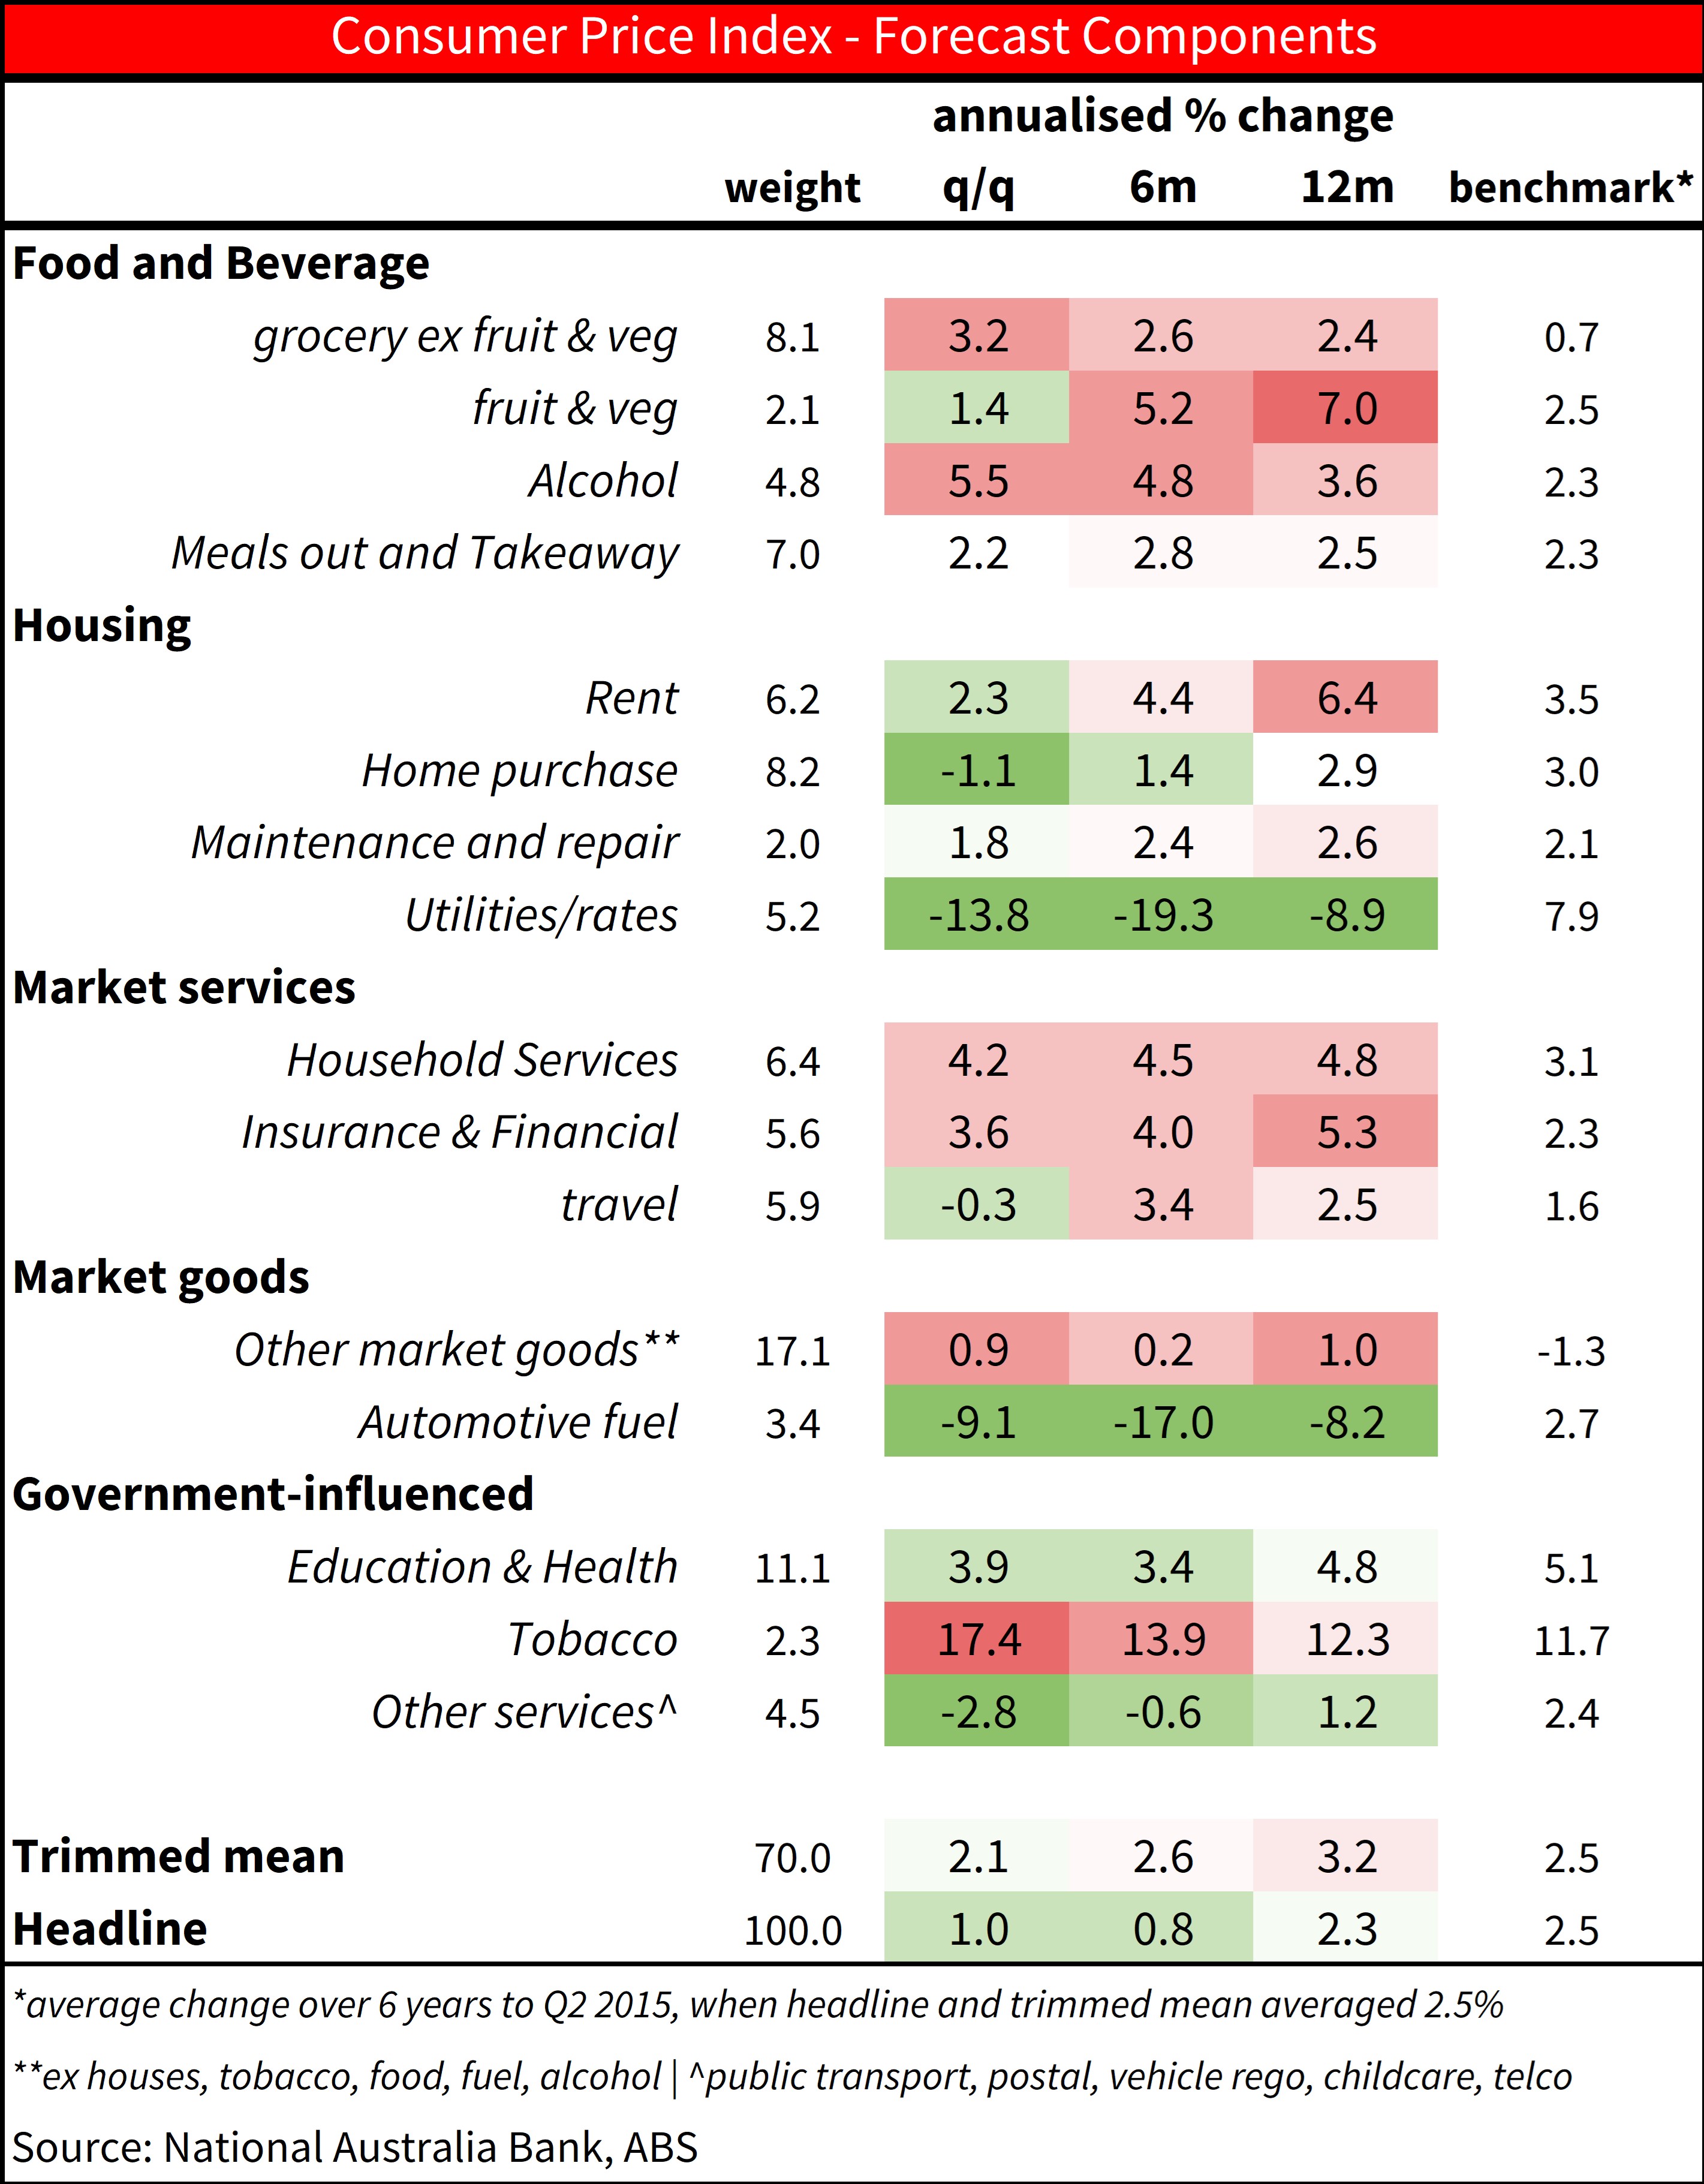
Chart 3: Tradable and non-tradable inflation
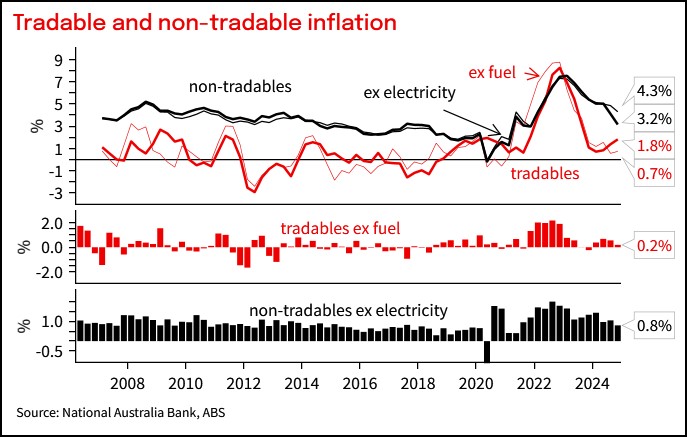
Chart 4: Market goods inflation
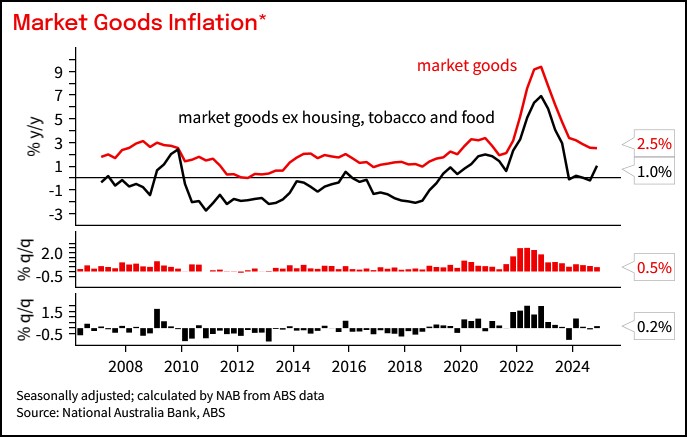
Chart 5: Market services inflation
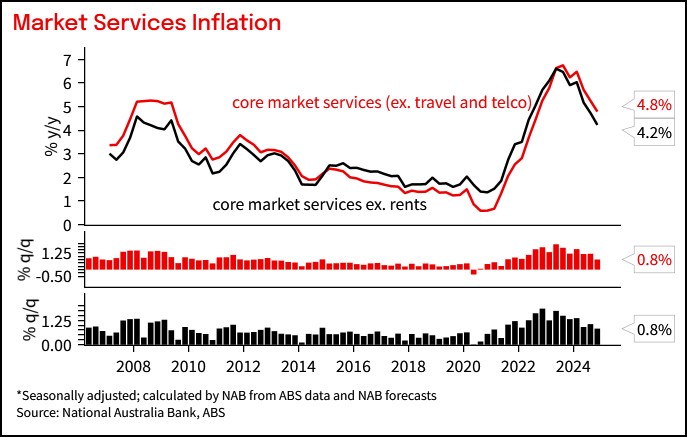
Chart 6: Share of basket with elevated annualised price increases fell sharply, again due to lower inflation in large rents and new dwelling components
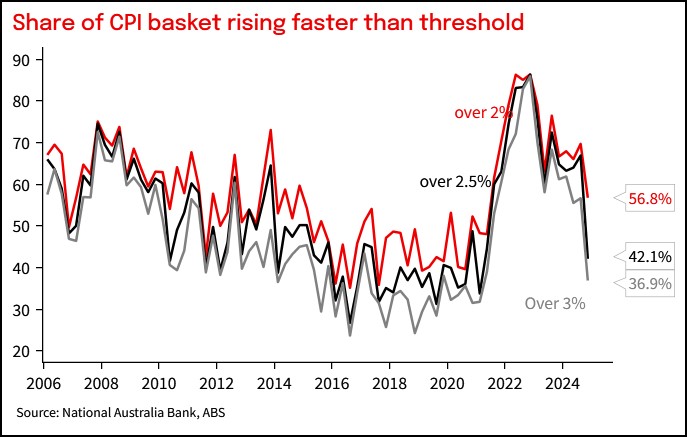
Chart 7: Distribution of price increases has shifted noticeably lower since the peaks in inflation, and Q4 2024 included a notable negative skew
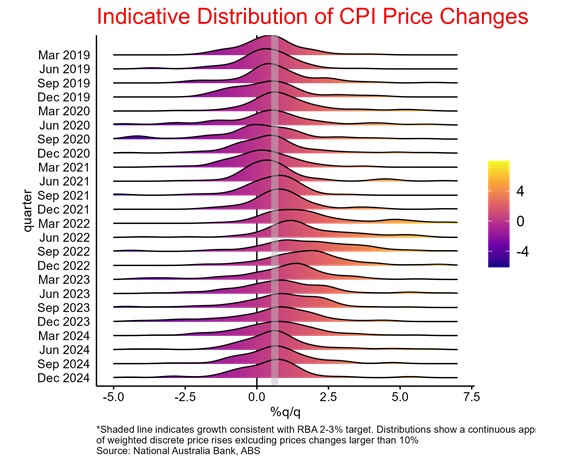
Table 2: Comparison to forecast
This document has been prepared by National Australia Bank Limited ABN 12 004 044 937 AFSL 230686 ("NAB"). Any advice contained in this document has been prepared without taking into account your objectives, financial situation or needs. Before acting on any advice in this document, NAB recommends that you consider whether the advice is appropriate for your circumstances. NAB recommends that you obtain and consider the relevant Product Disclosure Statement or other disclosure document, before making any decision about a product including whether to acquire or to continue to hold it. Please Click Here to view our disclaimer and terms of use. Please Click Here to view our NAB Financial Services Guide.
All prices and analysis at 29 January 2025. This information has been prepared by National Australia Bank Limited ABN 12 004 044 937 AFSL 230686 ("NAB"). The content is distributed by WealthHub Securities Limited (WSL) (ABN 83 089 718 249)(AFSL No. 230704). WSL is a Market Participant under the ASIC Market Integrity Rules and a wholly owned subsidiary of National Australia Bank Limited (ABN 12 004 044 937)(AFSL No. 230686) (NAB). NAB doesn’t guarantee its subsidiaries’ obligations or performance, or the products or services its subsidiaries offer. This material is intended to provide general advice only. It has been prepared without having regard to or taking into account any particular investor’s objectives, financial situation and/or needs. All investors should therefore consider the appropriateness of the advice, in light of their own objectives, financial situation and/or needs, before acting on the advice. Past performance is not a reliable indicator of future performance. Any comments, suggestions or views presented do not reflect the views of WSL and/or NAB. Subject to any terms implied by law and which cannot be excluded, neither WSL nor NAB shall be liable for any errors, omissions, defects or misrepresentations in the information or general advice including any third party sourced data (including by reasons of negligence, negligent misstatement or otherwise) or for any loss or damage (whether direct or indirect) suffered by persons who use or rely on the general advice or information. If any law prohibits the exclusion of such liability, WSL and NAB limit its liability to the re-supply of the information, provided that such limitation is permitted by law and is fair and reasonable. For more information, please click here.