No Surprises in Q3 CPI as little progress on trimmed mean leaves RBA on the sidelines
Taylor Nugent | Markets Research
Key points:
- Trimmed mean at 0.8% q/q and 3.5% y/y, in line with our, consensus and the RBA’s forecasts
- Soft headline (0.2% q/q/ 2.8% y/y) is driven by fuel and electricity. The RBA will look through
- Electricity rebates and higher rent assistance will also weigh on Q4 CPI
- There is little sequential progress on underlying and domestic services inflation, which will keep the RBA cautious
Bottom Line:
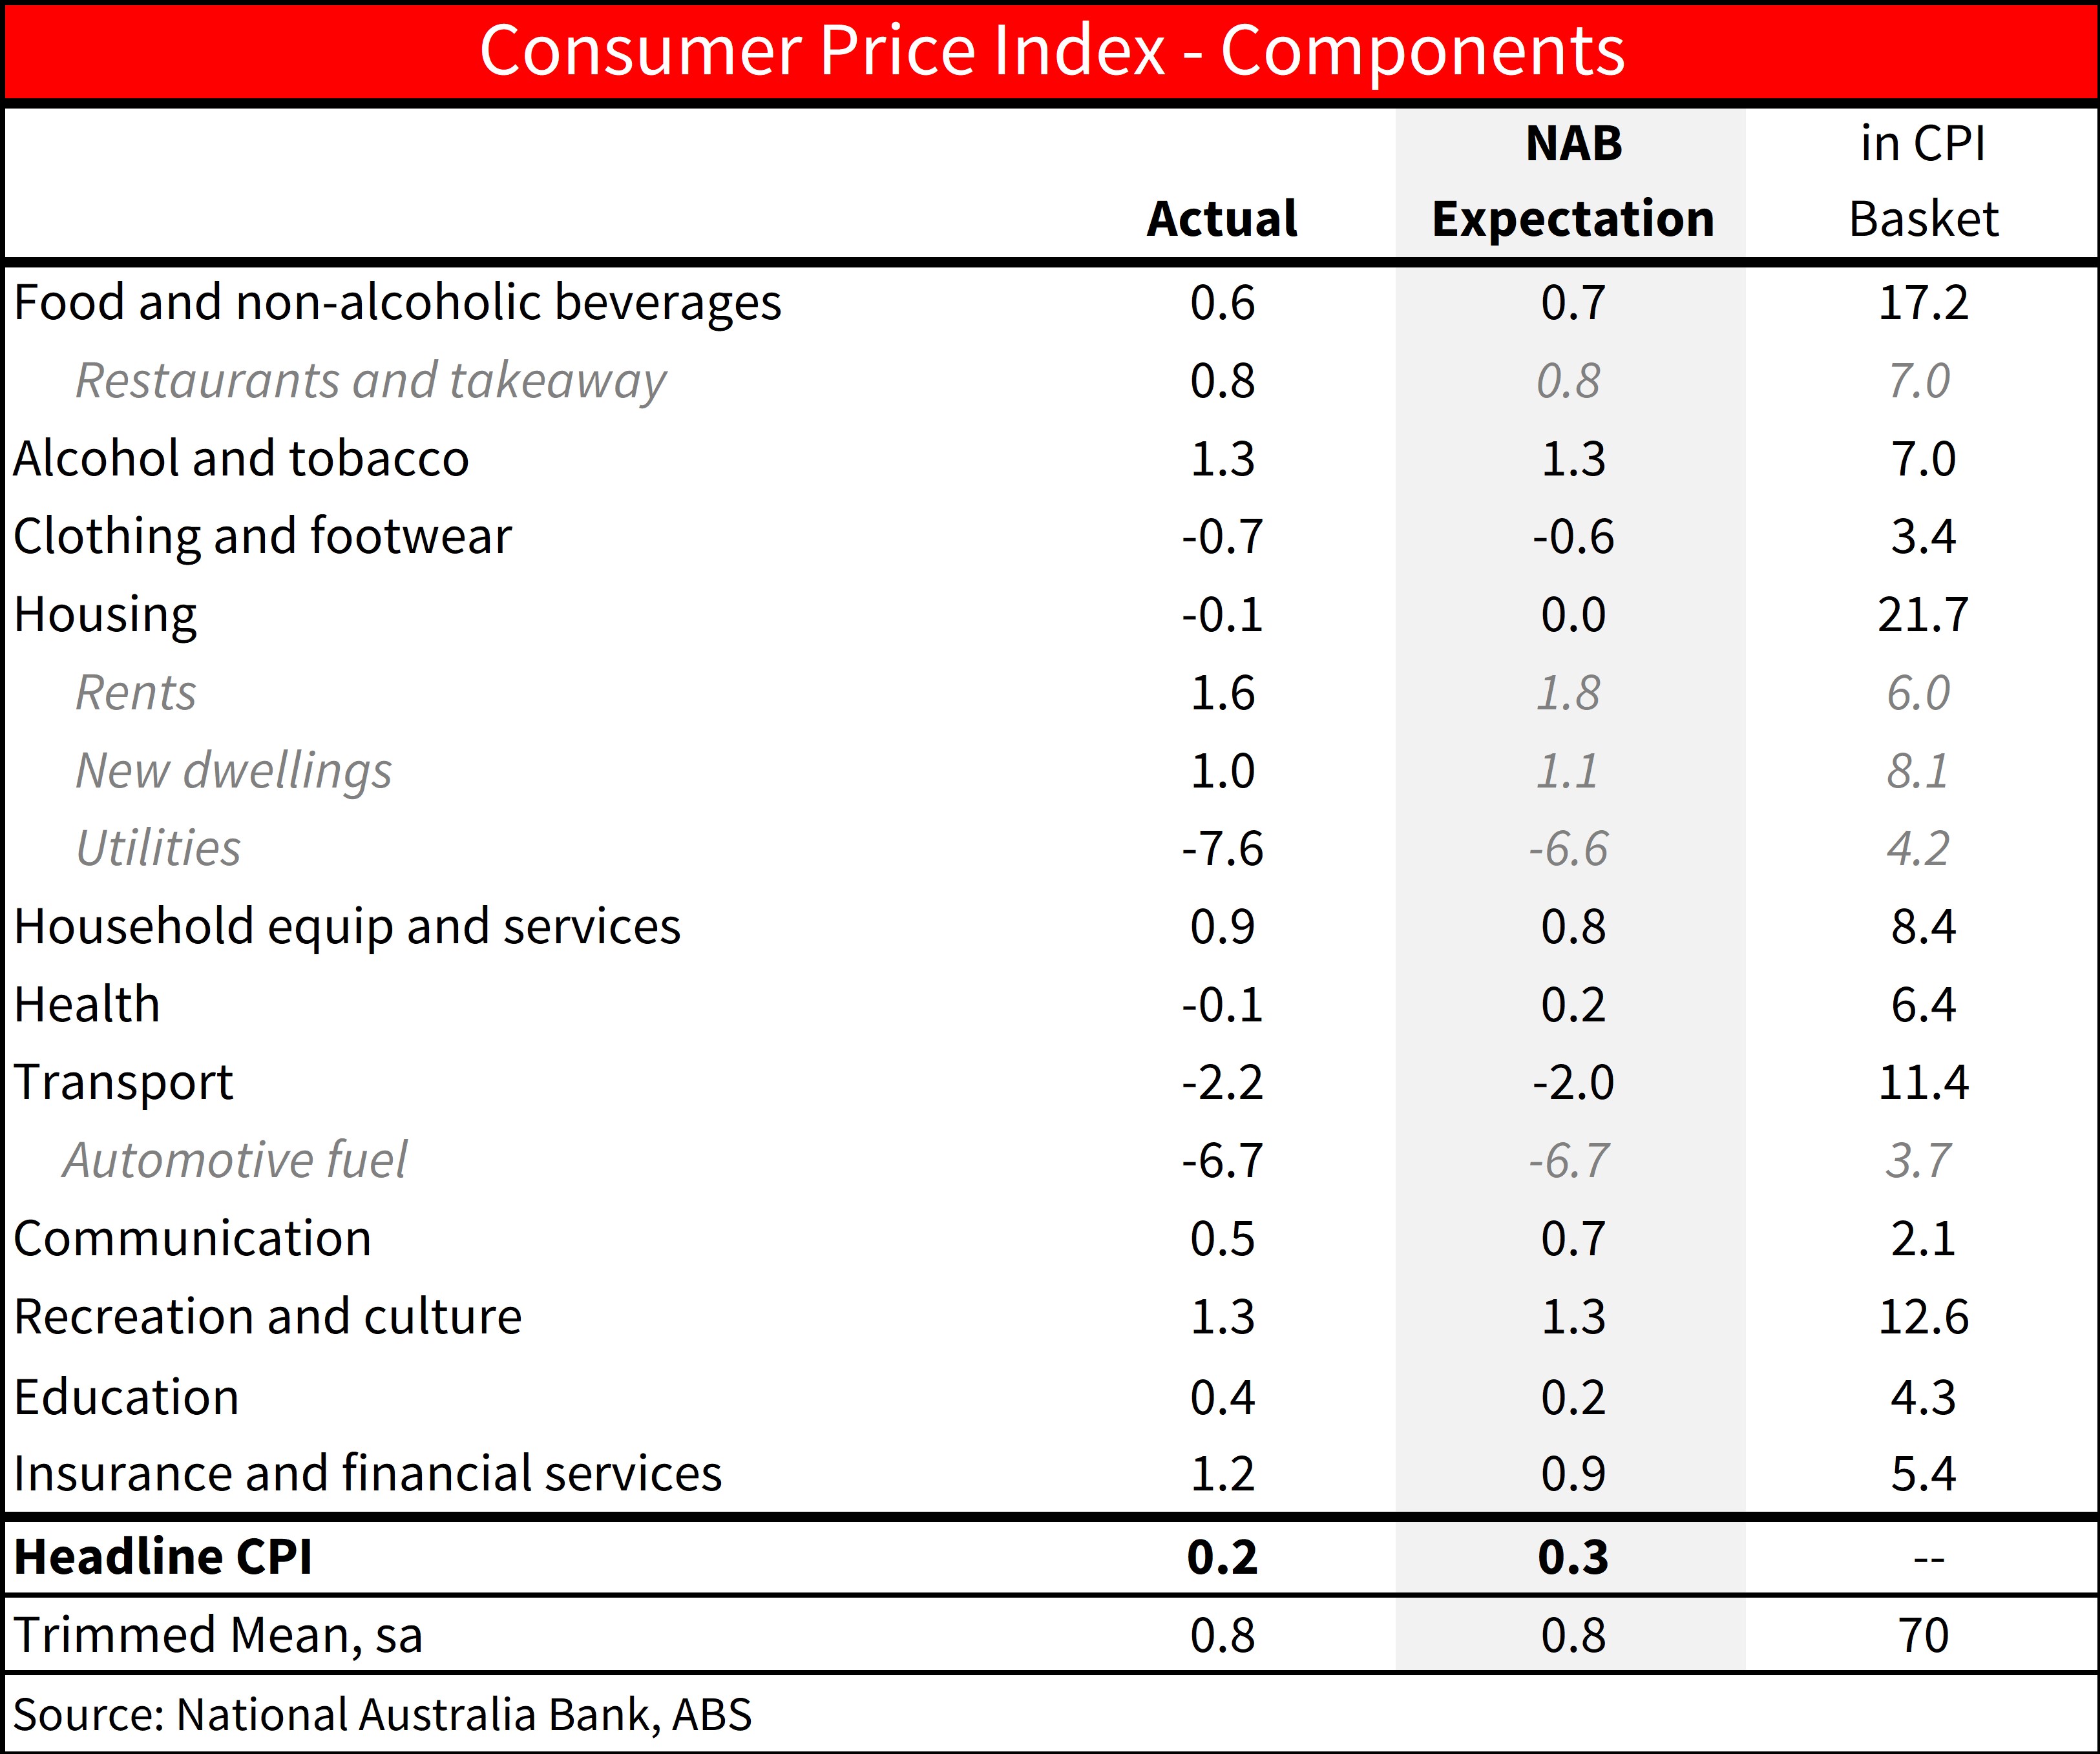
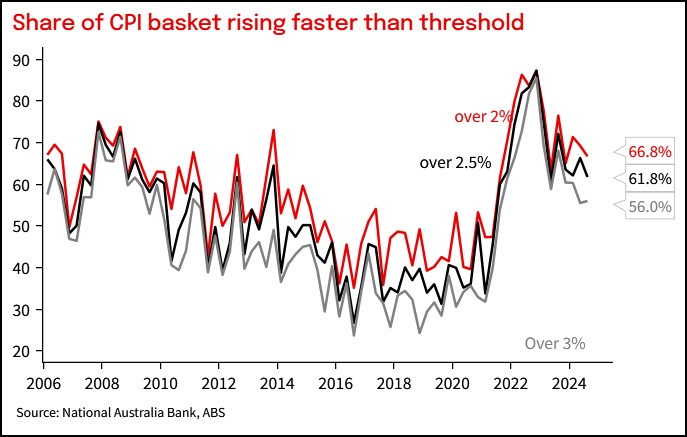
Q3 CPI was broadly in line with expectations. Trimmed mean was 0.78% q/q for 3.5% y/y. Q2 trimmed mean was revised higher to 0.9% q/q after a modest 3bp upward revision tripped a rounding barrier. Headline inflation was 0.2% q/q and 2.8% y/y, 1 tenth below our and consensus expectations. Weighing on headline was a 17.3% q/q fall in measured electricity prices due to the introduction of large rebates for households, and a 6.7% fall in fuel prices. The RBA has been clear they are looking for a sustainable return of inflation to target. We do not expect them to be distracted by temporary fluctuations in headline. 56% of the basket by weight continues to rise at over 3% annualised, little changed from last quarter.
Looking to the RBA next week, their near-term trimmed mean inflation forecasts will be little changed. While the strength in the September unemployment data may flow through to a modest downward revision to their Q4 2024 unemployment forecast of 4.3%, some downward revisions to their H2 2024 growth forecasts are likely to keep them comfortable in their outlook for ongoing gradual progress on inflation. We expect the messaging to remain similar to September, with the RBA comfortably on hold as they watch the data. NAB pencils in a first cut in February 2025, but expects only a gradual cutting cycle from the RBA.
Detail:
Services: Overall services inflation was broadly stable at 4.6% from 4.5% y/y. Looking at a subset of services closely watched by the RBA as in indicator of domestic demand pressure, market services inflation excluding travel and telco was 1.2% q/q and 5.2% y/y. Recent outcomes are a noticeable improvement from the pace through 2023, but there has been little recent sequential progress with the quarterly outcome. Restaurant meals has provided some good news, cooling to a benign 0.7% q/q and 2.8% y/y, but elsewhere market services continues to run hot. Insurance increases remain stubborn at 2.8% q/q and 14% y/y, while hairdressing, sports participation and recreation and cultural services all continue to run over 6% y/y despite recent slow growth in discretionary consumption.
Goods: Durable goods prices (outside of new dwellings) remain benign, with market goods prices outside of food, tobacco and new dwellings as -0.1% q/q and -0.2% y/y. Grocery price inflation continues to annualise above 2% y/y, above the 0.7% y/y pace that prevailed last time inflation was sustainably near target.
Rents grew 1.6% q/q and remain elevated at 6.7% y/y. Commonwealth Rent Assistance was raised by 10% on 20 September 2024. Rents inflation in the September month was just 0.1%, 4 tenths lower than without higher rent assistance, with more to flow through in October. Higher rent assistance will have a larger impact on Q4 data, and we estimate it will subtract 1ppt from quarter average rent inflation and 7bp from Q4 CPI. While underlying rents inflation is likely to remain elevated for the next year or so as average rents continue to adjust to higher new rents prices, timely indicators of new rents point to some relief on CPI rent inflation from late 2025.
New Dwelling construction drove much of the earlier progress on inflation. recent progress has been slower, and prices were up another 1% q/q to remain near 5% y/y as builders continue to pass on higher labour and building material costs. New dwelling prices can be volatile month to month, but August and September monthly increases, at just 0.1% m/m and -0.1% m/m raise the prospect of more noticeable cooling in Q4. Construction cost pressures are much hotter in Perth, up 3.9% q/q and 19.1% y/y, reflecting higher demand for new homes and input cost increases.
Electricity prices fell 17.3% q/q, a little more than the -15% we had pencilled in, on the back of state and federal rebates for households. Without rebates, electricity would have increased 0.7% q/q. Electricity alone subtracted 40bp from quarterly headline inflation on a seasonally adjusted basis. Electricity prices fell another 7.4% m/m in September as rebates continued to flow through to households in NSW and Victoria. That monthly profile sets up another sharp fall in electricity prices in Q4 of around 10% on a quarter average basis, worth about 2 tenths off headline CPI. Electricity subsidies add back to CPI gradually from Q1 2025, though most of the effect will be concentrated in Q3 2025. Some extension to rebates may well further delay that payback, and we expect the RBA will be inclined to largely look through the effect of the unwind on headline CPI, just as they will look through the subtraction on headline CPI now.
Chart 1: Headline and Trimmed Mean Inflation
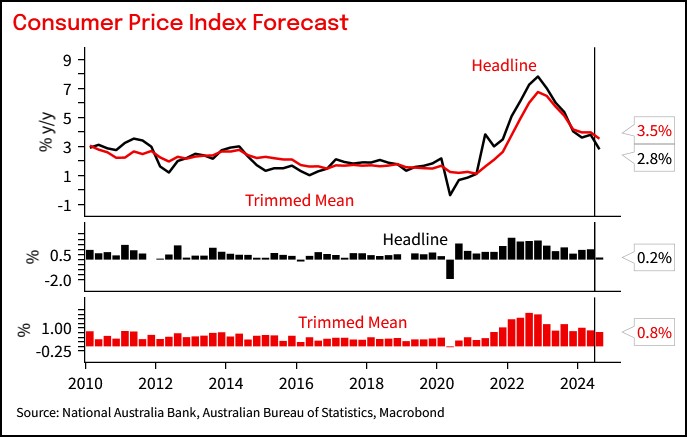
Chart 2: Contributions to CPI inflation
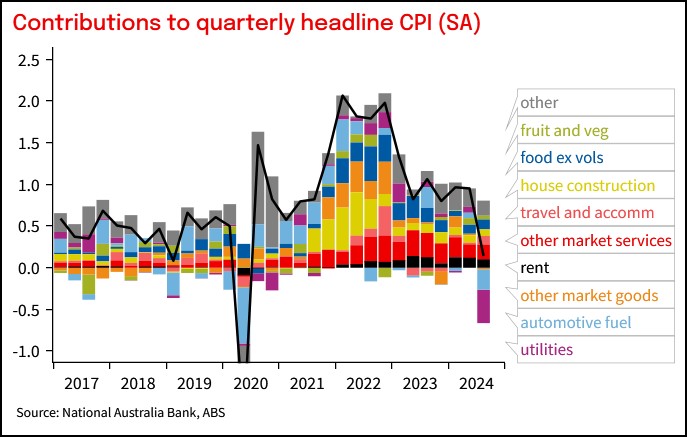
Table 1: CPI heat map. Shows 3-, 6- and 12m annualised outcomes. Shading reflects how far inflation is above or below a benchmark of the 6 years to 2015 when inflation averaged around the mid-point of the target
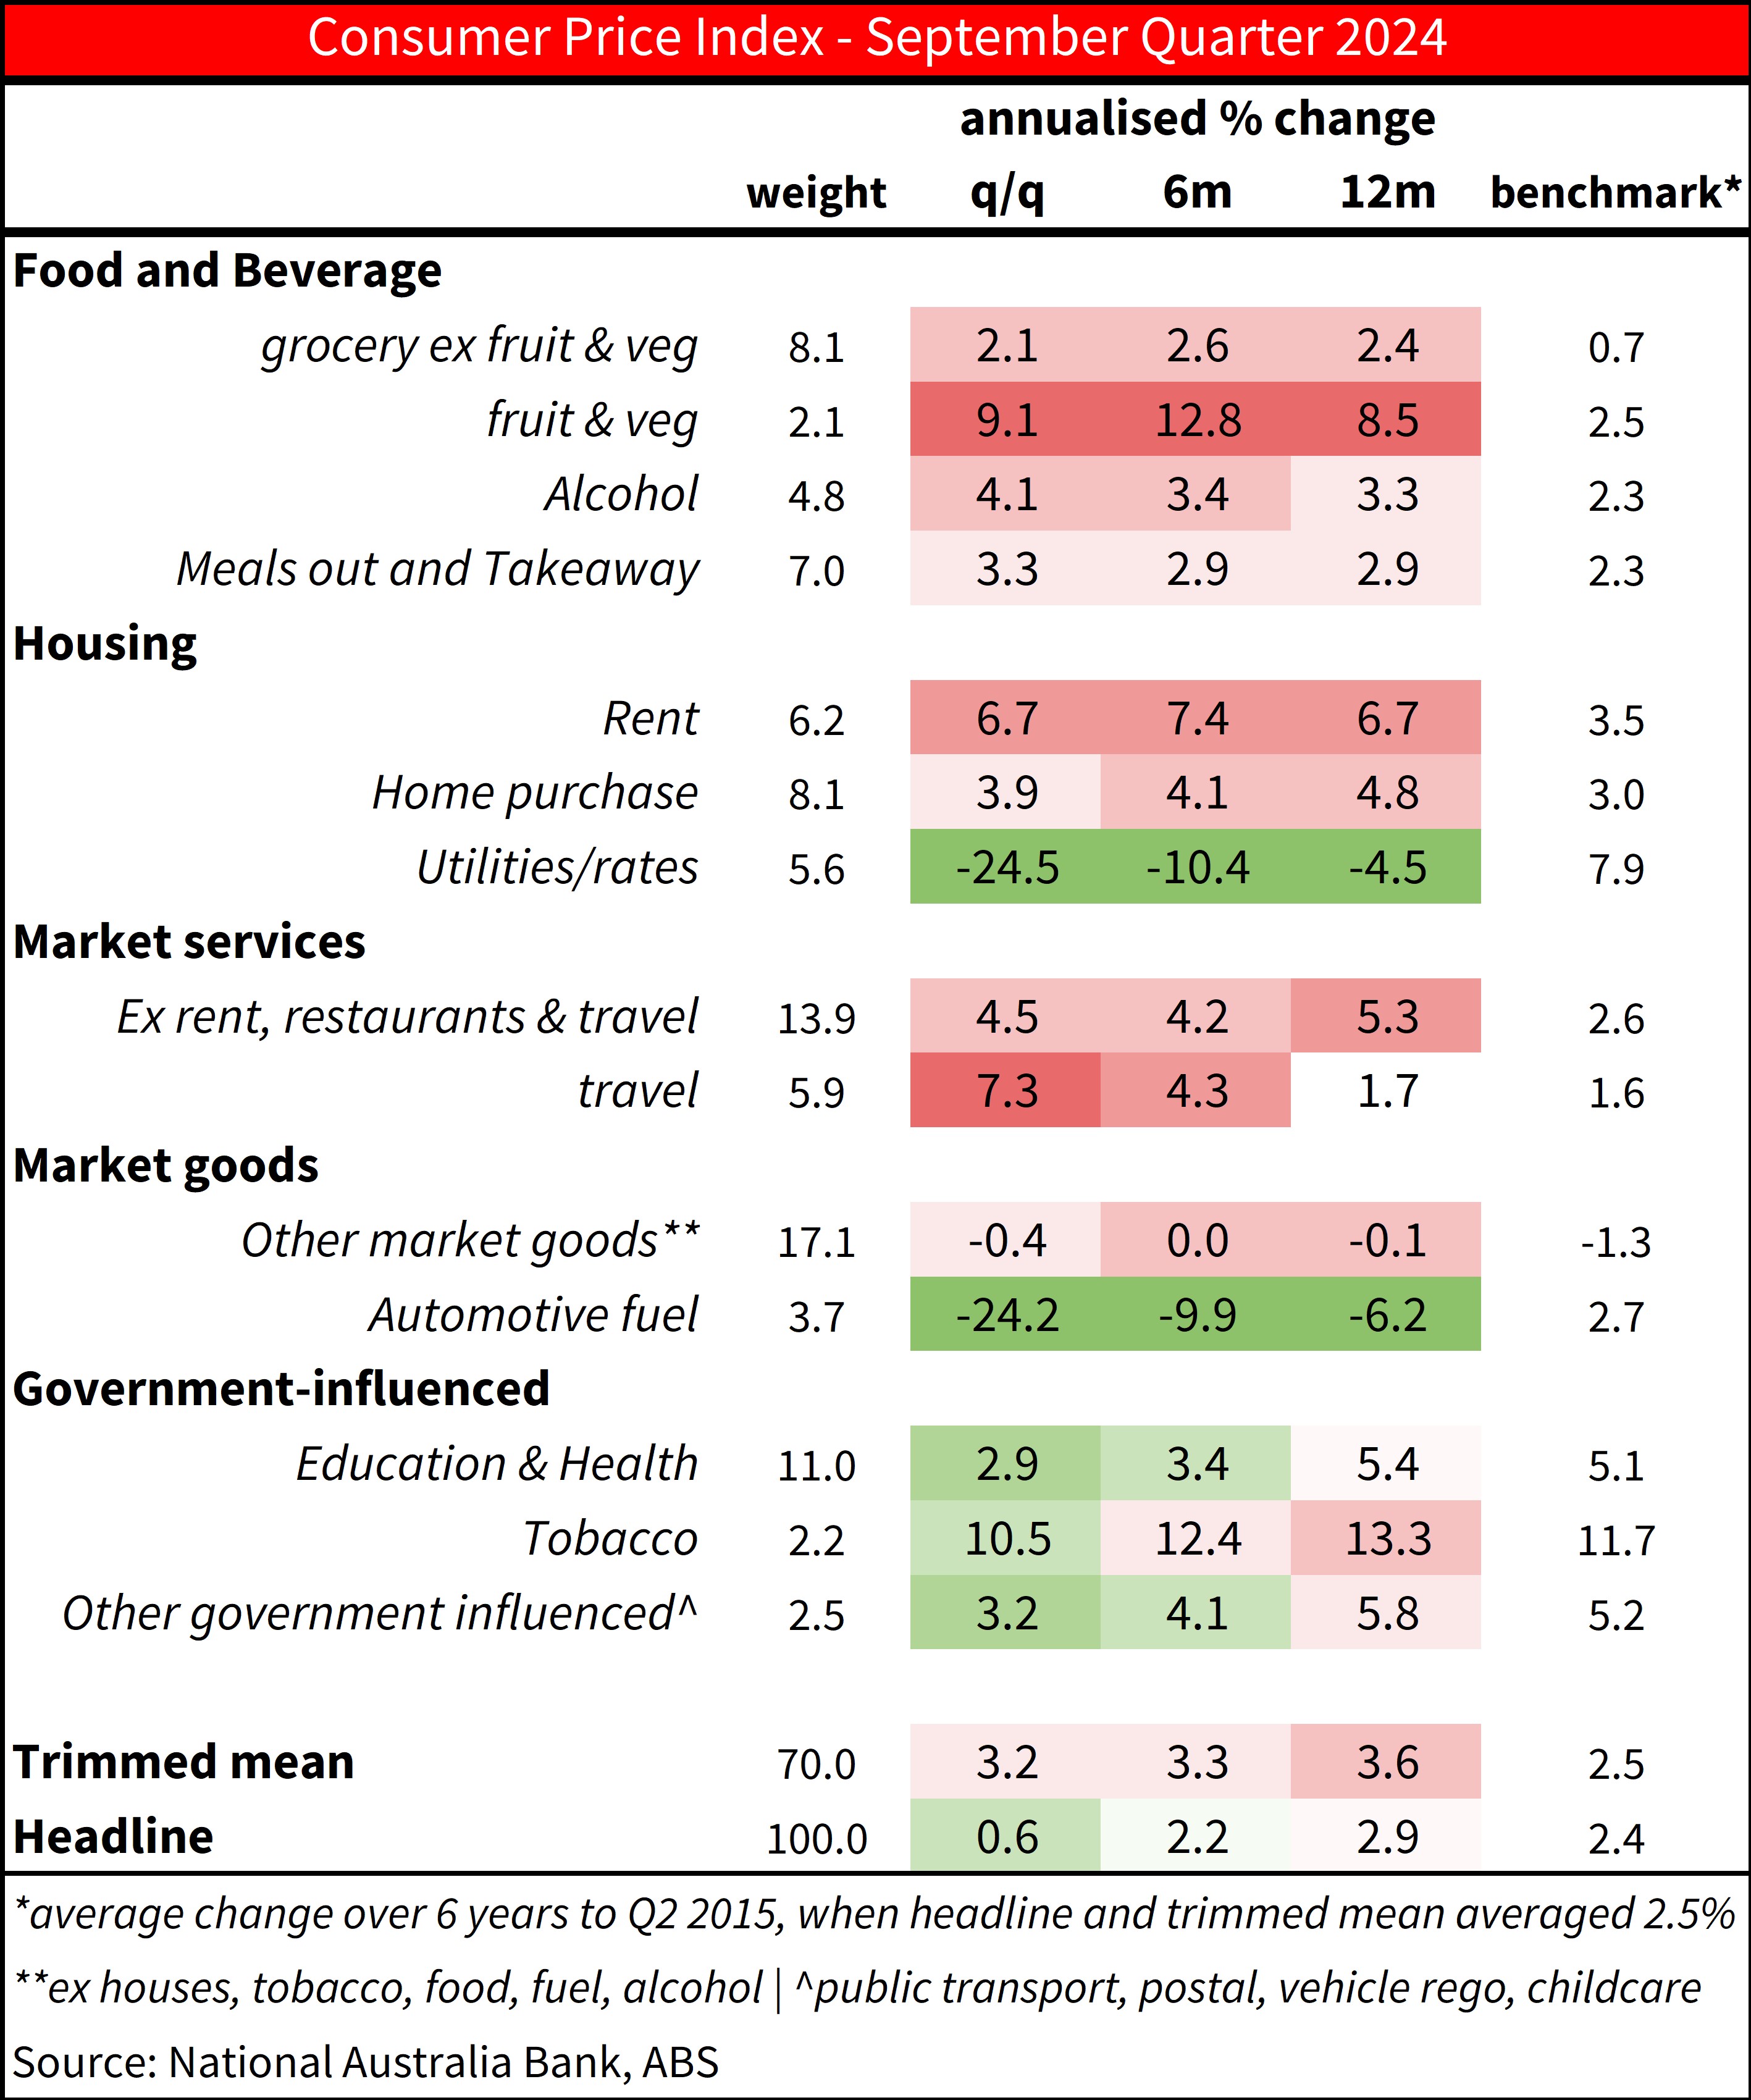
Chart 3: CPI and CPI excluding electricity
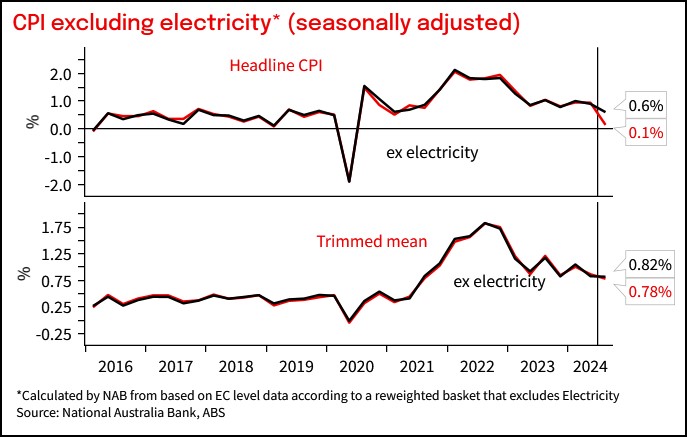
Chart 4: Progress on inflation across countries.
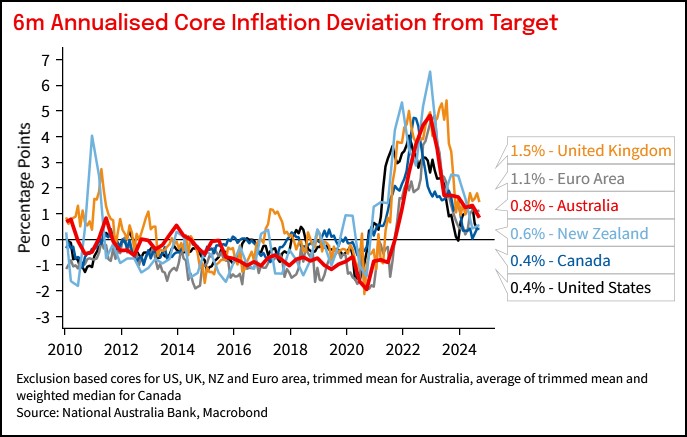
Chart 5: Tradable and non-tradable inflation.
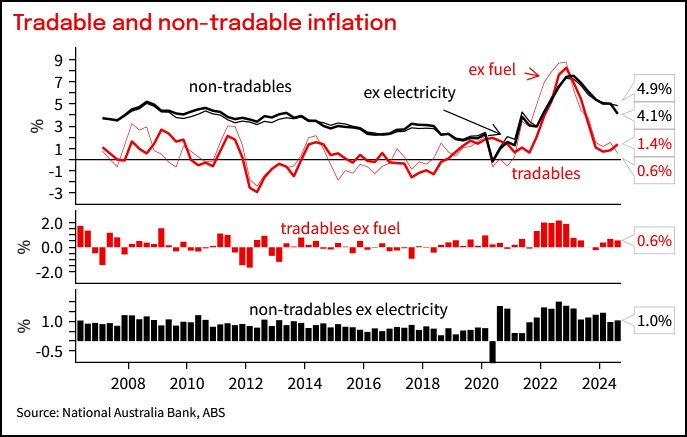
Chart 6: Market goods inflation
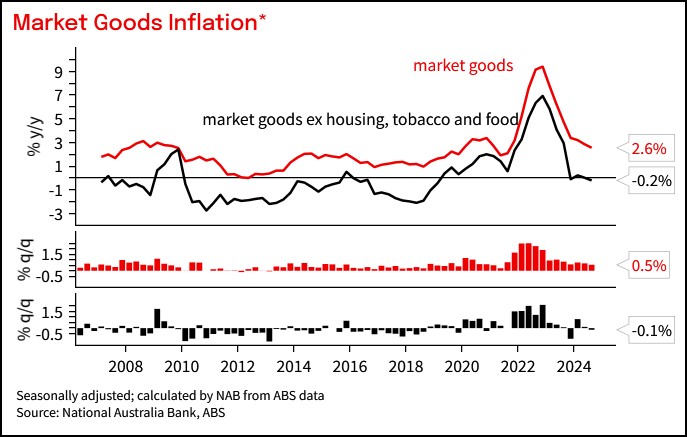
Chart 7: Market services inflation
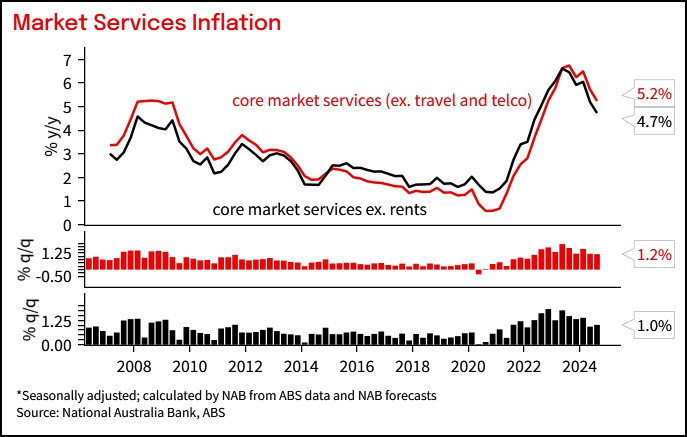
Chart 8: Inflation in parts of the basket historically sensitive to labour market conditions to moderate
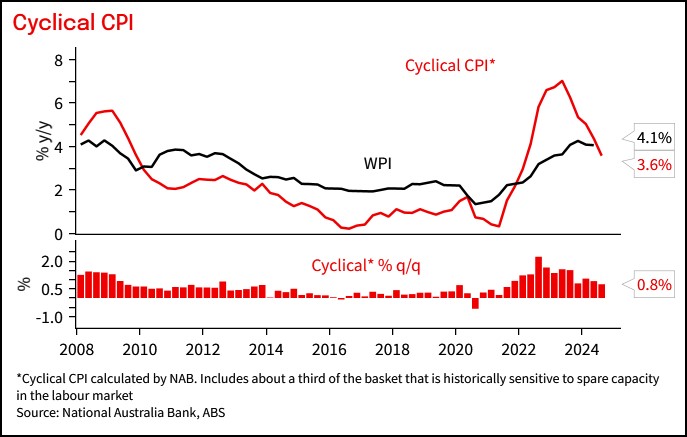
Chart 9: Share of basket with elevated annualised price increases |
Chart 10: Distribution of quarterly price changes
Chart 11: Distribution of price increases has shifted noticeably lower since the peaks in inflation
|
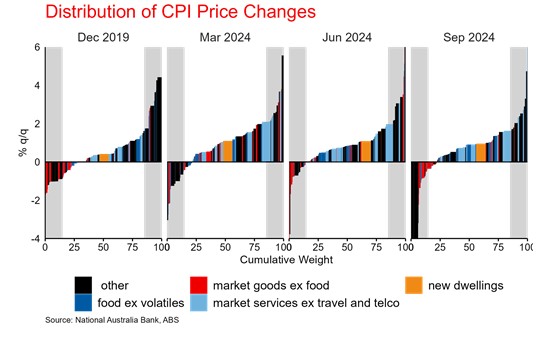
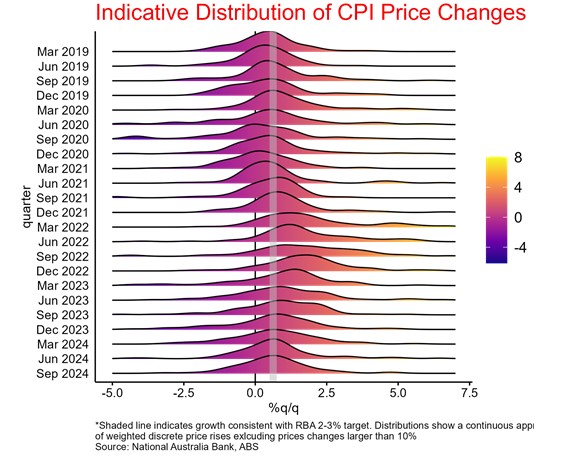
Table 2: Comparison to forecast
This document has been prepared by National Australia Bank Limited ABN 12 004 044 937 AFSL 230686 ("NAB"). Any advice contained in this document has been prepared without taking into account your objectives, financial situation or needs. Before acting on any advice in this document, NAB recommends that you consider whether the advice is appropriate for your circumstances. NAB recommends that you obtain and consider the relevant Product Disclosure Statement or other disclosure document, before making any decision about a product including whether to acquire or to continue to hold it. Please Click Here to view our disclaimer and terms of use. Please Click Here to view our NAB Financial Services Guide.
All prices and analysis at 30 October 2024. This information has been prepared by National Australia Bank Limited ABN 12 004 044 937 AFSL 230686 ("NAB").
The content is distributed by WealthHub Securities Limited (WSL) (ABN 83 089 718 249)(AFSL No. 230704). WSL is a Market Participant under the ASIC Market Integrity Rules and a wholly owned subsidiary of National Australia Bank Limited (ABN 12 004 044 937)(AFSL No. 230686) (NAB). NAB doesn’t guarantee its subsidiaries’ obligations or performance, or the products or services its subsidiaries offer. This material is intended to provide general advice only. It has been prepared without having regard to or taking into account any particular investor’s objectives, financial situation and/or needs. All investors should therefore consider the appropriateness of the advice, in light of their own objectives, financial situation and/or needs, before acting on the advice. Past performance is not a reliable indicator of future performance. Any comments, suggestions or views presented do not reflect the views of WSL and/or NAB. Subject to any terms implied by law and which cannot be excluded, neither WSL nor NAB shall be liable for any errors, omissions, defects or misrepresentations in the information or general advice including any third party sourced data (including by reasons of negligence, negligent misstatement or otherwise) or for any loss or damage (whether direct or indirect) suffered by persons who use or rely on the general advice or information. If any law prohibits the exclusion of such liability, WSL and NAB limit its liability to the re-supply of the information, provided that such limitation is permitted by law and is fair and reasonable. For more information, please click here.