What investors can do if we don’t get a soft landing
Isaac Poole | Oreana Financial Services
The market narrative is again coalescing around a soft landing for the US economy. The Fed has broadcast that it will begin cutting rates this year, possibly as soon as September. Parallels are being drawn to the 1995 soft landing when the Fed cut rates three times to prevent a softening economy from becoming something more painful.
But the US economy is already slowing and the risk is that the Fed will cut too little, too late. Investors can hope for a soft landing but should prepare for the risk that growth weakens materially in the medium term.
What does a soft landing look like?
In early 1994, the economy was near its third year of recovery after the 1990-91 recession. By Feb 1994, the unemployment rate was declining rapidly, down from 7.8% to 6.6%. CPI inflation was at 2.8%, and the federal funds rate was around 3%.
The Fed grew concerned about a potential pick-up of inflation and increased rates pre-emptively seven times, from 3% to 6%. Restrictive rates caused some softening in the economy. The Fed responded by cutting the federal funds rate three times in 1995 when it saw the economy softening. Fed Chair Alan Greenspan took a bow. The soft landing was achieved.
How does 1995 compare to recessions?
We’ve been watching three key indicators for clues on the outlook – the unemployment rate, the yield curve and the manufacturing PMI.
I’ve compared the 1995 soft landing to two recent recessions (2001 and 2007), and the current economic climate across these indicators. The key differences between the 1995 soft landing, the more painful episodes and now are discussed below.
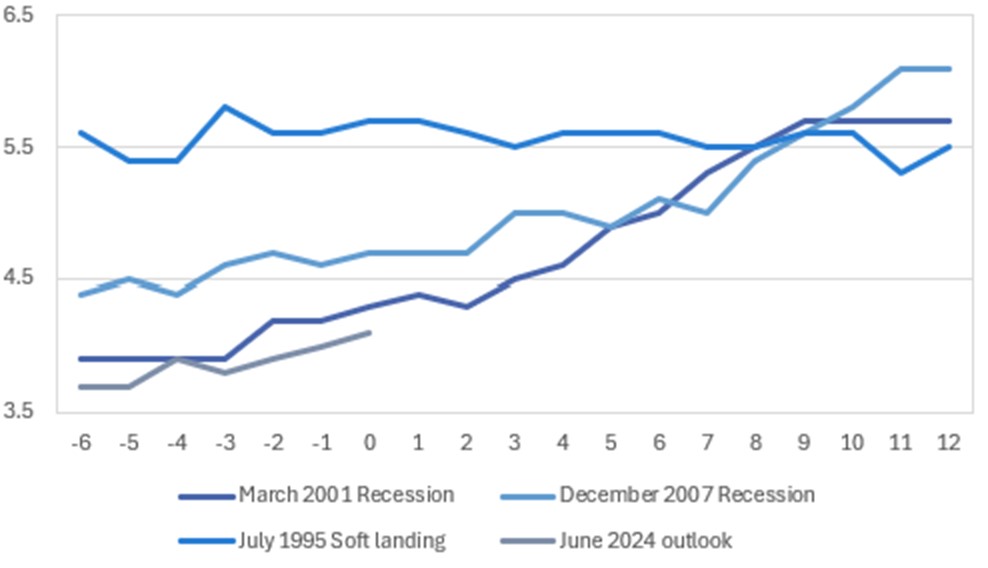
1) Unemployment: In the 1995 soft landing, the unemployment rate was high and trending lower as the economy recovered from the 1990-91 recession. In 1995, the unemployment rate jumped higher in April before continuing to trend lower before the Fed cut rates in July. This is very different to the experience in 2001 and 2007 when the unemployment rate was low and trending higher before the Fed cut rates. Right now, the unemployment rate looks more like 2001 than it did in 1995.
CHART 1: THE UNEMPLOYMENT RATE IS TRENDING HIGHER
 Source: Bloomberg LP, Ascalon Capital
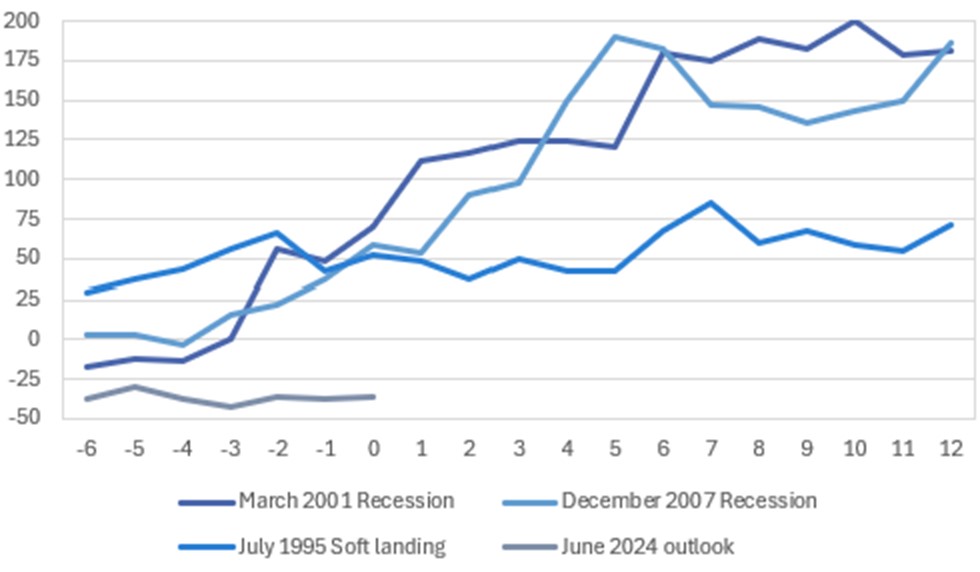
2) Yield curve: In both the 2001 and 2007 recessions, the US 2yr-10yr yield curve inverted before the recession. In 1995, the curve remained positive through 1994 and 1995 – and did not invert until before the 2001 recession years later. As of July 2024, the yield curve has been inverted for two years.
CHART 2: THE US YIELD CURVE IS DEEPLY NEGATIVE
 Source: Bloomberg LP, Ascalon Capital
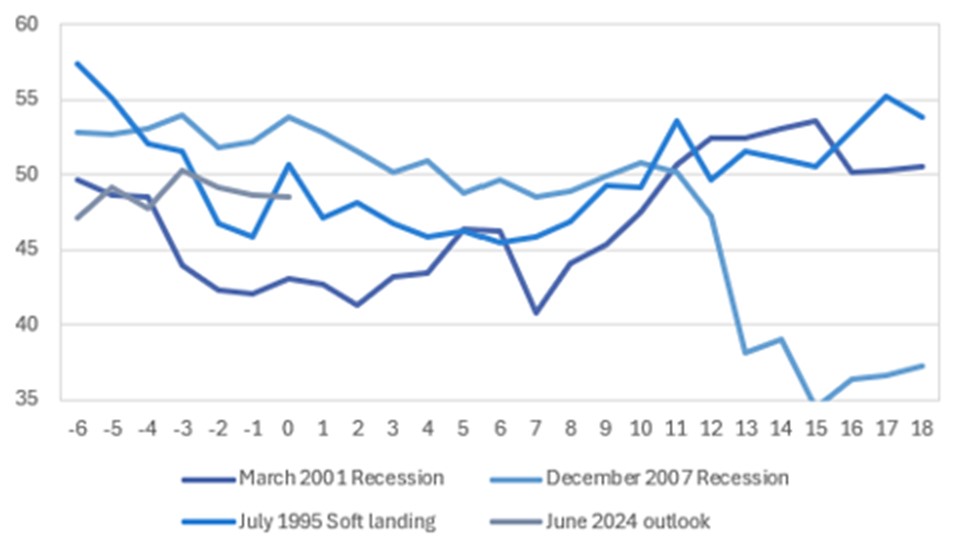
3) Manufacturing PMI: In the 2001 recession, the PMI fell below the 45 level, confirming a recession before the recession actually began. In 2007, the PMI didn’t fall below 45 until around 12 months after the NBER had called a recession. But, it fell much more sharply reflecting the depth of the Great Recession. In contrast, the PMI never fell below 45 in the soft landing. Right now, the PMI has been in the below-trend growth range (45-50) for 19 of the past 20 months but has not yet moved into recessionary territory.
CHART 3: THE MANUFACTURING PMI HAS NOT YET CONFIRMED A RECESSIONARY OUTLOOK
 Source: Bloomberg LP, Ascalon Capital
Equity markets are pricing a re-acceleration of growth
US equity markets are at or near record highs. Valuations look stretched by most metrics. It looks like markets are pricing in an immediate improvement in earnings growth to help justify valuations. But that will be challenging given the economy.
Rates are restrictive. The unemployment rate is trending higher. It is not clear that we will get a recession looking at the comparisons above. But growth is at best at trend and likely to slow to below in H2 2024. Even if we get a “soft landing”, it is unlikely to be accompanied by growth reaccelerating in the near term.
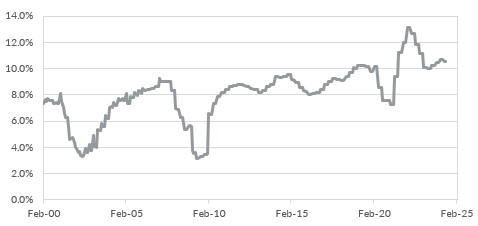
This is important because a soft landing is more likely to be characterised by reduced pricing power by most companies, as sales growth moderates further. Profit margins are likely to contract.
CHART 4: PROFIT MARGINS HAVE LIKELY PEAKED AND COULD MOVE LOWER IN THE NEAR TERM
Source: Bloomberg LP, Ascalon Capital
The combination will cause some slowing in earnings growth and that is going to be a challenge for record-high equity prices to digest.
How can diversified portfolios manage the risks?
Rate cuts are coming from the Fed, and the clear hope is that those cuts will immediately provide a boost to growth. I think rate cuts will come too late. Monetary policy works with a lag – both when policy is tightened and when it is eased. The full impact of the Fed’s hikes is yet to work through the economy. The Fed’s cuts will similarly take time. The reality is that we are late cycle, and we don’t need a recession to justify an equity pullback. Just a realignment of earnings growth expectations.
I think that having a modest underweight to international and Australian equities makes sense. It may be that if we do achieve a soft landing, the pullback will be shallow. For investors that genuinely believe in the soft landing, it may make sense to retain a full allocation to equities but adding some exposure to quality and value could provide some resilience.
In fixed income, credit has performed well recently. Lower quality credit has done particularly well. But there are signs of cracks appearing in the lowest quality and spreads are incredibly tight. A move up in quality including adding US Treasuries makes sense. Even for investors who are wedded to the soft landing narrative, I think moving to investment grade and reducing spread duration makes sense.
In short, it is prudent to be cautious. Investors who piled into risk in late 2022 have been rewarded – both in equities and fixed income. Now is the time to lock in some gains and build resilience in the portfolio.
Learn how the industry leaders are navigating today's market every morning at 6am. Access Livewire Markets Today.
All prices and analysis at 22 July 2024. This document was originally published in Livewire Markets on 22 July 2024. This information has been prepared by Oreana Financial Services (AFSL No: 482234, ABN 91 607 515 122). The content is distributed by WealthHub Securities Limited (WSL) (ABN 83 089 718 249)(AFSL No. 230704). WSL is a Market Participant under the ASIC Market Integrity Rules and a wholly owned subsidiary of National Australia Bank Limited (ABN 12 004 044 937)(AFSL No. 230686) (NAB). NAB doesn’t guarantee its subsidiaries’ obligations or performance, or the products or services its subsidiaries offer. This material is intended to provide general advice only. It has been prepared without having regard to or taking into account any particular investor’s objectives, financial situation and/or needs. All investors should therefore consider the appropriateness of the advice, in light of their own objectives, financial situation and/or needs, before acting on the advice. Past performance is not a reliable indicator of future performance. Any comments, suggestions or views presented do not reflect the views of WSL and/or NAB. Subject to any terms implied by law and which cannot be excluded, neither WSL nor NAB shall be liable for any errors, omissions, defects or misrepresentations in the information or general advice including any third party sourced data (including by reasons of negligence, negligent misstatement or otherwise) or for any loss or damage (whether direct or indirect) suffered by persons who use or rely on the general advice or information. If any law prohibits the exclusion of such liability, WSL and NAB limit its liability to the re-supply of the information, provided that such limitation is permitted by law and is fair and reasonable. For more information, please click here.