Security Alert: Scam Text Messages
We’re aware that some nabtrade clients have received text messages claiming to be from [nabtrade securities], asking them to click a link to remove restrictions on their nabtrade account. Please be aware this is likely a scam. Do not click on any links in these messages. nabtrade will never ask you to click on a link via a text message to verify or unlock your account.
Emerging market equities are ripe with opportunity
Shane Woldendorp | Orbis Investments
The term ‘Emerging Markets’ (EMs) first emerged (if you’ll excuse the pun) in the early 1980s, and it took several years for the MSCI Emerging Markets Index to be launched in 1988. The EM Index initially consisted of 10 markets and accounted for less than 1% of the global equity universe. Over time, countries have been added and removed from the index, and today the EM Index comprises 24 markets and represents over 10% of the global equity universe. Furthermore, EMs and developing economies contain around 85% of the world’s population and contribute roughly 60% of its GDP at purchasing power parity.
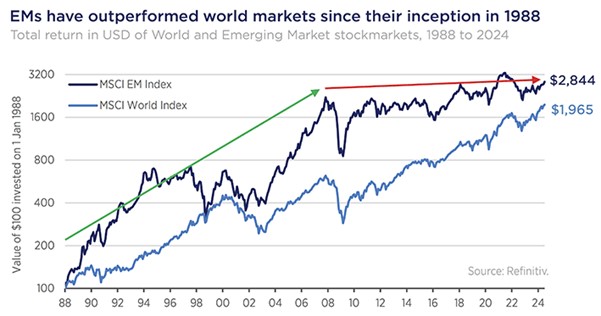
Since the inception of the EM Index, EMs have delivered on investor hopes and outperformed the MSCI World Index (which only represents developed markets), as shown in the following chart. This long-term relative outperformance may come as a surprise to many investors, given it’s been a tale of two halves as indicated by the green and red arrows. In the first 20 years, EMs beat the World Index by around 6.5% p.a. In the last 16 and a half years, however, much of that outperformance was given back with EMs lagging the World Index by over 5% p.a.

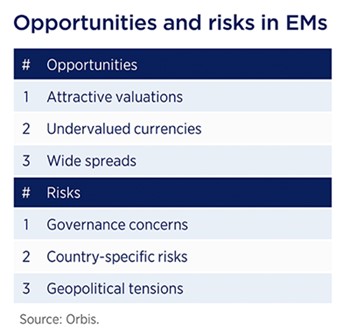
Disappointing recent returns have left many investors wondering whether EMs are worthy of their capital. To them, we have a simple answer: Yes. We think this is an unusually attractive time to invest in EMs, and the universe is ripe with opportunity for bottom-up stock pickers. But like any investment universe, EMs are not without risk. The table below presents three risks to keep in mind and three opportunities to get excited about. It is by no means exhaustive but makes for a good starting point. Let’s briefly discuss each.

Risks
In EMs, governance issues are rampant. At many private businesses, investors endure poor capital allocation, related party transactions, and heavy dilution as companies issue ever more shares. It’s all well and good to grow the profit pie quickly, but not when it’s cut into too many slices. China makes for an instructive example: the net profits of listed companies have grown by around 25% p.a. since the early 1990s, but that translated into per-share earnings growth of just 5% p.a., and disappointing equity returns. State-owned enterprises (SOEs) layer on additional governance risks, as their priorities are often not aligned with those of shareholders. Whilst the weight of SOEs in the EM Index has declined in recent years, they still account for a substantial chunk of the universe today. But EM companies are not all alike. Mindful of elevated governance issues, we have a strong preference to partner with owner-managed businesses. Managers who are themselves shareholders are often more aligned with our clients’ interests and tend to make better capital allocation decisions. Current examples in the portfolio include our longstanding positions in Jardine Matheson, NetEase and Kiwoom Securities.
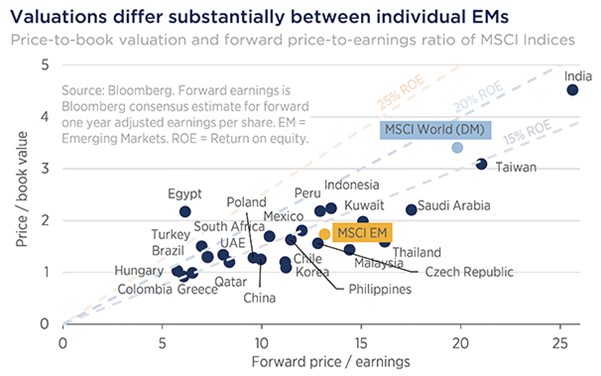
EM companies are not homogenous, and nor are EM countries—even if some investors treat them that way. In reality, every market is unique and presents different opportunities and risks. A quick glance at valuations confirms this, as shown in the following chart. For example, India appears very expensive on a variety of aggregate valuation metrics. Unsurprisingly, we are struggling to find many attractive ideas there, though with hundreds to choose from, we have found some, including HDFC Bank. Compared to India, China looks inexpensive—but it comes with very different risks, and commands a 25% weighting in the EM Index. Given the risk, that is higher than we are comfortable with, and as active investors, we can afford to be selective. We have found relatively more ideas in other countries.

China calls to mind another source of risk: geopolitics. In that, China is hardly alone—as we were painfully reminded in 2022 when we wrote our small position in Sberbank of Russia down to zero. Between military campaigns in the Middle East and presidential campaigns in America’s Mid-West, geopolitical uncertainty is high. We address that not by trying to guess what is in world leaders’ heads, but by focusing on companies and their prices. As bottom-up investors, we spend most of our time estimating what businesses are truly worth, and only buy shares that trade at a deep discount to our estimate of intrinsic value. This discount provides our first and most important line of defence against permanent losses. When we buy a stock, we also carefully manage the weights of our positions. But in some cases, no price is too low to guard against catastrophic events, and the right weight to have is none.
Opportunities
Those fearful factors are well known, but they are only half the story. Over the long-term, the price you pay for an asset is one of the most important drivers of future returns. After years of disappointing returns in EMs, many investors have headed for the exits, and it remains an under-owned asset class. The good news is that this has translated into substantially lower valuations versus stocks in the developed world. Consider the cyclically adjusted price-to-earnings (CAPE) ratio, a well-established barometer for the expensiveness of a market, and a reasonable indicator of long-term real returns. In aggregate, EMs trade at a CAPE ratio of around 12 times, which is low versus its own history, and low compared to about 20 times for world markets. EMs are also discounted versus world markets on conventional price-to-earnings, price-to-book, and price-to-free cash flow measures—to name just a few.
And it’s not just the stocks that look cheap. EM currencies trade at deep discounts to their valuations on a purchasing power parity basis. An equally-weighted basket of the largest EM currencies, such as the Chinese yuan, Taiwan dollar and Korean won, is as cheap as it’s been since the early 2000s—trading at around a 20% discount to the US dollar. Historically, much of the volatility experienced in EMs has been due to currency fluctuations. But given many EM currencies already appear cheap today, there is a lower-than-average risk of a nasty currency shock. Indeed, what has been a headwind for EMs could be a tailwind going forward.
Lastly, the gap in valuations between cheap and expensive shares within EMs is unusually wide relative to history, as we discussed in December. Apart from the extremes of the last few years, the only time this valuation gap has been wider was during the Asian Financial Crisis in the late 1990s—arguably a once-in-a-lifetime buying opportunity. In our view, the opportunity for stock picking to add idiosyncratic value looks unusually good today.
We continue to believe it’s an exciting time for EMs. Whilst recent performance has been disappointing for EM investors, it has provided a great setup today for long-term returns: attractive valuations, undervalued currencies, and wide spreads between cheap and expensive stocks. We think our bottom-up approach is well placed to navigate the risks and capitalise on the opportunities.
Shane Woldendorp is an Investment Counsellor at Orbis Investments, a sponsor of Firstlinks.
First published on the Firstlinks Newsletter. A free subscription for nabtrade clients is available here.
All prices and analysis at 10 July 2024. This document was originally published on firstlinks.com.au on 10 July and has been prepared by Orbis Investments, offered by Equity Trustees Limited, ABN 46 004 031 298, AFSL 240975 . The content is distributed by WealthHub Securities Limited (WSL) (ABN 83 089 718 249)(AFSL No. 230704). WSL is a Market Participant under the ASIC Market Integrity Rules and a wholly owned subsidiary of National Australia Bank Limited (ABN 12 004 044 937)(AFSL No. 230686) (NAB). NAB doesn’t guarantee its subsidiaries’ obligations or performance, or the products or services its subsidiaries offer. This material is intended to provide general advice only. It has been prepared without having regard to or taking into account any particular investor’s objectives, financial situation and/or needs. All investors should therefore consider the appropriateness of the advice, in light of their own objectives, financial situation and/or needs, before acting on the advice. Past performance is not a reliable indicator of future performance. Any comments, suggestions or views presented do not reflect the views of WSL and/or NAB. Subject to any terms implied by law and which cannot be excluded, neither WSL nor NAB shall be liable for any errors, omissions, defects or misrepresentations in the information or general advice including any third party sourced data (including by reasons of negligence, negligent misstatement or otherwise) or for any loss or damage (whether direct or indirect) suffered by persons who use or rely on the general advice or information. If any law prohibits the exclusion of such liability, WSL and NAB limit its liability to the re-supply of the information, provided that such limitation is permitted by law and is fair and reasonable. For more information, please click here.
