Taylor Nugent | Markest Research
Key points:
- Today’s CPI data was better than feared
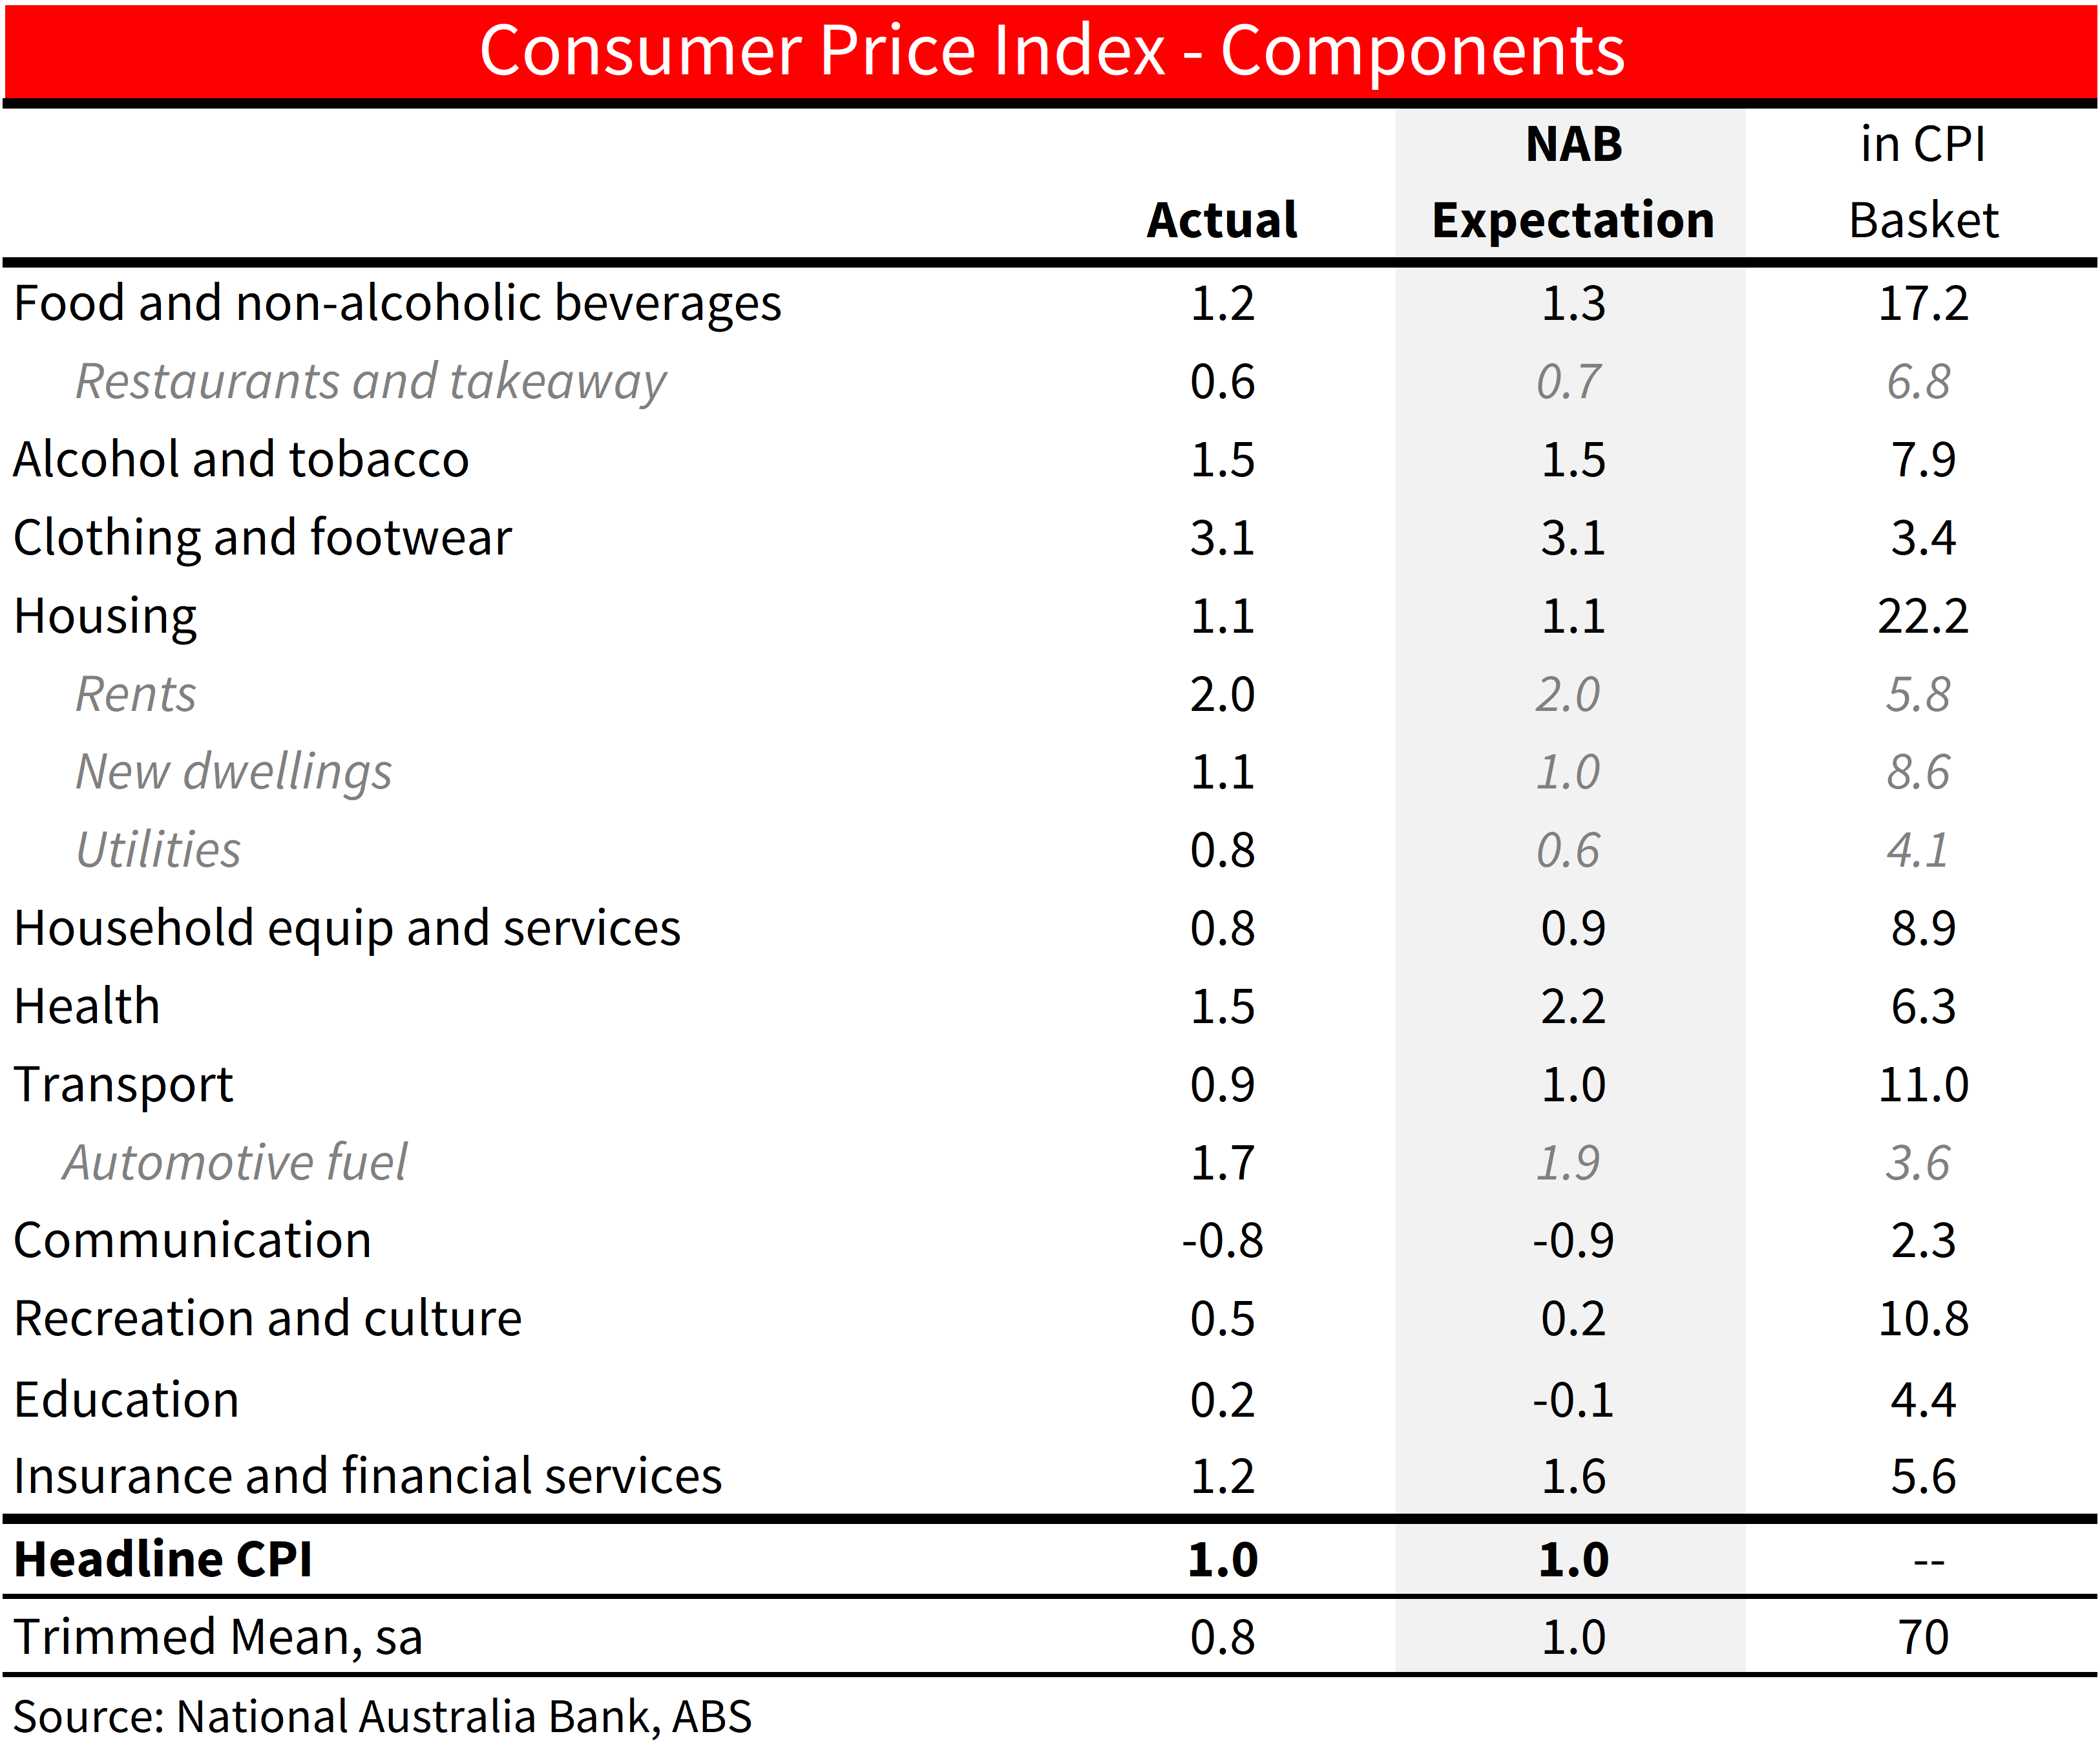
- Headline was in line with expectations at 1.0% q/q (NAB and consensus 1.0), but trimmed mean was 0.8% q/q, better than our and consensus forecast for 1.0
- Rounding and seasonal adjustment revisions help explain some of the discrepancy
- Trimmed mean at 3.9% y/y is still 1 tenth above the RBA’s May forecast and 3 tenths above their February forecast
- The surprise relative to our forecasts came from some payback after strong health inflation in Q1, and from more than expected moderation in other financial services inflation
- The Q2 data confirmed progress on market services and domestically sensitive prices
- NAB’s view remains that the RBA will stay on hold. today;s outcome largfely removes the risk the RBA will hike in August, but the conditions for a cut remain a long way off.
Detail:
Today’s data is good news. But it is good news relative to expectations for much-too-strong inflation. Trimmed mean CPI at 3.9% y/y is still a tenth higher than the RBA expected back in May, and 3 tenths higher than they forecast in February. In 6-month annualised terms, trimmed mean inflation is running at 3.8%, headline inflation is even stronger at 4.0% in 6 month annualised terms. The share of the basket running above 2.5% annualised was stable at around 65%, though the share above 3% did improve more noticeably.
Headline inflation was in line with our forecast at 1.0% q/q, but trimmed mean was noticeably better than we and the consensus feared at 0.8% q/q. The miss relative to our expectation was in medical and hospital services and other financial services. Without seeking to downplay the good news in today’s print, it is worth noting that the Q2 trimmed mean was 0.84% q/q unrounded, and the Q1 outcome was revised higher to 1.04% from 1.01% on seasonal adjustment updates.
We noted in our preview that stubborn inflation in Q2 was likely to be in spite of evident progress on the market sensitive domestic prices the RBA has been focussed on as an indicator of domestic inflation pressures and progress reducing excess demand. That progress was confirmed in today’s data. Market services prices excluding travel and telco moderated to 1.1% q/q, and further excluding persistent rents, slowed to 0.8% q/q, their lowest in 3 years.
No matter which way you cut it, the RBA will see in the detail here ongoing signs that inflation in those parts of the basket most sensitive to domestic demand conditions and most exposed to domestic cost pressures are at the very least not reaccelerating and more likely heading in the right direction. That’s despite stubbornness in a couple of key categories (rents, house construction and insurance). Subsets of the basket least exposed to trade or most exposed to domestic labour market conditions also moderated from Q1. And inflation in those parts of the basket that tend to be least persistent were much stronger in H1 2024 than they were last year.
All of that together means there should be little if any upward pressure on the RBA’s 2026 inflation forecasts on the back of this data. Our CPI heatmap (Table 1) shows that those areas most elevated relative to last time inflation was around target for a sustained period are volatile components like fuel, travel and fresh food, or inertial components like rents, not components that the RBA should take too much signal from as at assesses progress returning demand and supply to a more balanced setting.
We expect the RBA will continue to be able to forecast inflation around the midpoint of the target by 2026 and is likely to temper some of the discussion of upside risk to the inflation outlook evident in June. That all but removes the risk the RBA feels compelled to hike further, but even as today’s data was better than feared, inflation remains too high, and has shown less progress than the RBA had been expecting. The conditions for a cut remain a long way off. Evident progress in parts of the basket sensitive to domestic demand are welcome, but the worst of the real income squeeze is behind us and the labour market, while gradually cooling, remains resilient. NAB’s view remains for the RBA to be on hold through 2024, with a first cut pencilled in for May 2025.
Detail:
Services: Overall services inflation picked up from 4.3% to 4.5% but masked a more positive underlying story. Health inflation was better than feared, and medical and hospital services (outside of health insurance) surprised with a fall Q2 after driving much of the upside surprise in Q1, but the expected realignment of health insurance price increases to normal April timing helped health inflation lift to 5.7% from 4.1%. Elsewhere, travel and accommodation costs were exceptionally strong in the quarter, adding 2 tenths to seasonally adjusted quarterly CPI as falls in year-ended travel prices slowed from -3.9% y/y to -1.0% y/y. Health prices are government-influenced and so excluded from ‘market services’ while travel prices tend to be volatile and not persistent.
Looking at market services excluding travel the story is more encouraging. Restaurants, hairdressing and a range of personal and financial services showed improvement in Q2, with market services ex travel and rents up 0.8% q/q (NAB +1.0% q/q) recording its lowest increase in 3 years. Even more improvement on other financial services than we pencilled in drove the surprise relative to our forecast. The RBA’s concern has been that poor productivity and elevated unit labour costs growth would drive persistence in market services inflation. As we outlined in Thematic – The RBA’s productivity red herring, industries upstream from market consumer prices have not been the driver of poor productivity outcomes, and some cooling in market services inflation was possible even ahead of more material slowing in base wages growth. More flexible services prices are showing encouraging signs of cooling, with strength driven by the still elevated and persistent rents and insurance categories.
Goods: Quarter-to-quarter volatility continues in goods, and a core measure of market goods that includes largely trade-exposed durable goods was close to flat in Q2 after volatility in the past couple of quarters. Market goods inflation excluding houses, tobacco and food was up 0.1% q/q (NAB +0.2% q/q) and 0.0% y/y.
Housing (+1.1% q/q (NAB +1.1% q/q):
- Rents growth remains elevated 2.0% q/q. Looking forward, while vacancy rates remain low and rents growth elevated, there has been some tentative slowing in some measures of advertised rents in the last couple of months. With the population growth likely past its peak, frictional pressure on rental market as they absorbed the acute rebuild of the temporary visa holder populations may be starting to fade and we will be looking closely for broadening evidence of deceleration in coming months. Regardless, it takes time for average rents paid to catch up to dynamics in new rents, and there is little scope for meaningful CPI rents relief until late 2025.
- New Dwelling construction drove much of the earlier progress on inflation, but progress has stalled as builders continue to pass on higher labour and building material costs. It rose 1.0% q/q with price pressures strongest in Perth and Adelaide. This is the largest single component. At its current pace it is adding around 4 tenths to annual CPI, more than double prepandemic contribution, but compared to almost 2ppt at its peak.
- Electricity prices rose 2.1% q/q as expected after the earlier unwind of some subsidies, but was flat in the month. Broader subsidies continued to subtract 7% from the electricity price level in June. Those will unwind in July but be replaced by new, larger, federal and State subsidies. On our estimates, the net effect is a 24% fall in electricity prices in July and a 0.5ppt subtraction from Q3 CPI (see chart 9)
Food: Food inflation continued to moderate from earlier peaks on a year-ended basis, with y/y inflation across food and non-alcoholic beverages slowing to 3.3% y/y in Q2 (NAB 3.4% y/y). Much of that improvement was helped by slower takeaway and restaurant inflation, up 0.6% q/q and 4.2% y/y and well off the peak of 7.7% in Q2 2023. In contrast, there was some reacceleration in grocery inflation on a quarterly basis, even outside the surge in fruit prices, led by meat and fish. Fruit prices were some 10.6% q/q higher and fruit and veg prices together added 7bp to headline CPI
Chart 1: Headline and Trimmed Mean Inflation
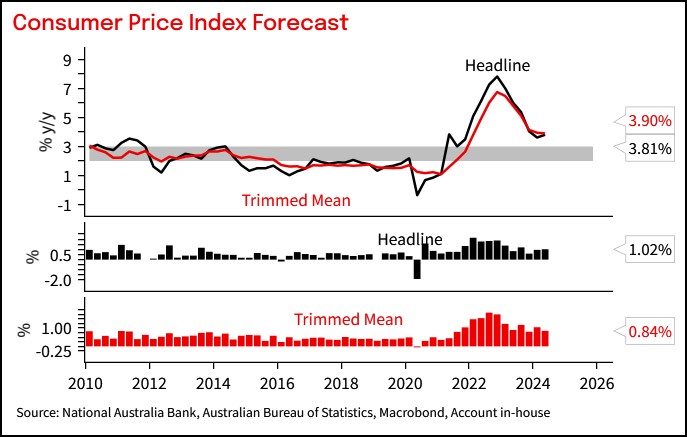
Chart 2: Contributions to CPI inflation
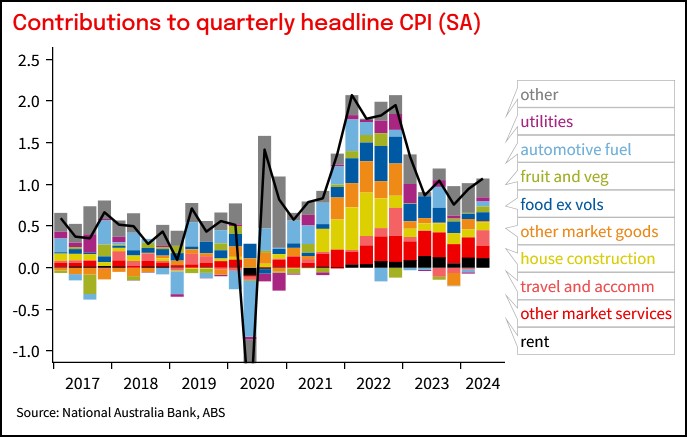
Table 1: CPI heat map. Shows 3-, 6- and 12m annualised outcomes. Shading reflects how far inflation is above or below a benchmark of the 6 years to 2015 when inflation averaged around the mid-point of the target
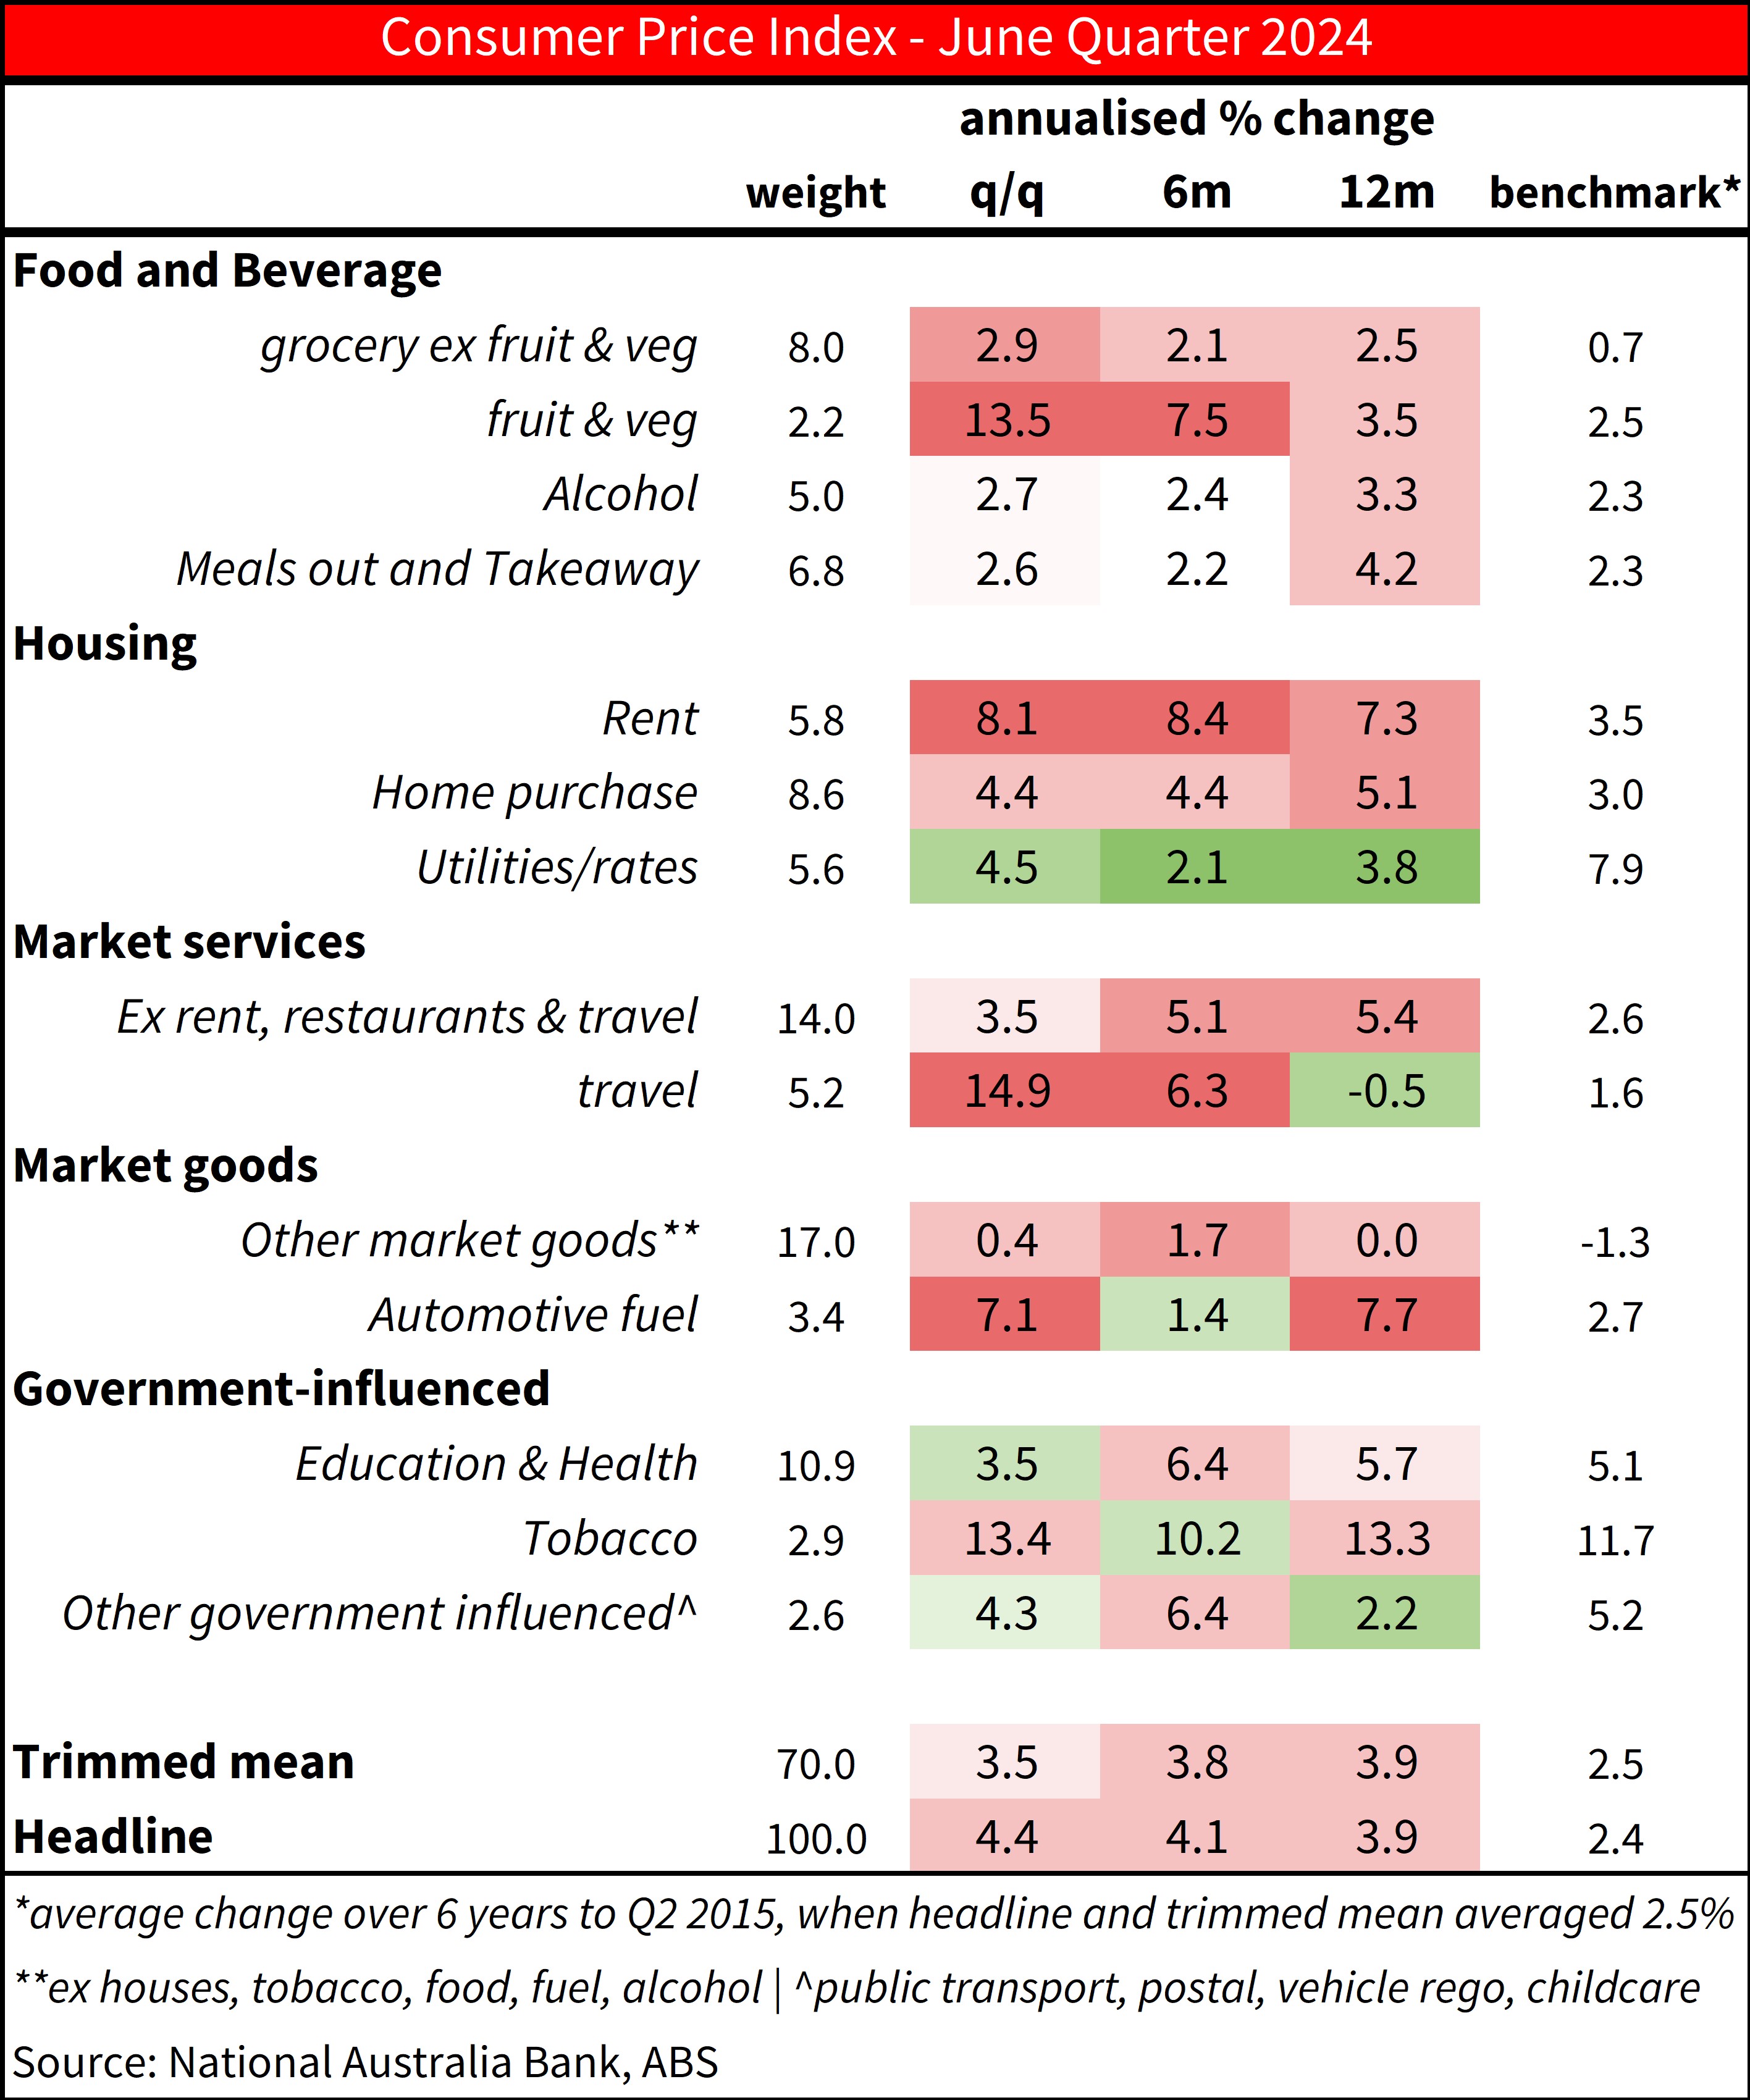
Chart 3: Core inflation across countries.
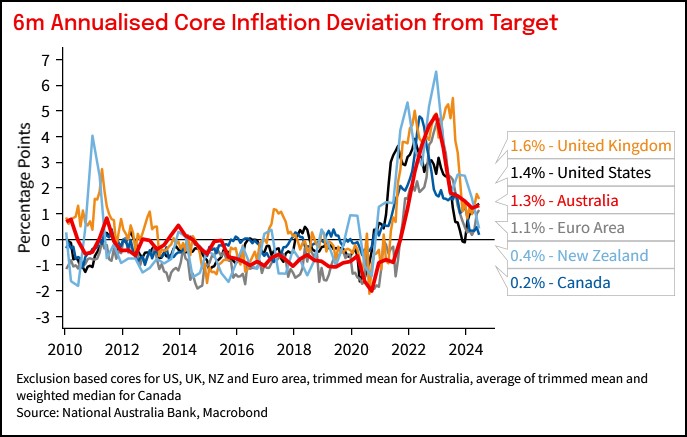
Chart 4: Tradable and non-tradable inflation.
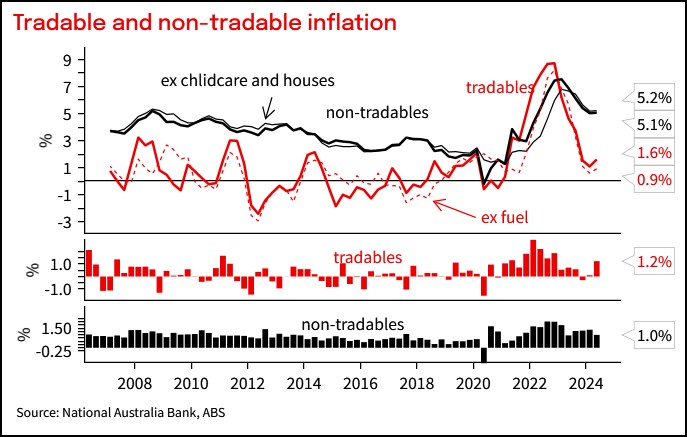
Chart 5: Market goods inflation
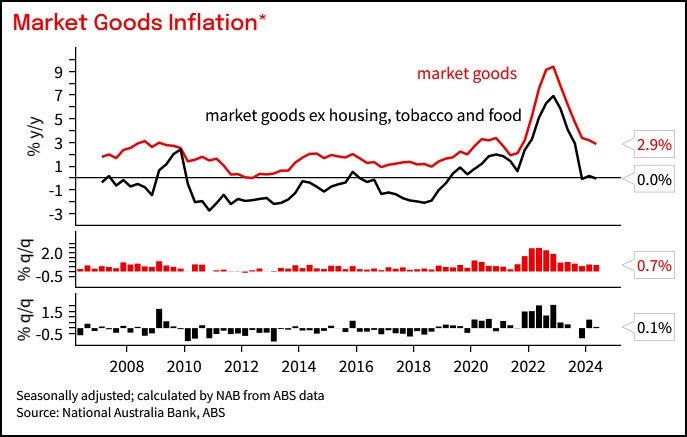
Chart 6: Market services inflation
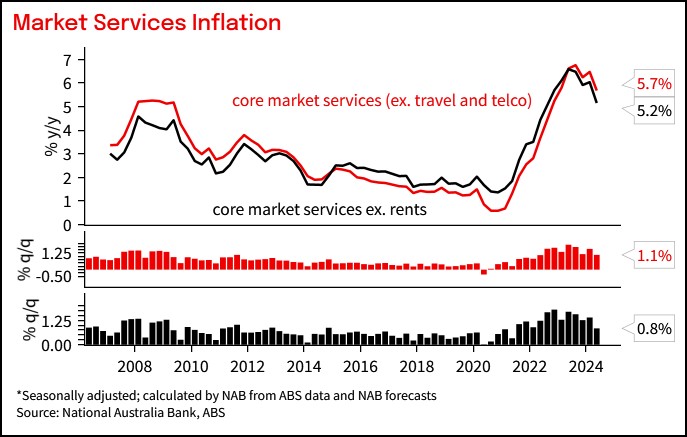
Chart 7: Inflation in labour market sensitive parts of the basket
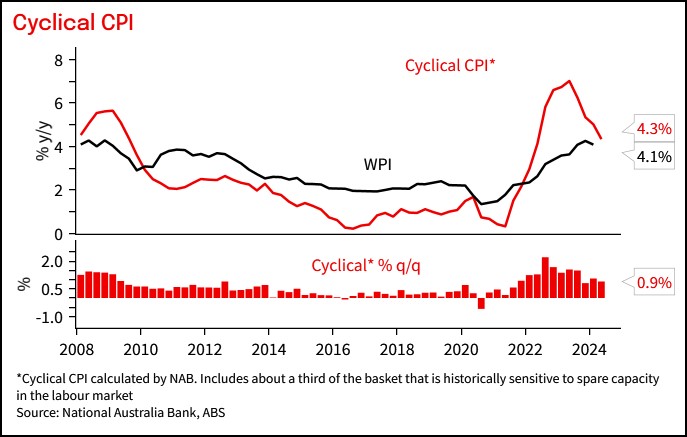
Chart 8: Inflation by persistence
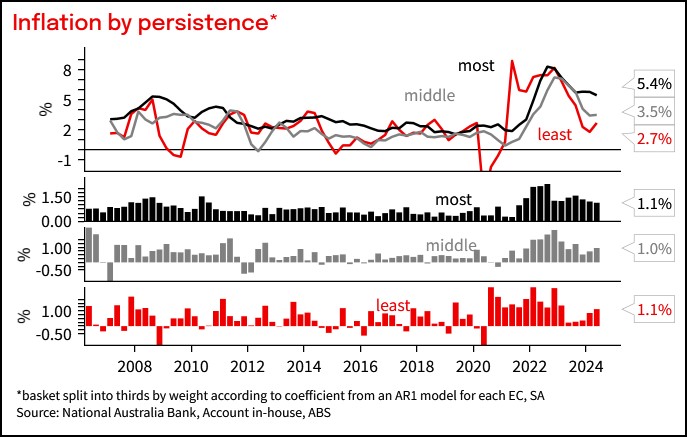
Chart 9: Share of basket with elevated annualised price increases
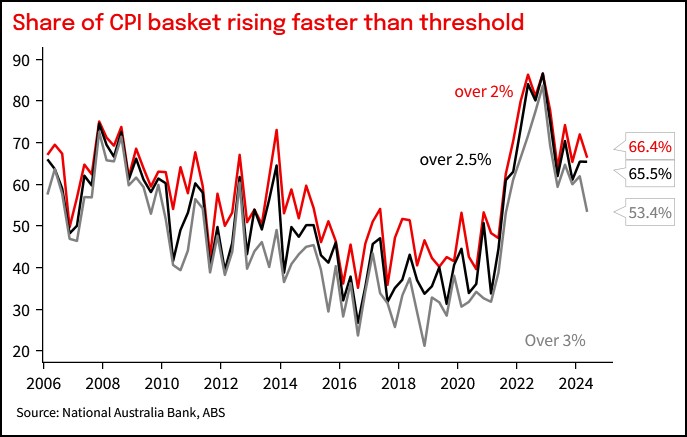
Chart 10: Electricity rebates to subtract a net 0.5ppt from Q3 CPI
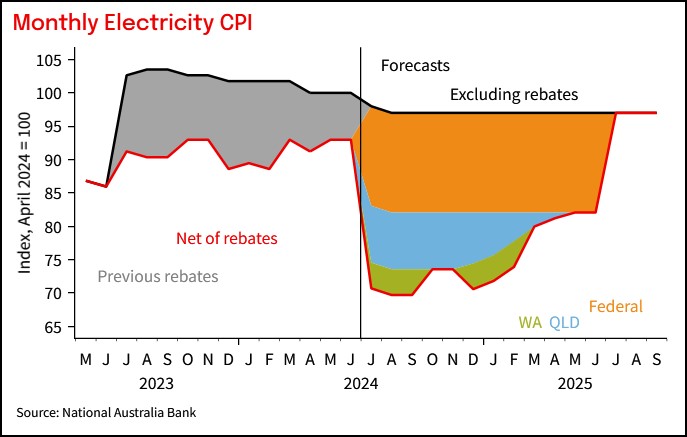
Chart 11: Distribution of quarterly price changes
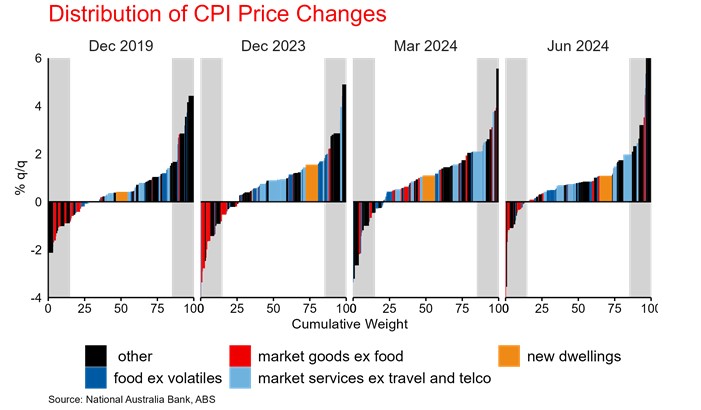
Table 2: Comparison to forecast
All prices and analysis at 31 July 2024. This information has been prepared by National Australia Bank Limited ABN 12 004 044 937 AFSL 230686 ("NAB"). The content is distributed by WealthHub Securities Limited (WSL) (ABN 83 089 718 249)(AFSL No. 230704). WSL is a Market Participant under the ASIC Market Integrity Rules and a wholly owned subsidiary of National Australia Bank Limited (ABN 12 004 044 937)(AFSL No. 230686) (NAB). NAB doesn’t guarantee its subsidiaries’ obligations or performance, or the products or services its subsidiaries offer. This material is intended to provide general advice only. It has been prepared without having regard to or taking into account any particular investor’s objectives, financial situation and/or needs. All investors should therefore consider the appropriateness of the advice, in light of their own objectives, financial situation and/or needs, before acting on the advice. Past performance is not a reliable indicator of future performance. Any comments, suggestions or views presented do not reflect the views of WSL and/or NAB. Subject to any terms implied by law and which cannot be excluded, neither WSL nor NAB shall be liable for any errors, omissions, defects or misrepresentations in the information or general advice including any third party sourced data (including by reasons of negligence, negligent misstatement or otherwise) or for any loss or damage (whether direct or indirect) suffered by persons who use or rely on the general advice or information. If any law prohibits the exclusion of such liability, WSL and NAB limit its liability to the re-supply of the information, provided that such limitation is permitted by law and is fair and reasonable. For more information, please click here.
| 


