Small caps v large caps: Don’t be penny wise but pound foolish
Andrew Mitchell | Ophir Asset Management
Let's examine three key issues:
- What could the catalyst be for a period of sustained small-cap outperformance?
- The worst-case scenario of a U.S. recession. (The good news is that this scenario is largely priced into small caps, which will limit small-cap downside if the U.S. economy turns south.)
- The extreme valuation difference between U.S. small versus large caps and how history is suggesting great relative returns ahead for smaller companies.
When you put all three together, it becomes clear that small-cap stocks are an attractive proposition, which is giving investors a rare window of opportunity to buy into small caps now.
What could be the catalyst for small cap outperformance?
The most common question we get from investors who understand why we are so bullish on the outlook for small caps globally versus large caps is: “What is the catalyst for smalls caps to start outperforming?”
Relative valuations at multi-decade lows for small caps (which we address later) is one big reason to be bullish over the next 5-10 years.
But cheap relative valuation is not a catalyst. The standout and most simple catalyst we believe is simply lower interest rates. And, more specifically, ‘soft landing’ rate cuts.
December last year was a great case in point. It was the only sustained period of significant market breadth and small-cap outperformance since the beginning of this most recent share market rally in October.
We show this in the chart below which maps the relative performance of U.S. small caps (Russell 2000) to large caps (S&P500).
Chart 1: December 2023 showed market breadth and smalls outperformed on “peak rates/cuts ahead” talk from the Fed
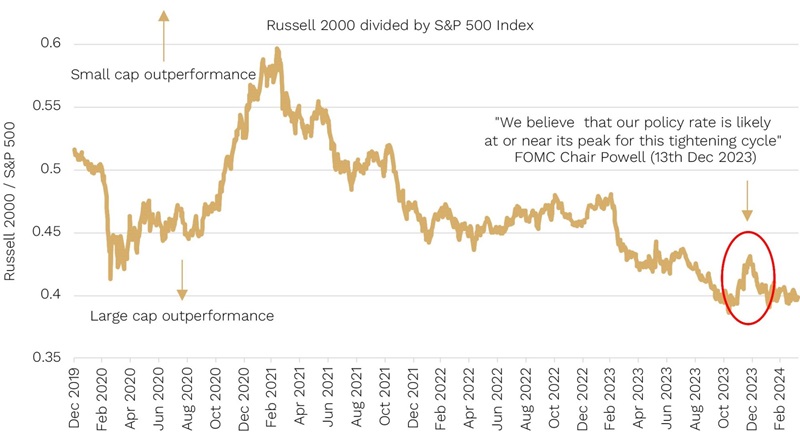
Source: Bloomberg
So, what happened in December?
It was when the U.S. Fed said for the first time this hiking cycle that they are likely done increasing rates, and when they predicted in their ‘dot plot’ that meaningful rate cuts where likely in 2024. The starters gun for rate hikes that was shot back in late 2021 had seemingly been holstered.
The closer we get to the expectation of soft-landing rate cuts becoming a reality (currently forecast by the market in Q3 or Q4 this year), the closer we may be to small caps having a key catalyst for outperformance. The natural question then becomes: what if we don’t have a soft landing and US recession fears, which have been lingering for the last 12-18 months, finally becomes a reality?
Small caps’ already big underperformance suggests limited relative downside in a recession
It’s an excellent question because around a recession, small caps typically fall first and further than large caps … but then recover the quickest.
We show this in the gold bars below where, outside of the Eurozone, share markets across all the major regions, including Australia, all highlight biggest peak to trough share market falls in small caps compared to large caps around U.S. recessions.
(The reason small caps don’t underperform in the Eurozone is largely a data limitation. Small-cap data for the Eurozone is only available for the last three U.S. recessions (2001, 2008 and 2020). And one of those – the 2001 dot com related recession – was unusual, with large caps falling more than smalls due to the nature of the related tech bubble – heavily influencing the Eurozone result.)
In the black bars, what we have also shown is the maximum peak-to-trough underperformance around U.S. recessions across all the regions. This has varied from as low as -6% in Japan, to as high as -20% in Australia – both during the 2020 COVID-induced recession.
What is most striking is that, as the grey bars show, outside of Australia, in every major region small caps have already underperformed more than in any previous recession[1]. (And in the case of Australia the current -17.5% underperformance is just shy of its historical maximum of -20%.)
The key point here is that, if a recession was to occur in the U.S. this cycle, small caps across the world have generally already underperformed large caps by more than they have historically in any recession. So, this may limit the size of any underperformance (or they may even outperform!) … should a recession happen.
Chart 2: Smalls already underperforming Large Caps by more than historical maximum around recession (except Aust but its close!)
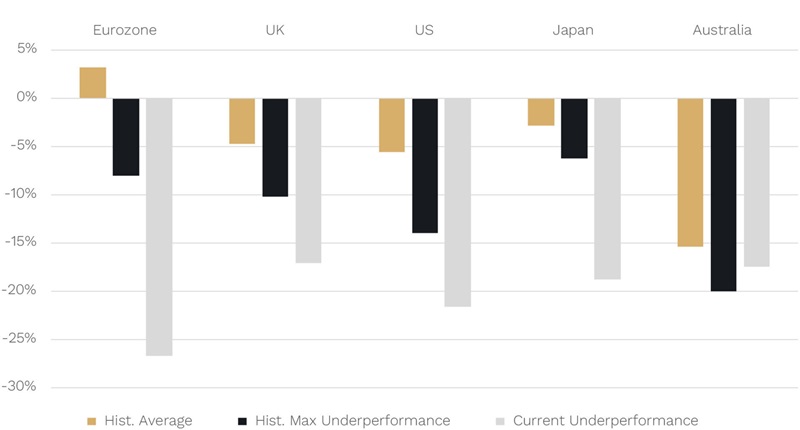
Source: JP Morgan, Bloomberg. Data to 31 March 2024
What typically happens on the other side of a recession in small versus large caps?
Outperformance!
Below we show the historical average outperformance in small versus large caps in the 1 (gold bar), 2 (black bar) and 3 years (grey bar) after the recession-linked low in the major share market regions.
Chart 3: Average Small vs Large Cap outperformance in years since recession linked equity market trough (100% Hit Rate in Year 1)
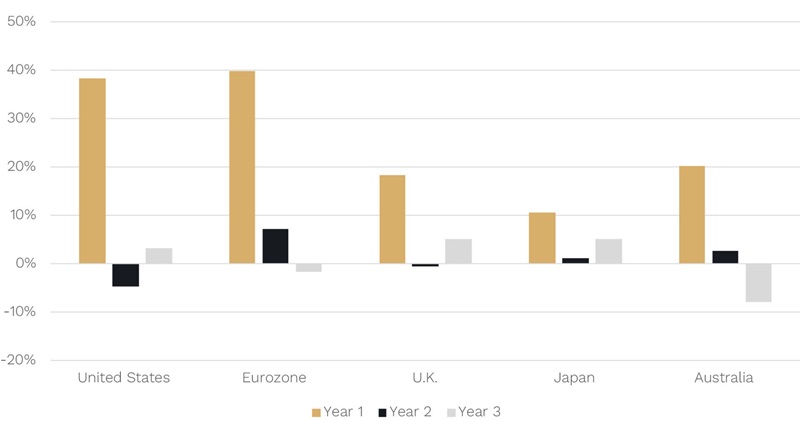
Source: JP Morgan, Bloomberg
What you can see is that across the board in every major region, including Australia, small caps on average have outperformed large caps in the first year.
Not only that but the hit rate is 100%. That means that, not only is there small-cap outperformance on average, but this outperformance has occurred in the first year on every occasion in every region!
The other point is that all, or at least the vast majority, of that outperformance is delivered in the first year. A more granular analysis shows that much of it occurs in the first 3-6 months. So don’t bother trying to time it because it happens so quick you will probably miss it.
The key takeaway is that there is an asymmetry in the payoff of smalls versus large caps globally even if a recession occurs for two reasons:
- The downside versus large caps may be more limited given the already extreme underperformance for small caps, and
- The outperformance on the rebound of small caps has been historically consistent, quite significant (especially compare to the underperformance) and front loaded.
That’s why we say, when it comes to small versus large caps globally: don’t be penny wise and pound foolish.
That is, if you ‘pinch pennies’ to avoid the downside (if any given the underperformance already) of small v large caps if a recession occurs, you risk missing the likely big upside (the ‘pounds’) in outperformance of small caps on the other side of any recession.
How much better could smalls caps be than large caps in the years ahead?
Over the last few months we have highlighted just how extreme the valuation differences are in small cap land compared to large caps (and also even to mid caps).
While valuations are rubbish at predicting returns over the next week, month or year, at the market level they are generally very good over periods like 5-10 years.
Below we show the differences in relative valuations (using the Cyclically Adjusted Price-Earnings ‘CAPE’ Ratio) between US small (Russell 2000) and large caps (S&P500) and their subsequent 10-year relative returns.
Chart 4: Russell 2000/S&P500: Valuations and Returns (10 years)
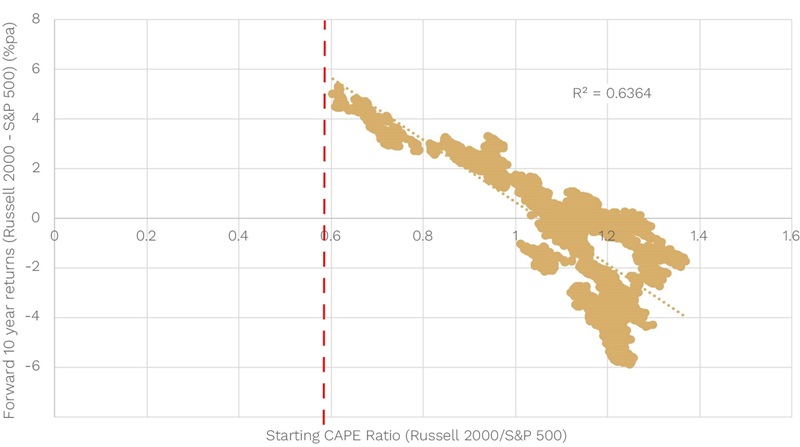
Source: Bloomberg
It is crystal clear that the cheaper U.S. small caps are to large caps (a lower starting relative CAPE ratio), the more small caps tend to outperform large caps over the next 10 years.
The relationship is so good that these starting valuations explain almost 2/3s (64%) of the subsequent return difference.
Today the Russell 2000 CAPE ratio is 19x versus 32x for the S&P500 or a relative valuation of 0.6 (red dotted line). That’s about the lowest/cheapest since 2000.
Historically, when U.S. small caps have been this cheap versus large caps, they have gone on to outperform them by around 5% p.a. over the next decade.
This is a big deal.
A 5% return on a $100,000 investment, for example, would give you a $63,000 gain over a decade. But a 10% return would give you a $159,000 gain – more than twice the gain due to the benefits of compounding.
For investors that have never considered allocating to small caps, and who have been riding the recent wave of large-cap outperformance, we hope we have made a compelling case for why we think, like it always does, the cycle will turn and we’ll again have the wind at our back as small cap investors.
First published on the Firstlinks Newsletter. A free subscription for nabtrade clients is available here.
Andrew Mitchell is Director and Senior Portfolio Manager at Ophir Asset Management, a sponsor of Firstlinks. This article is general information and does not consider the circumstances of any investor.
[1] Using small cap data where available for the last six U.S. recessions back to 1980.
All prices and analysis at 15 May 2024. This document was originally published on firstlinks.com.au on 15 May 2024. This information has been prepared by Ophir Asset Management (ABN 88 156 146 717, AFSL No. 420082).
The content is distributed by WealthHub Securities Limited (WSL) (ABN 83 089 718 249)(AFSL No. 230704). WSL is a Market Participant under the ASIC Market Integrity Rules and a wholly owned subsidiary of National Australia Bank Limited (ABN 12 004 044 937)(AFSL No. 230686) (NAB). NAB doesn’t guarantee its subsidiaries’ obligations or performance, or the products or services its subsidiaries offer. This material is intended to provide general advice only. It has been prepared without having regard to or taking into account any particular investor’s objectives, financial situation and/or needs. All investors should therefore consider the appropriateness of the advice, in light of their own objectives, financial situation and/or needs, before acting on the advice. Past performance is not a reliable indicator of future performance. Any comments, suggestions or views presented do not reflect the views of WSL and/or NAB. Subject to any terms implied by law and which cannot be excluded, neither WSL nor NAB shall be liable for any errors, omissions, defects or misrepresentations in the information or general advice including any third party sourced data (including by reasons of negligence, negligent misstatement or otherwise) or for any loss or damage (whether direct or indirect) suffered by persons who use or rely on the general advice or information. If any law prohibits the exclusion of such liability, WSL and NAB limit its liability to the re-supply of the information, provided that such limitation is permitted by law and is fair and reasonable. For more information, please click here.