Why companies are issuing more dividends & less buybacks
Janus Henderson
Despite global dividends climbing to a new record in 2023, companies spent much less buying back their shares.
That's the finding from our latest annual Share Buyback study, a special supplement to our quarterly Global Dividend Index.
The US$1.11 trillion total was US$181 billion lower than in 2022, a significant decline of 14% year-on-year and large enough to take 2023’s buybacks below the 2021 total.
However, the decline comes from a very high base and leaves the annual total still well above pre-pandemic levels.
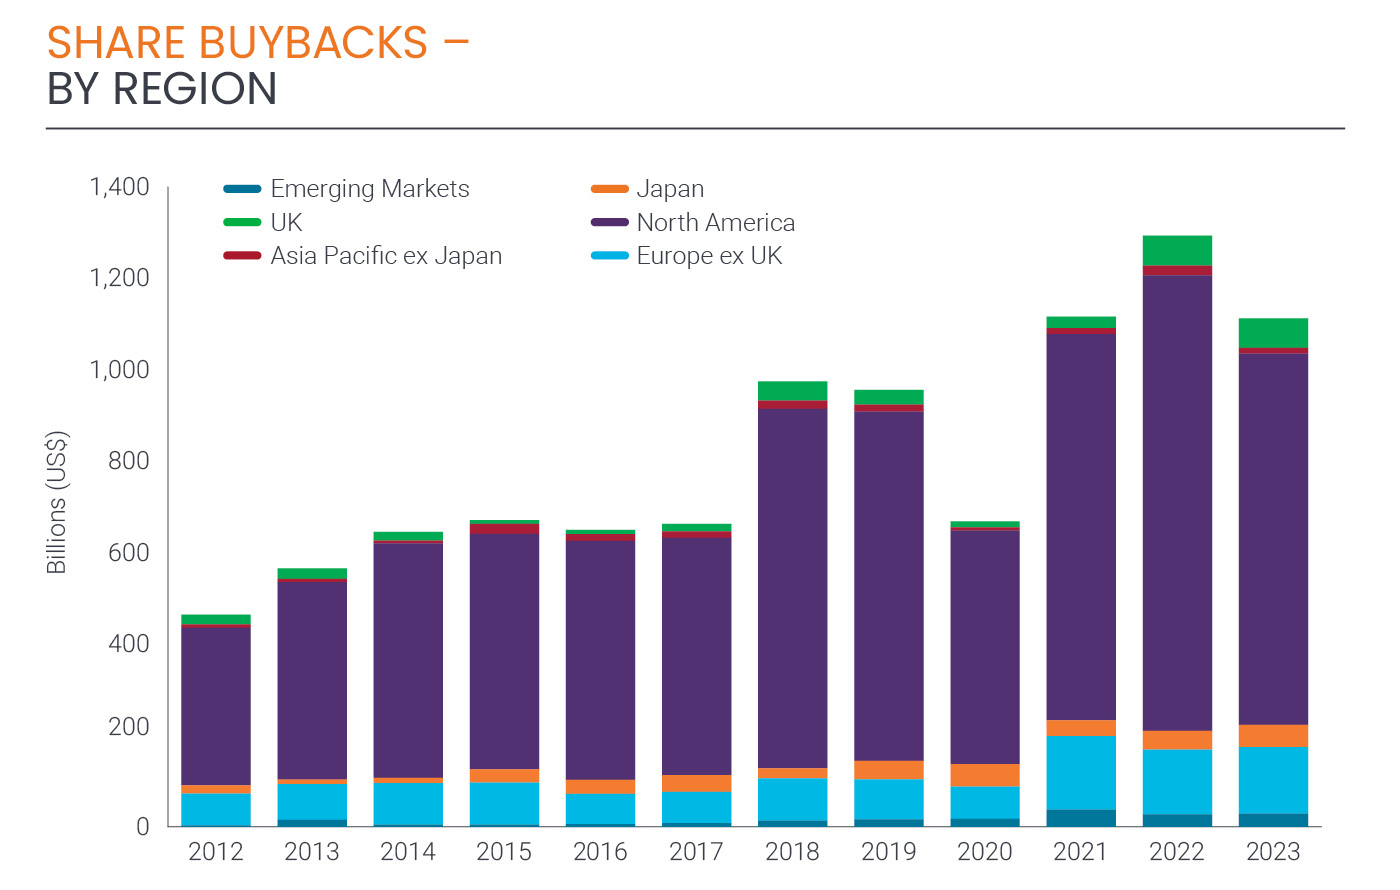
US companies bought back the most shares in 2023
US companies were the biggest buyers of their own shares, totalling US$773 billion in 2023 and accounting for US$7 in every US$10 globally. However, they also made a disproportionately large reduction; US buybacks fell by US$159 billion last year, down by 17% year-on-year.
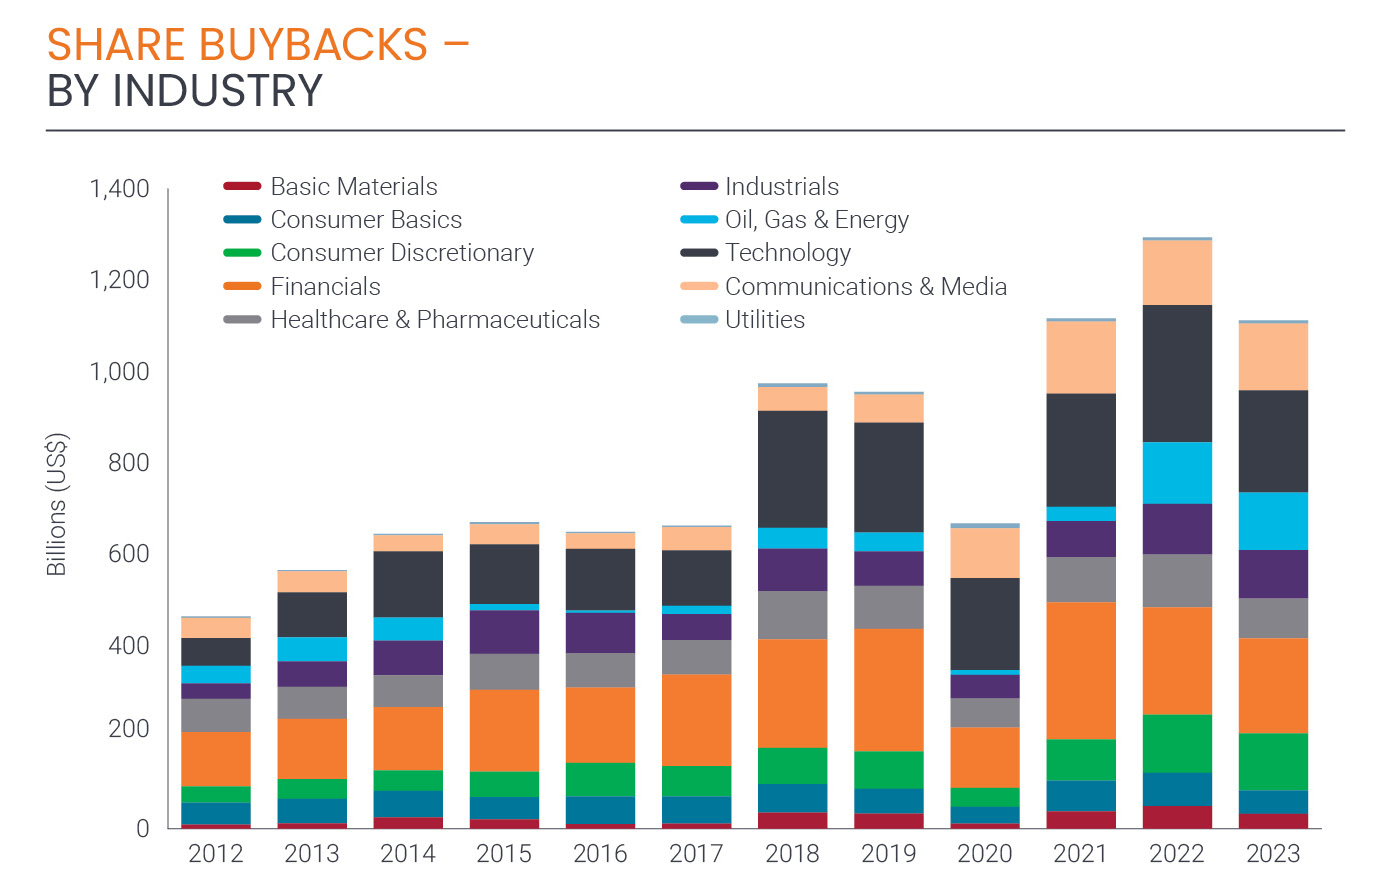
US technology companies cut back the most, spending US$69 billion less than the previous year. Among these, Microsoft (NASDAQ: MSFT) and Meta (NASDAQ: META) reduced buybacks by almost one-third, and Apple (NASDAQ: AAPL) by one-seventh.
There were also big reductions across much of the US healthcare sector and among financials, though not across the banking sector, where cuts by some banks were more than offset by rises elsewhere.
Overall, in the US, the number of companies spending less on share buybacks outnumbered those spending more by 1.8:1. Nevertheless, the value of buybacks was 1.2x larger than the value of dividends paid by US companies in Janus Henderson’s Global Dividend Index.
 Source: Janus Henderson
Companies in the UK also made significant share repurchases
Outside the US, companies in the UK were the biggest buyers of their own shares, accounting for US$1 in every US$17 of the global total in 2023. Purchases of US$64.2 billion were just 2.6% lower year-on-year and equalled 75% of dividends paid.
Shell (LON: SHEL) is the largest non-US buyer of its own shares, (accounting for almost a quarter of the UK total) but it cut quite sharply in 2023, as did BP (LON: BP), BAT (LON: BATS), Lloyds (LON: LLOY) and several other large UK blue chip companies. Significant increases by HSBC (LON: HSBA), Barclays (LON: BCS) and others almost offset these cuts, meaning only a small overall decline for the year.
The appetite for increased buybacks amongst European companies is growing
Buybacks are becoming more generous in Europe. Across the region, the total paid rose 2.9% to US$146 billion in 2023 (compared to a 20% underlying increase in dividends for the same period).
There was considerable variation from one country to another: buybacks reached a record level in Italy (driven by Unicredit and Stellantis), Spain (driven by Santander, Iberdrola and Telefonica), Norway (Equinor) and Belgium (AB-Inbev and KBC), though France, Switzerland and the Netherlands saw the largest value of shares repurchased.
The biggest decline was in Switzerland where the majority of companies reduced buybacks; Nestle (SWX: NESN) made the largest impact, almost halving its programme to US$5.8 billion. Roughly the same number of European companies increased buybacks in 2023 as reduced them, though very strong dividend growth in 2023 meant buybacks grew less than dividends and they fell as a proportion of shareholder returns to 48% of dividends paid, down from 55% in 2022.
Share buybacks remain less prominent in the Asia Pacific
Companies in Asia Pacific ex-Japan are the least likely to conduct buyback programmes. The big year-on-year reduction (-40%) mainly reflects lower share buybacks by Australia’s large banks, more than offsetting increases in Hong Kong and South Korea.
Data from Japan lags behind the rest of the world as annual results for 2023/24 have not yet been published (see methodology for more detail). The large increase (+18%) largely reflects activity in the calendar year 2022. A closer look at interim reports suggests that share buybacks are likely to also be lower year-on-year for 2023/24, though this will not be clear until the reporting season has begun in early May.
Telecoms, banks and vehicle companies repurchased the most shares
At a sector level, technology, healthcare, and financials saw the biggest reductions, with the largest impact seen amongst US companies. In fact, outside the US, healthcare companies increased their buybacks. Companies in the chemicals, mining and consumer basics sectors, such as tobacco and household products, also cut back on their share repurchases. Globally, telecoms, banks and vehicle companies made the most significant increases.
It is worth noting that buybacks are highly concentrated. Just over half the companies in Janus Henderson’s index of 1,200 companies repurchased shares in 2023, but just 45 of these accounted for half the annual total spent on buying back shares globally.
 Source: Janus Henderson
So why is this?
Many companies use buybacks as a release valve – a way of returning excess capital to shareholders without setting expectations for dividends that might not be sustainable long term. This is especially appropriate in cyclical industries like oil or banking.
That flexibility explains why buybacks are more volatile than dividends. It also means there is no real evidence that buybacks are taking over from dividends. Meta, for example, paid its first dividend in 2024.
Moreover, the relative size of buybacks when compared to dividends shrank in every region except Japan and emerging markets (where there are data lags). Dividends are still well supported by corporations as a means of returning capital to shareholders.
Higher interest rates have played a role in the decline of share buybacks – when debt is cheap it makes sense for companies to borrow more (as long as they borrow prudently) and use the proceeds to retire expensive equity capital.
With rates at multi-year highs, that calculation is more nuanced; some companies are paying down debt at this point in the cycle, using cash that might otherwise have gone to buybacks, but very few are cutting dividends as our forthcoming Global Dividend Index will show.
It’s tempting to extrapolate a new trend of decline for buybacks. But one down year from multi-year highs is not evidence that this is happening. It is all about companies finding the appropriate balance between capital expenditure, their financing needs and shareholder returns via dividends, buybacks or both.
Learn how the industry leaders are navigating today's market every morning at 6am. Access Livewire Markets Today.
All prices and analysis at 24 April (unless otherwise stated). This document was originally published in Livewire Markets on 24 April. This information has been prepared by Janus Henderson Investors (Australia) Funds Management Limited (ABN 43 164 177 244) (AFSL 444268).
The content is distributed by WealthHub Securities Limited (WSL) (ABN 83 089 718 249)(AFSL No. 230704). WSL is a Market Participant under the ASIC Market Integrity Rules and a wholly owned subsidiary of National Australia Bank Limited (ABN 12 004 044 937)(AFSL No. 230686) (NAB). NAB doesn’t guarantee its subsidiaries’ obligations or performance, or the products or services its subsidiaries offer. This material is intended to provide general advice only. It has been prepared without having regard to or taking into account any particular investor’s objectives, financial situation and/or needs. All investors should therefore consider the appropriateness of the advice, in light of their own objectives, financial situation and/or needs, before acting on the advice. Past performance is not a reliable indicator of future performance. Any comments, suggestions or views presented do not reflect the views of WSL and/or NAB. Subject to any terms implied by law and which cannot be excluded, neither WSL nor NAB shall be liable for any errors, omissions, defects or misrepresentations in the information or general advice including any third party sourced data (including by reasons of negligence, negligent misstatement or otherwise) or for any loss or damage (whether direct or indirect) suffered by persons who use or rely on the general advice or information. If any law prohibits the exclusion of such liability, WSL and NAB limit its liability to the re-supply of the information, provided that such limitation is permitted by law and is fair and reasonable. For more information, please click here.