Security Alert: Scam Text Messages
We’re aware that some nabtrade clients have received text messages claiming to be from [nabtrade securities], asking them to click a link to remove restrictions on their nabtrade account. Please be aware this is likely a scam. Do not click on any links in these messages. nabtrade will never ask you to click on a link via a text message to verify or unlock your account.
Hot Q1 CPI to test RBA’s confidence, but doesn’t force them to rewrite the outlook
Taylor Nugent | National Australia Bank Limited
Key points:
- Q1 CPI came in two tenths hotter than expected
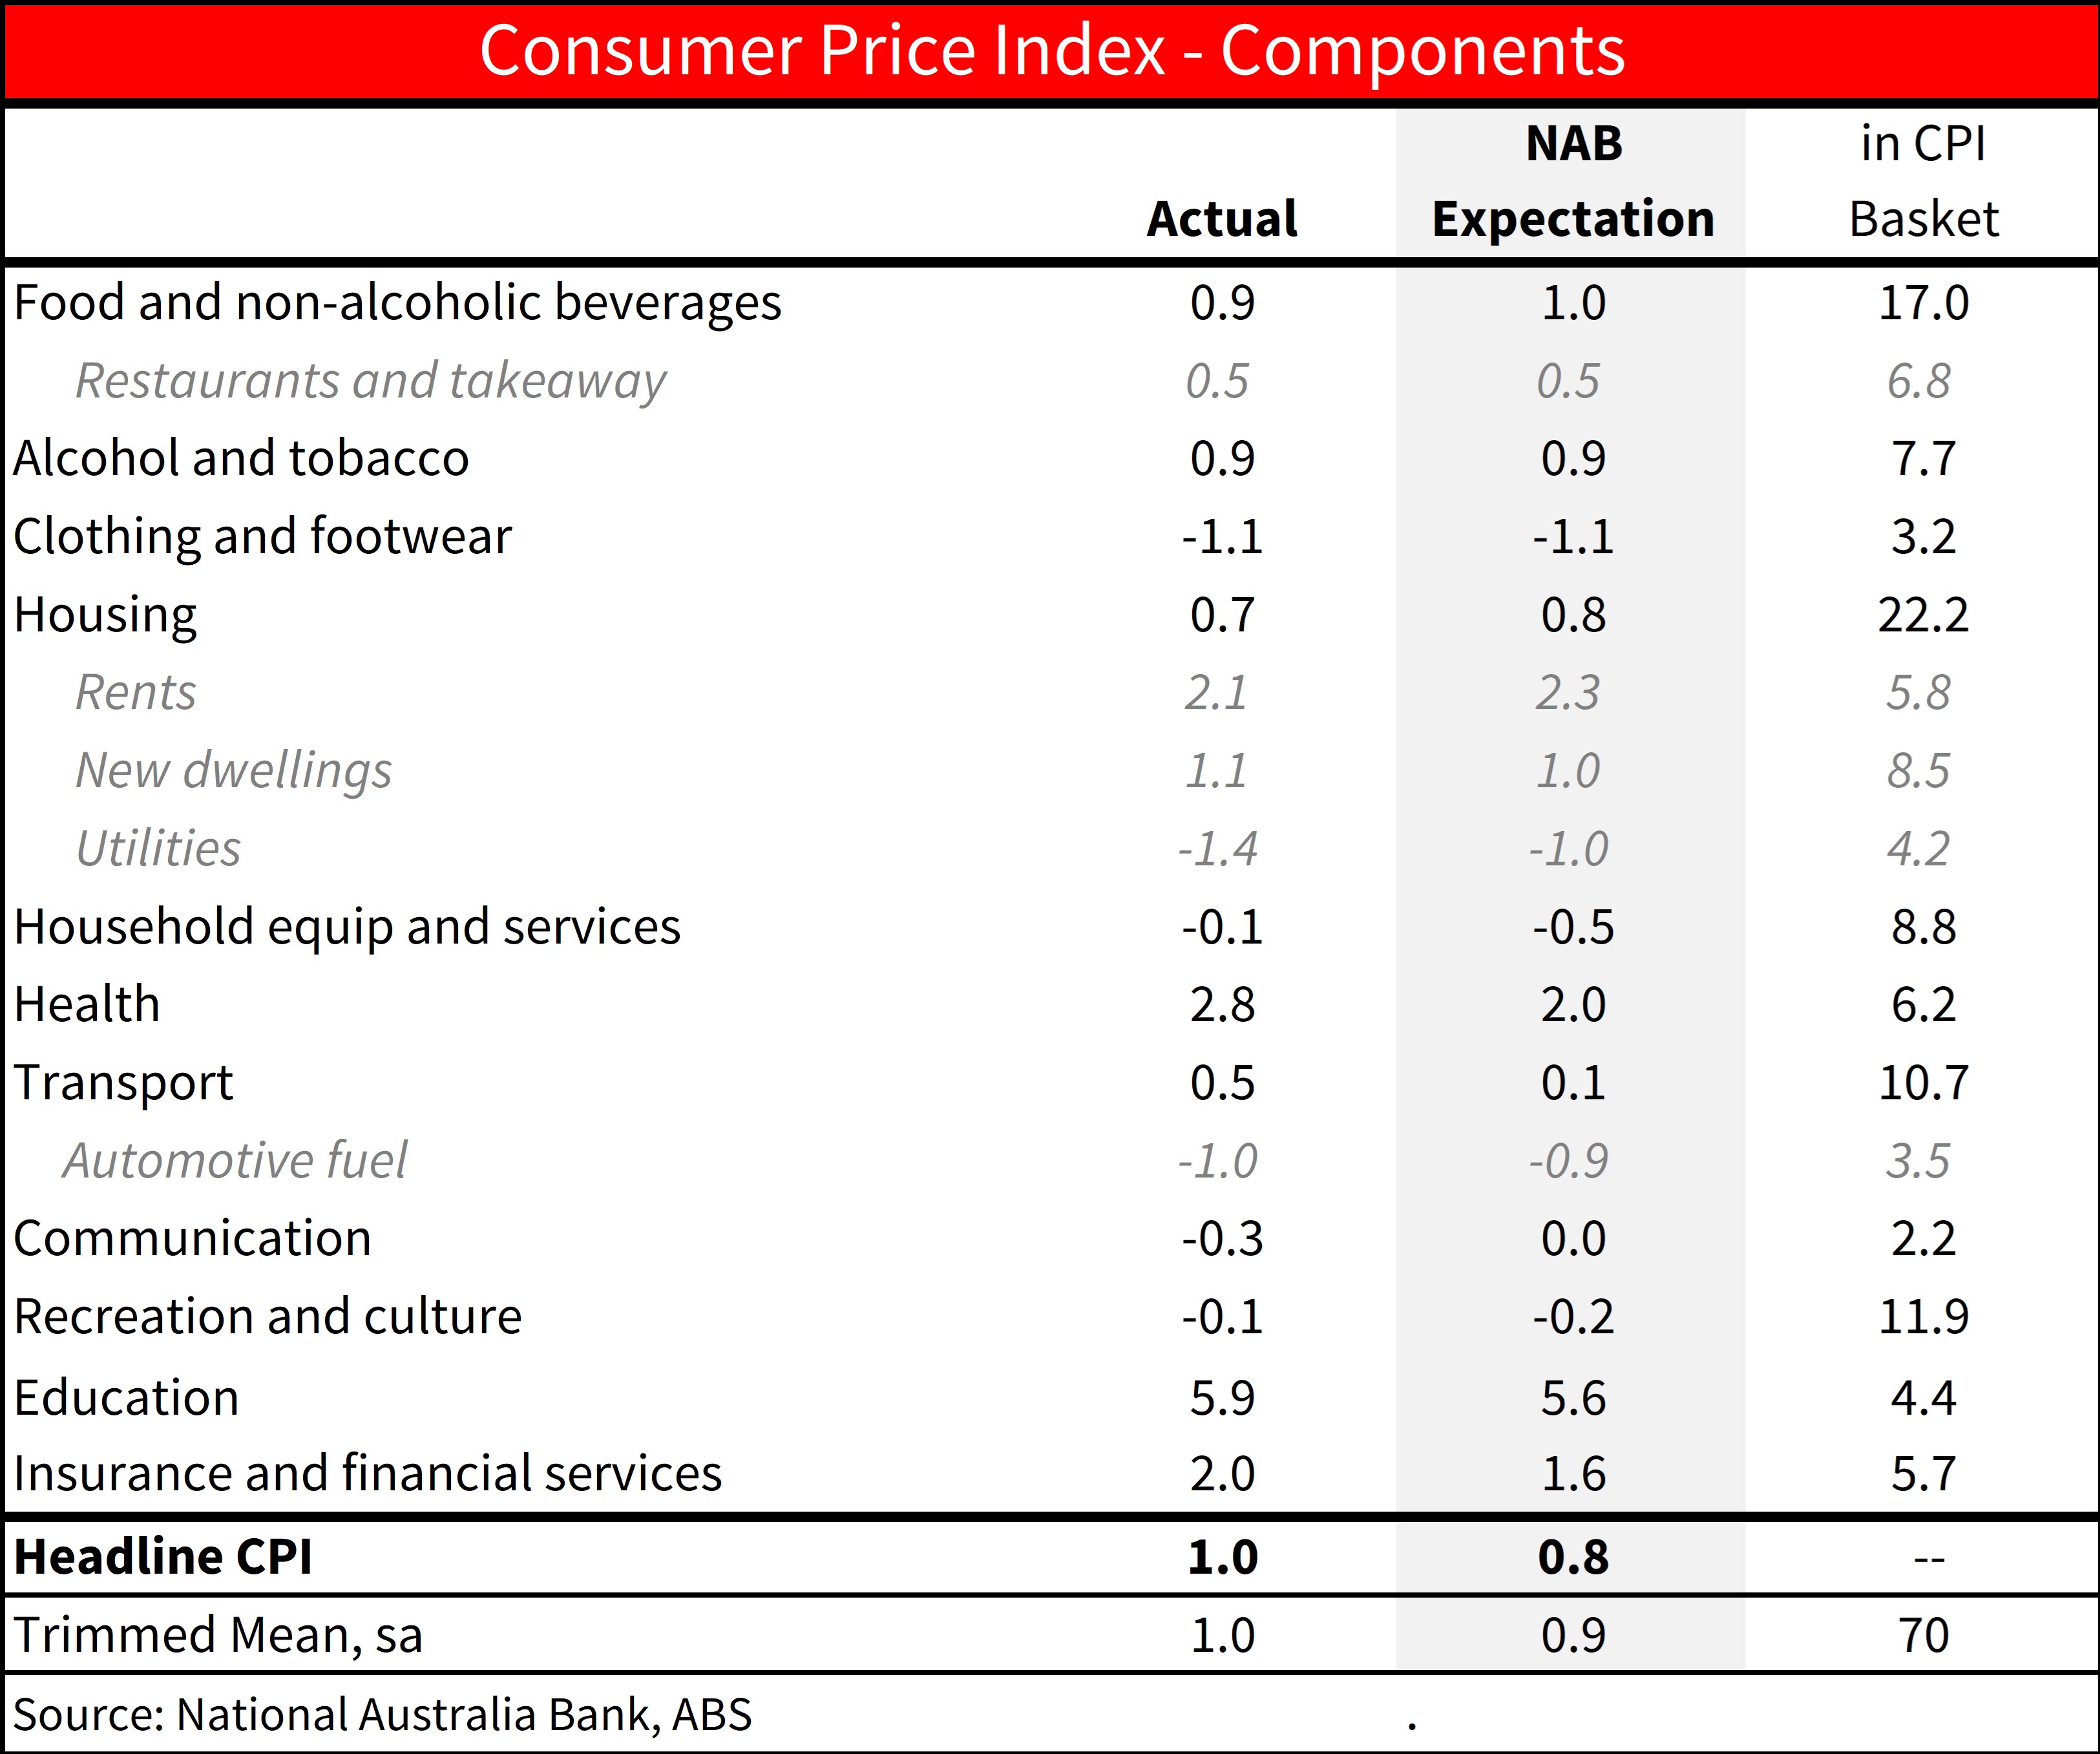
- Trimmed mean was 1.0% q/q (NAB 0.9, consensus 0.8)
- Headline was 1.0% (NAB and consensus 0.8%)
- The surprise was driven by higher health inflation and an increase in new car prices
- This is yet another test for the RBA’s approach of seeking to do the bare minimum on policy
- While it should test their conviction, below trend growth and the paring of market pricing for cuts means the RBA can still forecast inflation getting back to target by mid-2026
- NAB sticks with its long held that the RBA will not cut rates until November 2024
Bottom Line and Implications:
Q1 CPI came in on the high side of expectations, at 1.0% q/q on both the headline and trimmed mean measure. That is stronger than the 0.8% q/q the RBA had pencilled in the February SoMP. Relative to last quarter, consumer durable goods prices rose sharply (they fell in Q4 2023) and strong rents inflation resumed after the one off from higher rent assistance last quarter. Market services inflation remained about as stubborn as expected. Those themes were expected, the surprise for us was even stronger price rises in health categories than we had pencilled in, and a rise in new car prices.
NAB’s view remains for ongoing but uneven and gradual progress on inflation while policy remains moderately restrictive. Below trend growth is expected to continue to feed through to some cooling in the still tight labour market and reduce excess demand. At the same time, some of echoes of earlier cost pressures are still finding their way through to end prices, including through input cost pressures for things like rents and utilities, elevated inflation in insurance premiums as they catch up to higher repair and replacement costs, and high administered price increases in categories like education, some areas of health and tobacco excise where prices can echo earlier outcomes with a lag.
Recent data means the RBA will need to revise higher their near-term inflation outlook and lower their near-term unemployment outlook at the May meeting. Even if outcomes were broadly in line with their forecasts, it would have taken some time for the RBA to be comfortable inflation trends are consistent with inflation around the mid-point of the target band by mid 2026. The paring of market pricing for cuts over the past 3 months means forecasts the upcoming May SoMP will be conditioned on tighter for longer policy, and while the recent data flow will rightly test their confidence, the RBA needn’t abandon their forecast for some continued progress in the outlook.
NAB continues to see the RBA on hold until late this year, pencilling in a first cash rate cut in November. However, evident resilience in the labour market and the failure of today’s data to show much good news puts a premium on next quarter’s CPI print as the RBA seeks to develop confidence in the inflation track.
Detail:
Market Services: Market services inflation ex rents was 1.3% q/q on a seasonally adjusted basis, in line with our forecast and matching the Q4 outcome. Slower restaurant inflation was offset by faster price rises in other financial services. There has been little additional progress over the past 6 months on this indicator of domestic pressure. Meals out and takeaway prices have tracked the broader improvement in food inflation lower, and on a 6m annualised basis are running at 2.8%, only a bit above levels historically consistent with at target inflation. Rents are annualising at 8.6%, much too high and with little hope for meaningful deceleration until 2025. Volatile travel prices have subtracted from inflation over the past year. But elsewhere, market services were 6.4% q/q annualised, and 6.5% over the past year. Unhelpfully persistent services inflation is alive and well in Australia.
Health: Health prices are excluded from the measure of market services inflation watched by the RBA as there is a large role for government in price outcomes. Health inflation was 2.8% q/q (NAB 2.0%). Health inflation is only running at 4.1% y/y, but while some of the outcome is dues to administered price impacts, stronger price rises among GPs and other health service providers in part reflect some of the pressures on the domestic cost base as evident in other services categories, with labour availability and cost pressures especially acute across health.
Goods: We see this as quarter-to-quarter volatility rather than a persistent reacceleration, though we do not think that goods prices will be a persistent source of disinflation pressure and do not assume the environment of declining imported consumer good prices in place prior to the pandemic will reassert itself. Market goods excluding food and houses rose 0.8% q/q (NAB +0.6% q/q) in seasonally adjusted terms, after -0.9% q/q in Q4, though is running at 0.2% y/y after a peak of 6.9% y/y in Q4 2022. Consumption goods import prices have stabilised somewhat but are generally not showing large falls, and resilient demand and the broader cost base of retailing is an offset to improved supply.
Housing: Rents growth was 0.6% m/m in March for 2.1%q/q. Rents contributed 13bp to quarterly CPI growth in Q1, compared to just 5bp in Q4 due to the one off drag from higher rent assistance in September and October last year. Rents inflation remains elevated and will be a key support for overall inflation until well into 2025 at least given the lead from still rising advertised rents amid low vacancy rates. New Dwelling construction drove much of the earlier progress on inflation, but still remains somewhat elevated as builders continue to pass on higher labour and building material costs. It rose 0.4% m/m in March and 1.1% q/q. Electricity prices rose 5% m/m in March to be -1.7% q/q as expected, due to the unwind of the second instalment of Perth subsidies in March. Broader subsidies continue to subtract 11% from the electricity price level on a quarterly basis. They expire at the end of June, and will more than offset underlying falls in retail prices unless they are extended.
Education: Strong increases in education were already measured in the Monthly February print. Higher price rises for primary and secondary education offset a more modest increase in tertiary fees this year. Tertiary education inflation was lower because upward pressure from graduated students on the old lower fee structure has ended, but is still elevated, in large part reflecting lags in indexation which mean this category should be a source of downward pressure next year.
Food: prices inflation continued to moderate from earlier peaks, with y/y inflation across food and non-alcoholic beverages slowing to 3.8% y/y. Grocery inflation annualised at 1.0% y/y in Q1 on a seasonally adjusted basis, near levels that have historically been consistent with at target inflation. Some further improvement in y/y rates for food inflation is expected.
Chart 1: Headline and Trimmed Mean Inflation
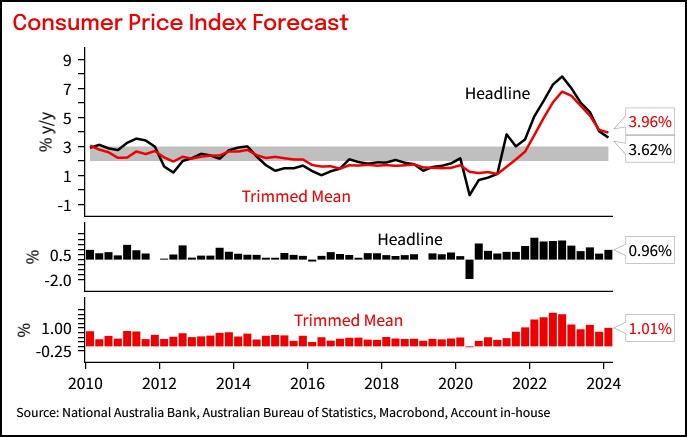
Chart 2: Contributions to CPI inflation
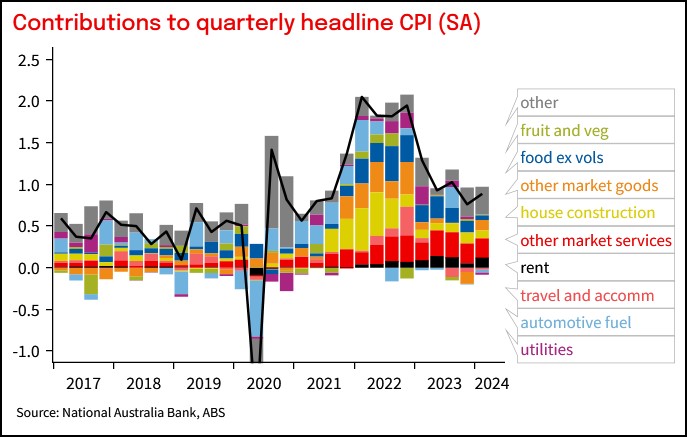
Table 1: CPI heat map. Shows 3-, 6- and 12m annualised outcomes. Shading reflects how far inflation is above or below a benchmark of the 6 years to 2015 when inflation averaged around the mid-point of the target
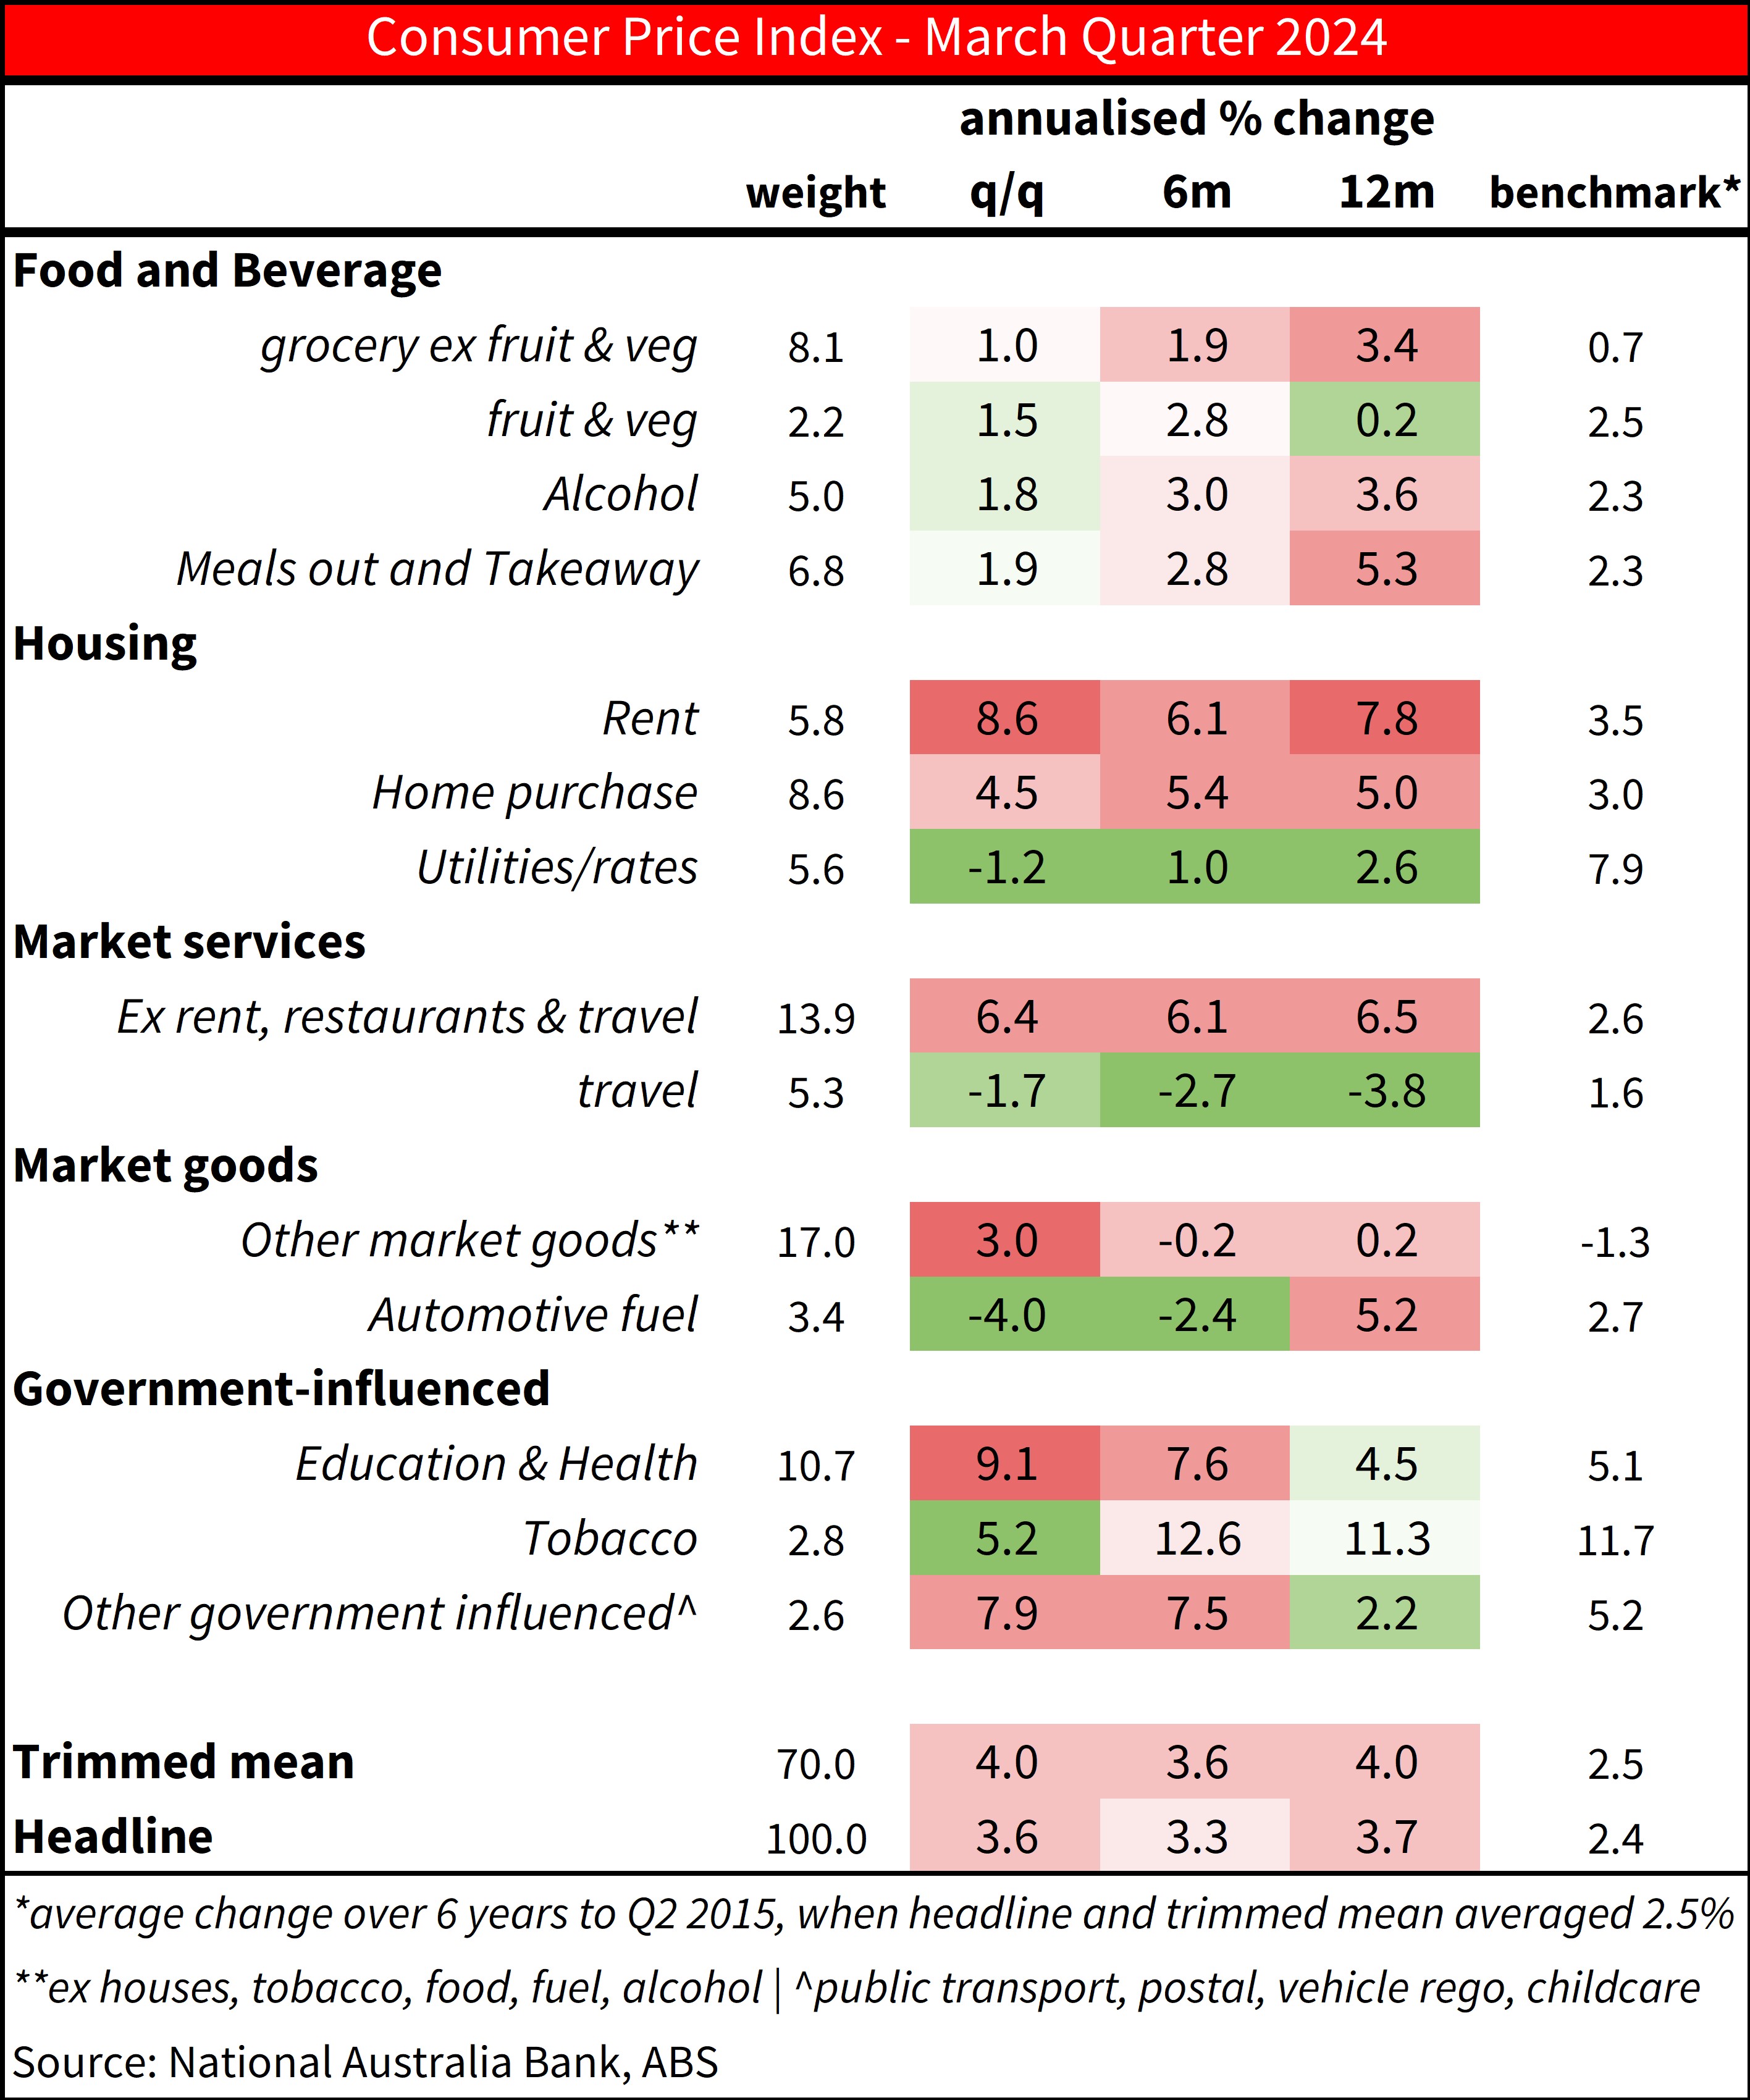
Chart 3: International comparison of progress on underlying inflation.
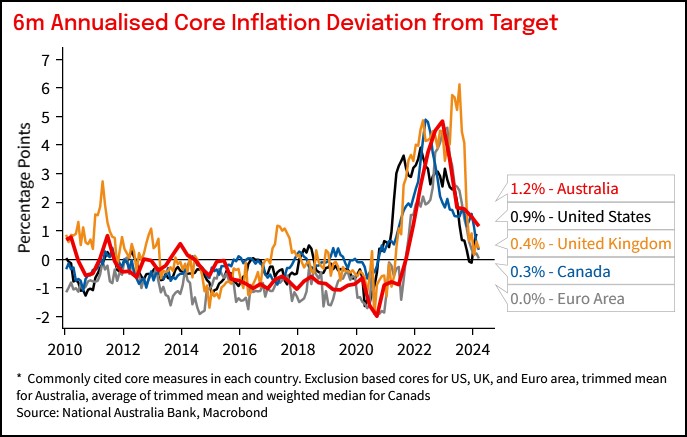
Chart 4: Tradable and non-tradable inflation
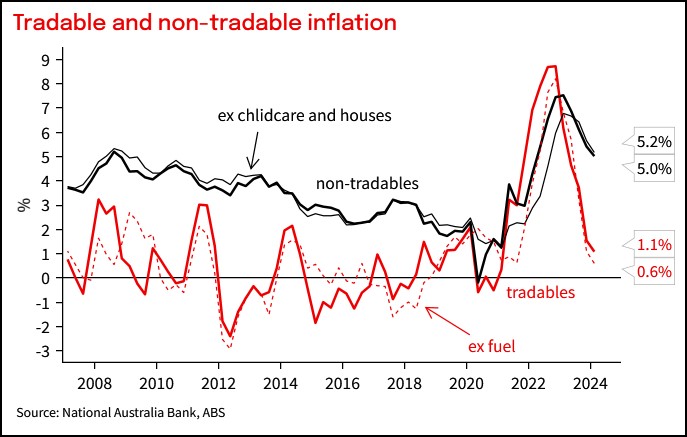
Chart 5: Market goods inflation
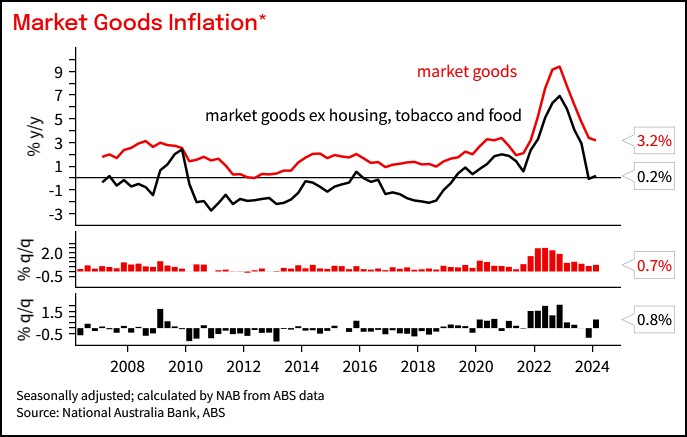
Chart 6: Market services inflation
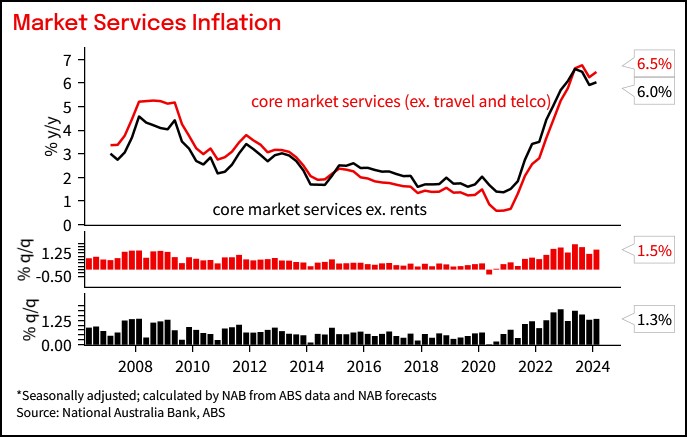
Chart 7: Share of basket with elevated annualised price increases
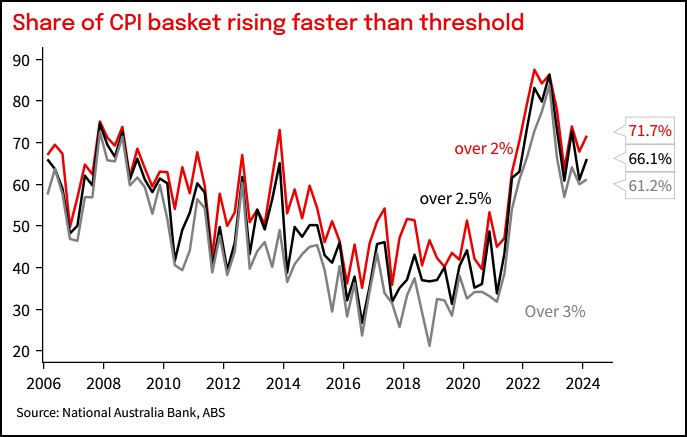
Chart 8: Distribution of quarterly price changes
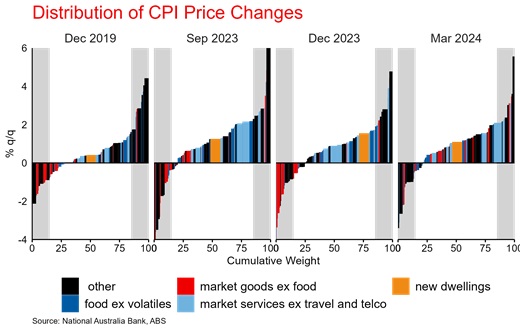
Chart 9: Distribution of price increases has shifted noticeably lower since the peaks in inflation
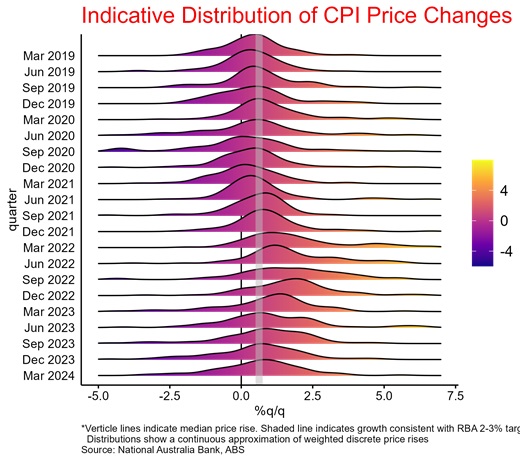
Chart 10: monthly and quarterly inflation and RBA forecasts
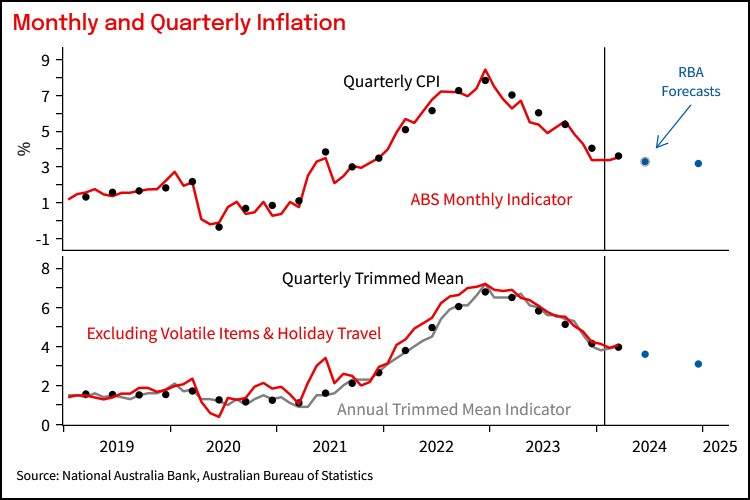
Chart 11: New Dwelling inflation (8.5% of CPI)
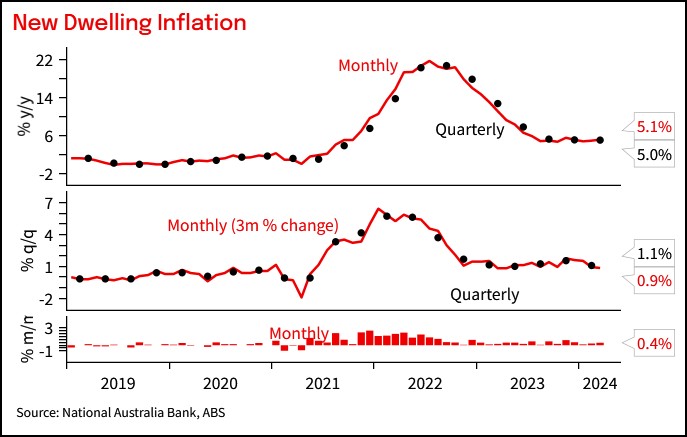
Chart 12: Rents inflation (5.8% of CPI)
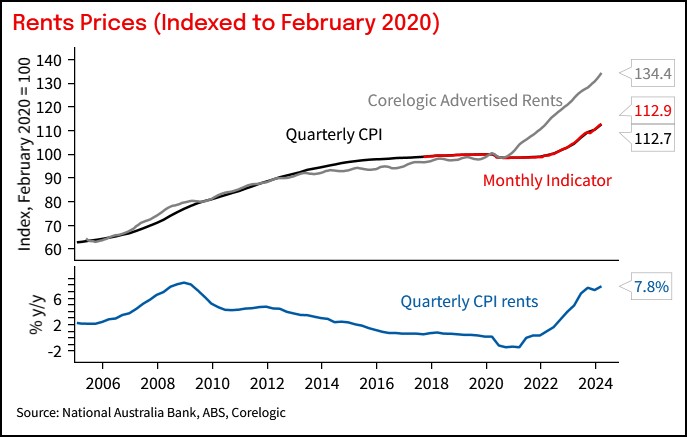
Table 2: Comparison to NAB forecast
This document has been prepared by National Australia Bank Limited ABN 12 004 044 937 AFSL 230686 ("NAB"). Any advice contained in this document has been prepared without taking into account your objectives, financial situation or needs. Before acting on any advice in this document, NAB recommends that you consider whether the advice is appropriate for your circumstances. NAB recommends that you obtain and consider the relevant Product Disclosure Statement or other disclosure document, before making any decision about a product including whether to acquire or to continue to hold it.
Please Click Here to view our disclaimer and terms of use. Please Click Here to view our NAB Financial Services Guide.
All prices and analysis at 24 April 2024. This information has been prepared by National Australia Bank Limited ABN 12 004 044 937 AFSL 230686 ("NAB").
The content is distributed by WealthHub Securities Limited (WSL) (ABN 83 089 718 249)(AFSL No. 230704). WSL is a Market Participant under the ASIC Market Integrity Rules and a wholly owned subsidiary of National Australia Bank Limited (ABN 12 004 044 937)(AFSL No. 230686) (NAB). NAB doesn’t guarantee its subsidiaries’ obligations or performance, or the products or services its subsidiaries offer. This material is intended to provide general advice only. It has been prepared without having regard to or taking into account any particular investor’s objectives, financial situation and/or needs. All investors should therefore consider the appropriateness of the advice, in light of their own objectives, financial situation and/or needs, before acting on the advice. Past performance is not a reliable indicator of future performance. Any comments, suggestions or views presented do not reflect the views of WSL and/or NAB. Subject to any terms implied by law and which cannot be excluded, neither WSL nor NAB shall be liable for any errors, omissions, defects or misrepresentations in the information or general advice including any third party sourced data (including by reasons of negligence, negligent misstatement or otherwise) or for any loss or damage (whether direct or indirect) suffered by persons who use or rely on the general advice or information. If any law prohibits the exclusion of such liability, WSL and NAB limit its liability to the re-supply of the information, provided that such limitation is permitted by law and is fair and reasonable. For more information, please click here.
