All about ETFs: Answers to twelve popular questions about ETFs
It’s no surprise that the growth of Exchange-Traded-Funds (ETFs) has raised some questions about their size, mechanics, and role in financial markets. Here, we look to answer some of the most popular questions we receive about ETFs and index investing.
1. DO ETFs INCREASE MARKET VOLATILITY?
Typically, no. In fact, ETFs globally have acted as “shock absorbers” during many volatile trading sessions as buyers and sellers transacted on the exchange, at real-time prices, without having to trade the underlying stocks and bonds.1
What’s more, since ETF shares are traded directly by buyers and sellers on-exchange, an ETF can circumvent “forced selling,” something a mutual fund may need to do when investors want to sell their shares. This means that most ETF trading occurs without transactions taking place in the underlying securities.
2. DO ETFs DRIVE THE DIRECTION OF MARKETS?
Given the size of some of the largest ETFs, one might think that buying and selling within those funds significantly moves market prices. However, it is asset allocation decisions made by asset owners, such as superannuation funds and individuals, that drive flows into different asset classes, sectors, and geographies.
These allocation decisions are generally guided by factors such as macroeconomic developments (like global interest rate policy), risk preferences, and investment horizon.
ETFs are just one way for investors to express their views about the market. If ETFs didn’t exist, investors could use other tools, like single stocks, mutual funds, and derivatives.
3. HOW DO ETFs IMPACT MARKET LIQUIDITY?
ETFs are unique; they provide exposure to a diversified collection of assets, like a mutual fund, but trade on exchange, like a stock. This structure makes the liquidity of ETFs unique, too.
Liquidity refers to the ease of buying or selling a security. ETFs have two layers of liquidity: primary market liquidity, which is provided by the underlying securities or instruments of the ETF, and secondary market liquidity, which is provided by the ability to trade ETFs on exchange.
This means that ETFs are net contributors to market liquidity. At a minimum, an ETF will be as liquid as its underlying securities or instruments; however, many ETFs can provide even greater market liquidity than their underlying instruments.
4. HOW BIG IS THE ETF MARKET?
ETFs have grown quickly in both size and scope over the past decade. Despite this, assets under management in ETFs are only a fraction of the global financial market in both equities and fixed income.
Even in the most mature market the US, ETFs only represent 12.6%2 of equity assets. These numbers are even smaller in other regions at 8.0%3 in Europe, and 4.2%4 in Asia-Pacific. Market share is even smaller in fixed income, where ETFs account for 2.7%5 of fixed income assets in the U.S., 1.8%6 in Europe, and 0.4%7 in Asia-Pacific.
In Australia ETFs account for just under 6% of equity assets as of September 20238 and just 0.6% of fixed income assets as of June 2023. 9
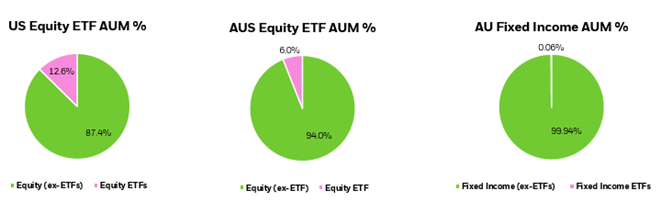
US Equity ETF AUM and AU Fixed Income AUM as at September 2023. AUS Equity ETF AUM as at June 2023. 2,8,9
5. ARE ALL EXCHANGE-TRADED PRODUCTS (ETPs) THE SAME?
While all ETPs share certain characteristics, like the ability to trade shares on exchange, some have more complex risks and structural features. Examples of these products include those that seek to provide a leveraged or inverse return of their benchmark.
As the number of ETPs has increased, so too has the number of more structurally complex products, including ETPs with different risk profiles and more narrowly tailored investment objectives.
BlackRock is supportive of efforts to increase awareness and transparency around the risks and structural features of complex products, and we have long advocated for a clear categorisation of ETPs that may have differing risks and complexities.
6. DO INDEX REBALANCES MAKE INDEX INVESTING LESS EFFICIENT?
Index providers periodically make changes to, or rebalance, their indexes. This includes adding, deleting, and making changes to the weights of securities in the indexes they manage. Because index funds seek to track the performance of an index, they also adjust their holdings when index rebalances happen.
There are a multitude of decisions that must be made leading up to and during index rebalances. At BlackRock, professional index fund managers take a disciplined approach to managing rebalances as they seek to deliver fund performance outcomes that align with index performance.
7. HOW DOES iSHARES BY BLACKROCK MEASURE INVESTMENT PERFORMANCE FOR INDEX ETFs?
At iShares by BlackRock, we measure ETF investment performance not only by how well our ETFs track their indexes, but also by how we deliver the performance our investors expect in a cost- and tax-efficient way. This includes paying close attention to the market quality of our products, or their ability to offer liquidity and efficient access to markets in varying market conditions.
The first component of our investment performance framework is precision. One of the most important criteria in measuring the performance of index products is how well they deliver or track index returns — and their ability to do so consistently over time. This also includes assessing how efficiently the funds manage index rebalances to optimise outcomes for investors.
For ETFs, iShares uses a second component to measure investment performance: market quality or their ability to offer liquidity, price discovery, and efficient access to markets in varying market conditions. To measure the market quality of an ETF, it is important to consider metrics that span both primary and secondary market activity. Importantly, these metrics must be studied holistically; when reviewed in isolation, one metric may not tell the whole story.
8. HOW DO ETFs IMPACT STOCK PRICES?
Questions sometimes arise about whether ETFs influence the prices of the stocks they hold. In short, the majority of ETF activity doesn’t affect the market prices of underlying stocks.
From the period of December 2020 through December 2022, approximately only 5.6% of equities trading volume in the largest market the U.S. has been attributable to ETF activity. In other regions these numbers are again lower. In Europe, just 1.9% of trading in individual European stocks has been attributable to ETF flows. In Asia-Pacific, this figure is even lower at 1.4%10.
9. WHAT WOULD HAPPEN IF AN AUTHORISED PARTICIPANT OR MARKET MAKER WITHDREW FROM THE ETF MARKET?
An authorised participant (AP) is a financial institution that manages the creation and redemption of ETF shares in the primary market. Each AP has an agreement with an ETF sponsor that gives it the right (but not the obligation) to create and redeem ETF shares. APs may act on their own, or on behalf of market participants.
Market makers are broker-dealers that regularly provide two-sided (buy and sell) quotes to clients. In some instances, an ETF’s market makers may also be APs.
APs and market makers operate in a highly competitive environment and are economically incentivised to take part in making or trading ETF shares.
Historically, if an AP has withdrawn from the ETF market, other APs have stepped in to facilitate the creation and redemption of ETF shares, particularly if there was a significant premium or discount to its net asset value (NAV), or difference between the price of the ETF and its underlying holdings. This is because APs generally seek to take advantage of economic arbitrage opportunities arising from that difference (for example, if an ETF is trading at a price above its NAV, an AP could buy the underlying securities and exchange them with the ETF issuer for newly created ETF shares, which may then be sold in the market for a profit).
That same incentive holds true for market makers as well. A market maker regularly provides two-sided (buy and sell) quotes to clients on the exchange. Market makers are key liquidity providers in the ETF ecosystem that ensure continuous and efficient ETF trading in the secondary market.
The role of a market maker is distinct from the role of an AP, though both are necessary for robust ETF trading activity. A market maker does not need to be an AP, nor does an AP need to be a market maker. Still, some firms play both roles in certain ETFs. Ultimately it is this “arbitrage mechanism” that helps keep the ETF’s market price close to the value of its underlying holdings each day.
In Australia, each listed ETF is required to have a designated market maker, this market maker has set obligations to provide a minimum quantity at a spread up to a defined maximum schedule for at least 80% of the time during market hours. These obligations are set out in a contract with the ETF issuers.
iShares have multiple market makers on all ETFs including but not limited to the designated market maker.
Examples of market makers include JP Morgan, BNP Paribas, Susquehanna, Jane Street and Nine Mile Financial.
10. WHAT ROLE DO ETFs PLAY IN PRICE DISCOVERY?
Price discovery helps investors identify the proper market price of securities or other instruments based on factors like supply and demand. The on-exchange trading of ETFs plays an important role in price discovery across markets, sectors and individual stocks. ETF flows provide crucial information. As greater numbers of investors use ETFs to express their views, flows from one asset to another can serve as indicators of investor sentiment about potential risk and return. Note that ETFs don’t set prices or drive volatility. They hold up a mirror to what investors are thinking.
11. ARE ETFs FOR TACTICAL TRADING OR LONG-TERM HOLDING?
ETFs can be used for a variety of reasons, such as a financial instrument for a tactical decision or as a tool for efficient market access as a long term buy and hold in an investor’s portfolio. With a multitude of use cases, it’s not surprising that ETFs are used by all types of investors.
12. WHY DO FIXED INCOME ETFs ONLY HOLD A SUBSET OF INDEX CONSTITUENTS?
Unlike equity markets, the bond market is highly fragmented and opaque. There are hundreds of thousands of unique fixed income securities. Furthermore, unlike equity securities, most bonds don’t trade on a given day. These attributes of the bond market can make it challenging for a bond fund to attempt full replication of bond indexes which can include thousands of securities.
Accordingly, ETFs tracking such indexes are generally “sampled” (i.e., they hold a subset of securities that meet the risk profile and characteristics of the parent index to seek the index exposure). iShares Portfolio Managers evaluate which bonds to select for fixed income ETF portfolios through a systematic process that includes evaluating multiple risk and liquidity factors while seeking to match the risk and characteristics of the benchmark index.
The creation and redemption baskets — the securities delivered by an Authorised Participant to the ETF for a creation of ETF shares, and vice versa for a redemption of ETF shares — generally aim to be representative of the broader index to maintain the ETF’s investment objective of tracking the index. Sampled baskets lead to a reduced security count relative to the reference index, but the presence of fewer securities does not automatically translate into concentration of risk.
1 Source: International Organization of Securities Commission “Exchange Traded Funds Thematic Note – Findings and Observations during COVID-19 induced market stresses” (August 2021).
2. European Equity (ex-ETFs) represented by the market capitalization of the Russell 3000 Index. As of June 30, 2023. Source: BlackRock, Markit and Bloomberg
3. European Equity (ex-ETFs) represented by the market capitalization of STOXX Europe 600 Index. As of June 30, 2023. Source: Bloomberg, BlackRock, Markit
4. Equity (ex-ETFs) represented by the market capitalization of the MSCI Asia Pacific All Country Index. As of June 30, 2023. Source: BlackRock, Markit Bloomberg.
5. This reflects outstanding debt issued by the residents of the U.S. As of December 31, 2022. The size of U.S.-listed fixed income ETF market is as of June 30, 2023. Source: BlackRock, Markit, Bank for International Settlements (BIS).
6. This reflects outstanding debt issued by the residents of the Euro area. As of January 31, 2023. The size of the Europe-listed fixed income ETF market. As of June 30, 2023. Source: BlackRock, Markit, European Central Bank.
7. This reflects outstanding debt issued by the residents of Australia, China, Hong Kong, Japan, Malaysia, Philippines, Singapore, and Thailand. As of December 31, 2022. The size of the Asia-Pacific-listed fixed income ETF market is as of June 30, 2023. Source: Bank for International Settlements (BIS), BlackRock, Markit.
8. Equity market capitalization is represented by the S&P/ASX All Ordinaries Index. Bloomberg, BlackRock, ASX as at 30 September 2023.
9. As of June 30, 2023. Source: Bank for International Settlements (BIS), BlackRock, MSCI.
10. As of June 30, 2023. Source: Bloomberg, BlackRock.
DISCLAIMER
This information has been provided by BIMAL for WealthHub Securities Limited (WSL) (ABN 83 089 718 249)(AFSL No. 230704). WSL is a Market Participant under the ASIC Market Integrity Rules and a wholly owned subsidiary of National Australia Bank Limited (ABN 12 004 044 937)(AFSL No. 230686) (NAB). NAB doesn’t guarantee its subsidiaries’ obligations or performance, or the products or services its subsidiaries offer. This material is intended to provide general advice only. It has been prepared without having regard to or taking into account any particular investor’s objectives, financial situation and/or needs. All investors should therefore consider the appropriateness of the advice, in light of their own objectives, financial situation and/or needs, before acting on the advice. Past performance is not a reliable indicator of future performance. Any comments, suggestions or views presented do not reflect the views of WSL and/or NAB. Subject to any terms implied by law and which cannot be excluded, neither WSL nor NAB shall be liable for any errors, omissions, defects or misrepresentations in the information or general advice including any third party sourced data (including by reasons of negligence, negligent misstatement or otherwise) or for any loss or damage (whether direct or indirect) suffered by persons who use or rely on the general advice or information. If any law prohibits the exclusion of such liability, WSL and NAB limit its liability to the re-supply of the information, provided that such limitation is permitted by law and is fair and reasonable. For more information, please click here.
IMPORTANT INFORMATION
Issued by BlackRock Investment Management (Australia) Limited ABN 13 006 165 975, AFSL 230 523 (BIMAL).
This material provides general information only and does not take into account your individual objectives, financial situation, needs or circumstances. Before making any investment decision, you should assess whether the material is appropriate for you and obtain financial advice tailored to you having regard to your individual objectives, financial situation, needs and circumstances. Refer to BIMAL’s Financial Services Guide on its website for more information. This material is not a financial product recommendation or an offer or solicitation with respect to the purchase or sale of any financial product in any jurisdiction.
Information provided is for illustrative and informational purposes and is subject to change. It has not been approved by any regulator.
This material is not intended for distribution to, or use by, any person or entity in any jurisdiction or country where such distribution or use would be contrary to local law or regulation. BIMAL is a part of the global BlackRock Group which comprises of financial product issuers and investment managers around the world. BIMAL is the issuer of financial products and acts as an investment manager in Australia.
BIMAL, its officers, employees and agents believe that the information in this material and the sources on which it is based (which may be sourced from third parties) are correct as at the date of publication. While every care has been taken in the preparation of this material, no warranty of accuracy or reliability is given and no responsibility for the information is accepted by BIMAL, its officers, employees or agents. Except where contrary to law, BIMAL excludes all liability for this information.
Any investment is subject to investment risk, including delays on the payment of withdrawal proceeds and the loss of income or the principal invested. While any forecasts, estimates and opinions in this material are made on a reasonable basis, actual future results and operations may differ materially from the forecasts, estimates and opinions set out in this material. No guarantee as to the repayment of capital or the performance of any product or rate of return referred to in this material is made by BIMAL or any entity in the BlackRock group of companies.
No part of this material may be reproduced or distributed in any manner without the prior written permission of BIMAL.
©2024 BlackRock, Inc. or its affiliates. All Rights reserved. BLACKROCK, BLACKROCK SOLUTIONS, ALADDIN, iSHARES and the stylised i logo are registered and unregistered trademarks of BlackRock, Inc. or its affiliates. All other trademarks are those of their respective owners.