Is high Australian household wealth a source of support for consumers?
Diana Mousina | AMP
Household income data from the OECD showed that Australia had one of the lowest rates of annual real household disposable income per person compared to its OECD peers (see the chart below).
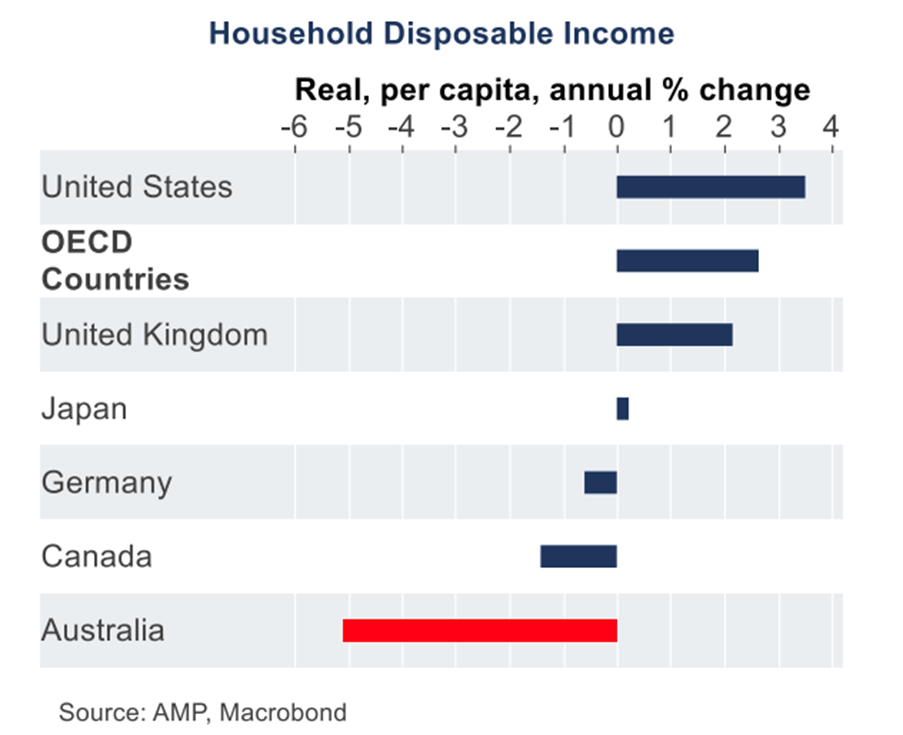
Over the year to June, Australia’s real per capita household disposable income was down by 5.1%, compared to a 2.6% rise across OECD countries.
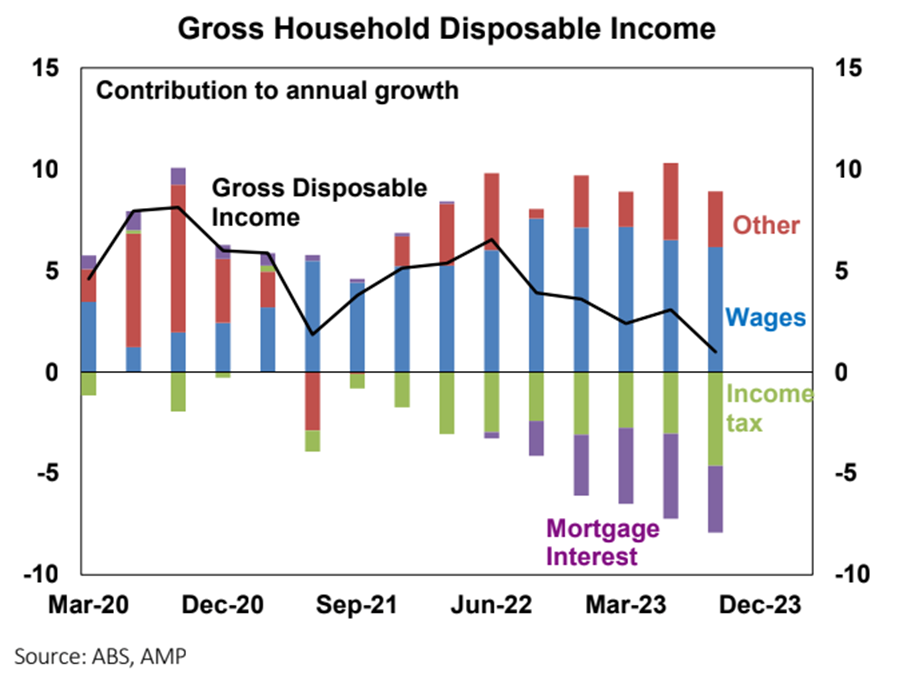
This occurred despite very healthy labour market conditions in Australia which saw employment growth running above 3% per annum all year, the unemployment rate remaining below 3.9% and underemployment continuing to be low, all of which boosted wage growth. Despite this positive earnings backdrop, the income tax burden increased in 2023 as households have been moving into higher income tax brackets (otherwise known as “bracket creep”) as well as the end of income tax concessions.
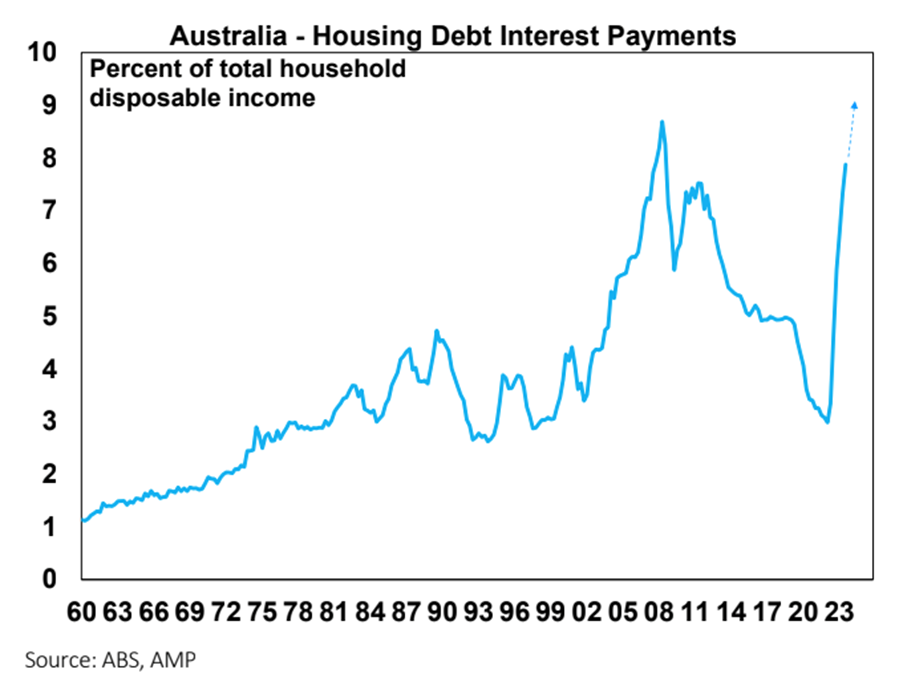
Mortgage interest repayments are also an increasing drag on incomes (see the chart below) as the cash rate has been increased by 425 basis points since May 2022. Australia’s very high population growth in 2023 (running at 2.4% over the year to June 2023) also masked a fall in household disposable income growth per person, relative to other OECD countries.
Just looking at household income accounts does not show everything about the position of households. In a country like Australia where homeownership rates are high (66% of Australian households own their home with or without a mortgage), looking at household wealth is also important.
Household wealth in Australia
The Australian Bureau of Statistics estimates the value of a household’s assets, liabilities and therefore wealth. Net worth or wealth is calculated as a household’s total assets minus its liabilities. Total wealth is close to 11 times the size of household disposable income (or 1083%) and net wealth is 896% of income.
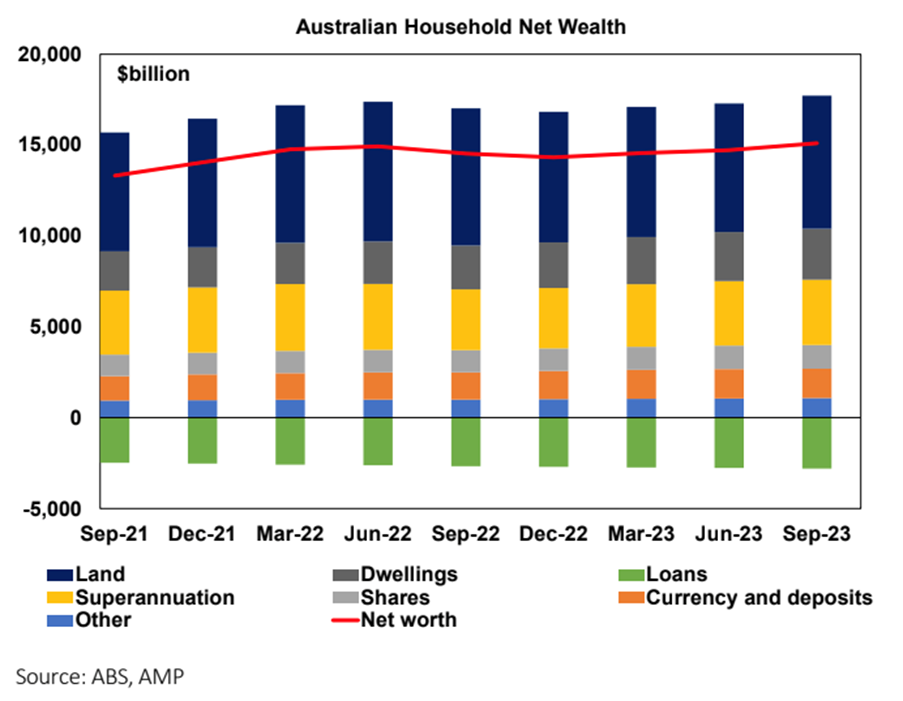
The latest data for the year to June 2023 showed a slight fall in wealth as a share of income after it reached a record high in 2022 – see the chart below. Non-financial wealth is worth 647% of income, larger than financial wealth at 436% and well-surpassing household debt, which is 187% of income.
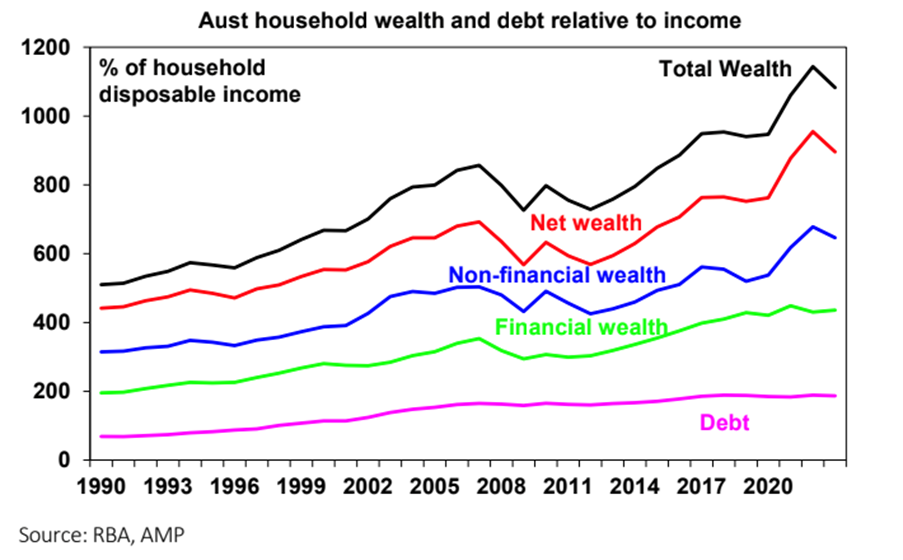
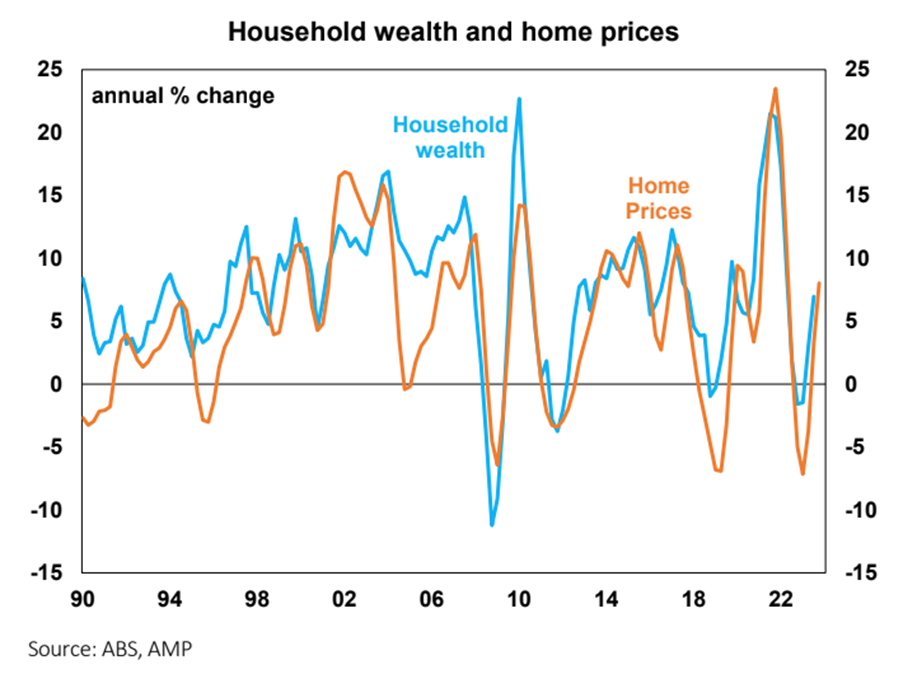
Around 70% of Australian household wealth is tied to the value of homes (which are made up of land and dwellings) and moves closely in line with home prices (see the chart below). Household wealth rose throughout 2023, in line with solid growth in home prices.
Other components of household wealth are shown in the chart below. Assets include superannuation, shares currency and deposits. Loans which are mostly for housing are the source of household liabilities.
How does household wealth compare around the world?
Australian household wealth as a share of household disposable income is at the top end of its OECD peers (see the chart below).
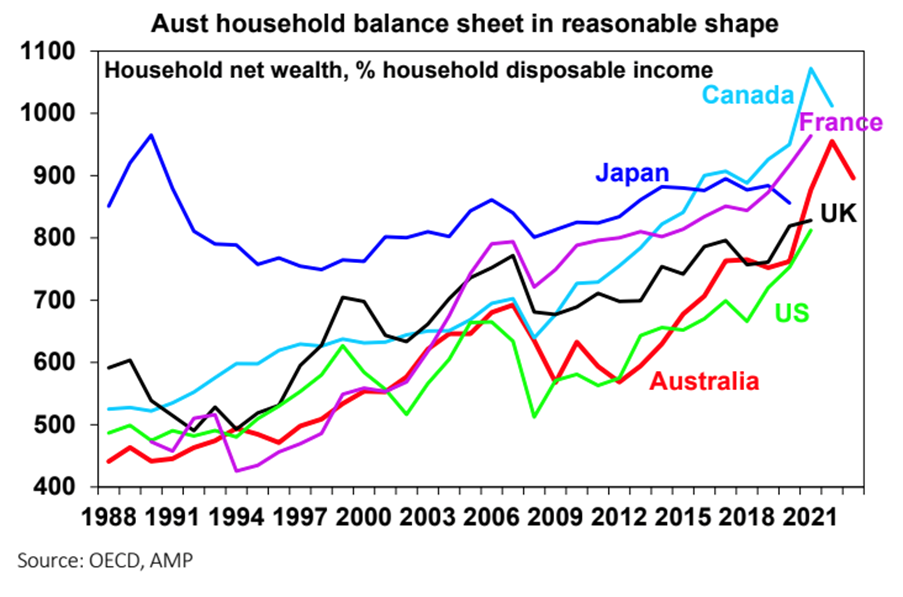
High holdings of wealth could be considered a source of support for households, especially against record levels of household debt in Australia.
This is a concept known as the “wealth effect”. When household wealth increases, households feel more secure with their financial position and household savings tend to decrease which lifts consumer spending. When wealth decreases, households feel less secure which leads to an increase in savings and a decline in spending.
However, this relationship does not always work. Most recently in the pandemic, household wealth rose in 2021/22 alongside the lift in home prices but the savings ratio also surged thanks to government-driven stimulus cheques. Since then, the household savings ratio has been falling but growth in total consumer spending has been low.
We expect that the household savings rate will continue to fall in 2024 as it normalises after the pandemic but growth in consumer spending will still be low.
Implications for investors
Households dealt with a cost-of-living challenge in 2023 because of high inflation and rising interest rates. Inflation is expected to slow in 2024 and we expect the RBA to start cutting interest rates by mid-year which should ease the repayment burden for households with a mortgage, as mortgage interest repayments as a share of income are rising to a record high (see the chart below).
So, while cost-of-living issues should improve for consumers, household wealth will come under pressure in 2024 as we expect home prices will decline by 3-5%. This is likely to occur alongside a slowing in household incomes as the labour market weakens and the unemployment rate increases. This environment is expected to be negative for consumer
spending and GDP growth. We see GDP growth rising by 1.2% over the year to June 2024, below the RBA’s forecast of 1.8% and anticipate the unemployment rate to increase to 4.5% by mid-year. This should see the RBA cutting interest rates by June and we expect a total of 3 rate cuts in 2024.
Wealth inequality between households is also an issue in Australia. The top 20% of households (by income quintile) owned 63% of the total household wealth in 2019-20 but the bottom income quintile (the bottom 20%) owned less than 1% of all household wealth.
In Australia, there is also an increasing generational wealth gap, with wealth across older households, increasing significantly over recent decades but this has not been the case for younger Australians. Numerous government policies could address these issues of wealth inequality including improving the housing affordability issue (through lifting the housing supply and/or looking at the favourable treatment of housing investment) and doing a tax review (looking at broadening the GST and examining the merits of a wealth or death tax) which could help the wealth inequality issue.
Learn how the industry leaders are navigating today's market every morning at 6am. Access Livewire Markets Today.
All prices and analysis at 9 January 2024. This document was originally published on Livewire Markets website on 9 January 2024. This information has been prepared by AMP Bank Limited ABN 15 081 596 009, AFSL No. 234517.
The content is distributed by WealthHub Securities Limited (WSL) (ABN 83 089 718 249)(AFSL No. 230704). WSL is a Market Participant under the ASIC Market Integrity Rules and a wholly owned subsidiary of National Australia Bank Limited (ABN 12 004 044 937)(AFSL No. 230686) (NAB). NAB doesn’t guarantee its subsidiaries’ obligations or performance, or the products or services its subsidiaries offer. This material is intended to provide general advice only. It has been prepared without having regard to or taking into account any particular investor’s objectives, financial situation and/or needs. All investors should therefore consider the appropriateness of the advice, in light of their own objectives, financial situation and/or needs, before acting on the advice. Past performance is not a reliable indicator of future performance. Any comments, suggestions or views presented do not reflect the views of WSL and/or NAB. Subject to any terms implied by law and which cannot be excluded, neither WSL nor NAB shall be liable for any errors, omissions, defects or misrepresentations in the information or general advice including any third party sourced data (including by reasons of negligence, negligent misstatement or otherwise) or for any loss or damage (whether direct or indirect) suffered by persons who use or rely on the general advice or information. If any law prohibits the exclusion of such liability, WSL and NAB limit its liability to the re-supply of the information, provided that such limitation is permitted by law and is fair and reasonable. For more information, please click here.