RBA flags risk of higher rates
Christopher Joye | Coolabah Capital
Over at the AFR I write that the Reserve Bank of Australia’s latest freedom of information disclosures reveal a great deal about its frame of mind, with many important takeaways for investors.
Perhaps the most interesting news is that the RBA has materially upgraded its assumptions regarding the so-called neutral cash rate, which it now believes is 3.8 per cent. Crucially, that is in line with the current cash rate.
In theory, the neutral rate is the monetary policy posture that is neither stimulatory nor contractionary. At face value, the RBA’s 3.85 per cent cash rate is, therefore, unlikely to be compatible with the interest rate settings required to deal with the biggest inflation crisis in 40 years, especially given the recent acceleration in demand-driven services inflation.
The latter has superseded the supply-side goods inflation that precipitated this shock as a result of the closing of the global economy and its supply chains during the pandemic.
The RBA has clearly been agonising over whether its cash rate is too low relative to the rest of the world. The US has a cash rate setting of 5.25 per cent, New Zealand is at 5.25 per cent, and the United Kingdom and Canada are at 4.5 per cent. Yet, Australian goods, services and core inflation are all equal to, or worse than, that of the US.
Our unemployment rates are also almost identical at circa 3.5 per cent and materially below estimates of full employment. That implies our economies are running with excess demand, which explains the rocketing services inflation.
Historically, Australia’s cash rate has been, on average, 1.61 percentage points above the US Federal Reserve’s policy rate. We are 1.4 percentage points below, and conspicuously less than other near peers. This was presumably the narrative that RBA governor Phil Lowe rolled out during his controversial private briefing to interest rate traders at Barrenjoey, pointing towards the possibility of some mean-reversion, which is, of course, what we have seen since.
The RBA’s internal modelling lends further weight to the idea that interest rates could continue to climb.
In March, it quantified three potential scenarios. The first involved keeping the cash rate constant. The two other paths entailed lifting its rate to 4.8 per cent, or 100 basis points above the neutral rate, at a steady or faster pace. In these more aggressive moves, core inflation only reverted to the mid-point of the RBA’s 2-3 per cent band in June 2025. Keeping the cash rate steady achieved the same result by mid-2026.
Remarkably, the increase in unemployment, or the policy cost of these actions, is only very modest, with the jobless rate rising from 3.5 per cent to around 4.75 per cent by mid-2026. This is precisely where Treasury estimates “full employment” to be.
So, none of these scenarios involved an unnecessary increase in joblessness. They are simply reversing out excessively stimulatory demand-side policies.
With our previous research showing that some Australian households have squirrelled away enormous cash piles worth about 20 per cent of their annual incomes (care of pandemic handouts and shutdowns), and with the great housing correction having temporarily stalled, the RBA presumably thinks there are few downside risks to getting core inflation back to its target in two years, rather than three. This would require it to nudge up the cash rate to 4.5-5 per cent – in line with global peers.
Where pressure will play out
Of course, a higher cost of capital will inevitably lift the lid on weaker parts of the economy and, more specifically, those borrowers who cannot service their debts in a normal rates world. With this in mind, we have continued to keep a close eye on the home loan arrears (or non-repayments) reported by both regulated banks and their unregulated non-bank rivals.
Starting at first principles, we inspect the raw, unadjusted home loan arrears publicly disclosed by banks and non-banks across all the loans they originate, and then securitise, or sell, via bonds known as residential mortgage-backed securities.
The insights are clear: non-bank lenders originate loans with much higher default rates and hence risk of loss. Across all RMBS issues, the 30 days or more arrears rate for non-bank lenders is more than four times higher than equivalent bank non-repayment rates.
One problem when looking at home loan portfolios backing RMBS is that there are many biases that can artificially increase or decrease the official arrears numbers. The biggest bias is that all new RMBS deals come to market backed by a portfolio of home loans that is completely default-free. Lenders carefully select these loans to ensure none of the borrowers in the pool are behind on their repayments.
Accordingly, a new, say, $1 billion RMBS portfolio that is added to the official arrears index, such as S&P’s SPIN indices, will mechanically drag down the index’s overall arrears rate in a completely fallacious fashion.
Bias problem
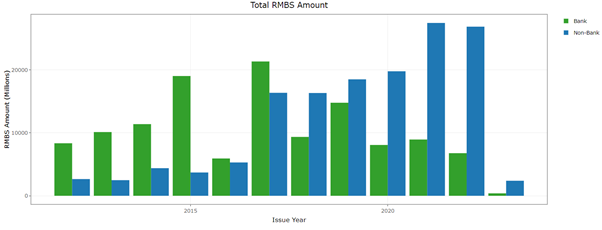
This drives a particularly strong bias in bank versus non-bank arrears rates because of differentials in RMBS issuance. In recent years, banks have issued very little RMBS because it has been much cheaper to raise money via deposits and bonds. Non-banks, on the other hand, have been massive and continuous issuers of RMBS given it is their only source of finance.
Source: Livewire Markets, 2023
Chart 1: Non-Bank RMBS Issuance has Massively Exceeded Banks in Recent Years
In 2018, Coolabah published detailed academic research to address these measurement problems. We developed a compositionally adjusted RMBS arrears index that controlled for the date on which RMBS is issued, and several other factors that bias an index’s reported arrears rate up or down.
These other variables include the average life of the loan (default rates tend to peak after three years), the average loan-to-value ratio (higher LVRs are associated with greater default risks), the geographic distribution of the loans (different regions have higher or lower default probabilities), and the borrower’s characteristics (eg, investors versus owner-occupiers).
Our research demonstrated that raw or naive RMBS arrears indices are indeed enormously biased unless you control for these factors using a “hedonic”, regression-based approach that is similar to the compositional adjustment methodologies we developed for CoreLogic’s house price indices and those used by global statistical agencies for accurately measuring inflation. The RBA has since leveraged off our research in its own RMBS studies.
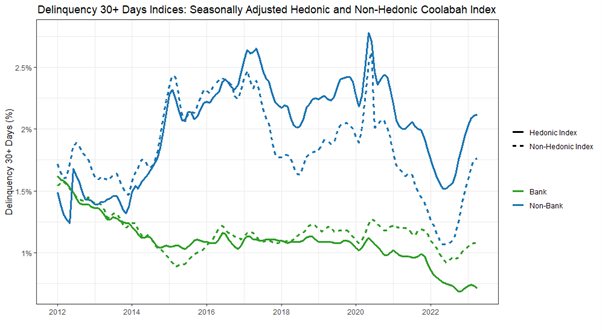
When we look at all non-bank and bank-issued home loans, the non-banks have much higher arrears rates on an unadjusted basis. After we apply our hedonic, regression-based compositional adjustment, the arrears rates suffered by non-banks increases materially, while banks’ reported arrears rates decline (ie, the gap widens).
Source: Livewire Markets, 2023
Chart 2: Non-Bank RMBS Home Loan Arrears are Much Higher than Banks - Even More So After Compositional-Adjustment via Hedonic Methods
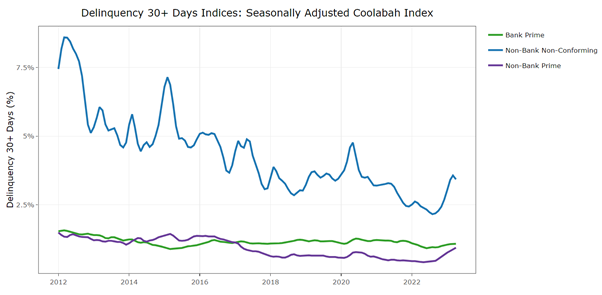
Another approach is to cherry-pick non-bank loans such that you ignore all their risky products and only consider the “prime” (or high-quality) home loans that are more comparable to normal bank mortgages. Once again, if you only examine the raw data, you would arrive at the completely spurious and counter-intuitive conclusion that unregulated non-bank lenders actually have lower home loan default rates than the much more intensively regulated banks.
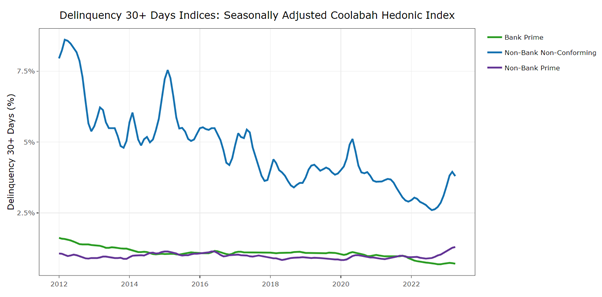
Yet, when one removes the new issue bias by applying our hedonic compositional adjustment, we find that prime, non-bank home loan default rates are very similar to the default rates reported on the banks’ prime home loans, which makes sense given both are classified as prime (ie, not sub-prime).
Source: Livewire Markets, 2023
Chart 3: On an Unadjusted Basis, Non-Bank Prime Home Loan Arrears Look Lower than Bank Prime Arrears if You Ignore Non-Banks' Riskier Loans (Lower Two Lines)
Source: Livewire Markets, 2023
Chart 4: But Hedonic Compositional-Adjustment Shows that Bank and Non-Bank Prime Home Loan Arrears are Very Similar - Except for Recent Non-Bank Spike
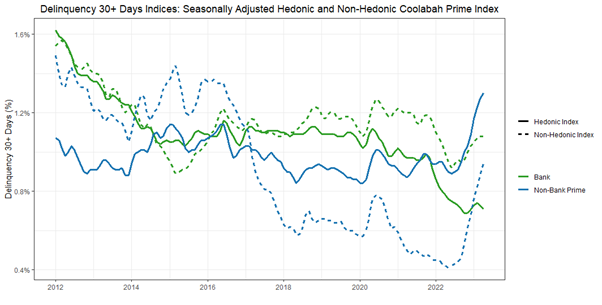
Source: Livewire Markets, 2023
Chart 5: Same Chart As Above, Just Excluding All Non-Bank Loans and Focusing Only on Prime Loans - Observe Recent Spike in Non-Bank Arrears that Cannot be Seen in Bank Data
What is interesting is that since mid-2022, the arrears rate on prime, non-bank home loans has jumped to its highest level since our data set began in 2012, whereas the banks’ prime arrears rates have yet to increase materially. This suggests that non-banks are, in fact, writing riskier prime loans than the banks given their borrowers have responded much more poorly to the RBA’s rate increases.
In the non-banks’ other sub-prime (or non-conforming) home loans, we also document a sharp recent spike in arrears since mid-2022, although that remains below prior peaks, which it will likely surpass.
In our own due diligence, we have found that large banks are much more sophisticated and capable when it comes to assessing and managing credit risks than non-banks. Non-banks often use the 2008 crisis as their worst-case scenario, which in Australia involved only a modest increase in unemployment and did not trigger a recession.
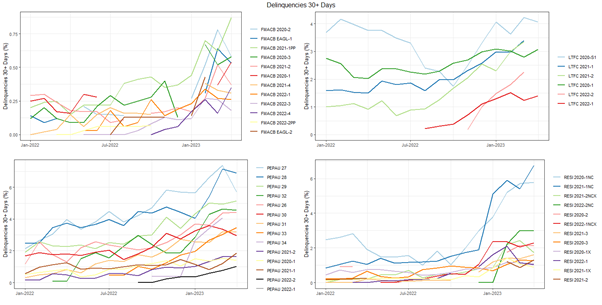
Source: Livewire Markets, 2023
Chart 6: Home Loan Arrears Reported for Individual RMBS Deals issued by FirstMac, LaTrobe, Pepper and Resimac...
Banks, by way of contrast, stress test using the 1991 recession, which was orders of magnitude worse. Banks also have much larger and more sophisticated risk teams, access to many diverse sources of funding, including deposits and bonds, and the benefit of central bank liquidity and government guarantees. The price of all this support is hellishly tough supervision by a notoriously brutal banking cop, the Australian Prudential Regulation Authority.
For Australia’s inflation rate to subside, we will also need more productivity to rationalise the brisk rates of wage growth. This will in turn demand radical attitudinal change from entitled millennials who have never experienced high inflation, high rates or a protracted recession.
In my first 12 months of work at Goldman Sachs in London in 2000, I pulled more than 90 all-nighters — that is, I worked two days consecutively without sleep. World-class sporting, military and professional teams are obsessively committed to excellence, which does not always sit easily with the soft work-life balance ideals of twenty- and thirty-somethings. A recession might be the shock required to imbue these folks with a stronger sense of what world-class performance really requires.
Learn how the industry leaders are navigating today's market every morning at 6am. Access Livewire Markets Today.
Christopher Joye is Chief Investment Officer at Coolabah Capital. All prices and analysis at 15 May 2023. This information was produced by Christopher Joye and published by Livewire Markets (ABN 24 112 294 649), which is an Australian Financial Services Licensee (Licence No. 286 531). This material is intended to provide general advice only. It has been prepared without having regard to or taking into account any particular investor’s objectives, financial situation and/or needs. All investors should therefore consider the appropriateness of the advice, in light of their own objectives, financial situation and/or needs, before acting on the advice. This article does not reflect the views of WealthHub Securities Limited.