Mega-caps, rebounding global growth, and mild Gulf inflation
This week’s charts begin with a visualisation of how the biggest stocks, mostly tech, have driven the S&P 500’s recent gains. Speaking of stocks, we analyse the “sell in May and go away” strategy. We offer up two “heat maps”: one showing how global growth has been surprisingly strong in 2023; another tracks the EU nation by nation, showing which ones have entered recession. We take an overview of inflation in the Gulf Cooperation Council, where price increases have been much less pronounced than in the US and Europe. We examine how more Americans are struggling with their credit-card bills. And finally, we take sweeping views of recent US history: we track a measure of policy uncertainty over 20 years of news headlines, and examine the relationship between rate hikes and unemployment.
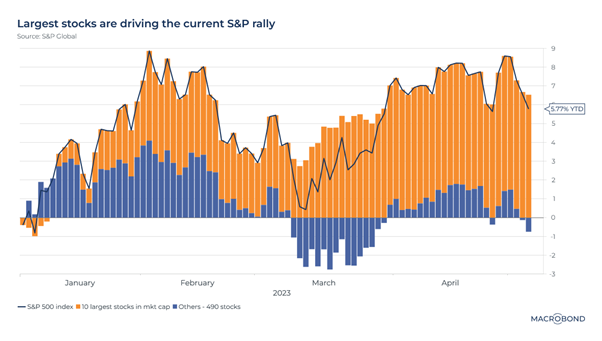
THE POST-FAANG MEGA-CAPS ARE DRIVING THE US STOCK RALLY
Source: Macrobond Financial 2023
The biggest stocks are leading this year’s stock rally.
Our visualisation breaks down the year-to-date gain by the S&P 500, showing how the 10 biggest names by market value are overwhelmingly responsible for the rally – especially since March, when bank failures dented confidence in much of the rest of the equity space.
Most of these names are in Big Tech, evoking the “FAANG” surge that drove the 2010s. (That’s Facebook, Amazon, Apple, Netflix and Google – before a few name changes made that acronym obsolete.)
Today, the top 10 are Apple, Microsoft, Amazon, Nvidia, Alphabet (counting both stock classes as a single company), Berkshire Hathaway, Meta, UnitedHealth, ExxonMobil and Tesla.
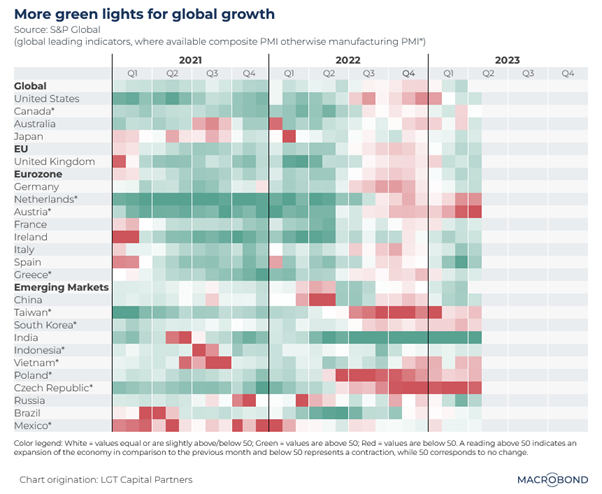
THE GREAT GLOBAL GROWTH SURPRISE OF 2023
Source: Macrobond Financial 2023
One of the positive surprises for 2023 is how resilient global growth has been, despite a record monetary tightening cycle.
This chart uses measures of the purchasing managers index (PMI), which surveys executives about prevailing trends in their industry, to track the outlook in nations around the world. Readings below 50 indicate contraction.
It seemed that we were headed towards a broad recession in the second half of last year. But PMI is back above 50 for most economies.
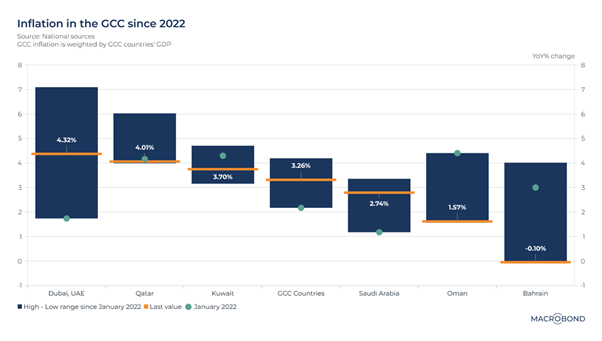
INFLATION IN GULF NATIONS HAS BEEN NO BIG DEAL – AND SOMETIMES NONEXISTENT
Source: Macrobond Financial 2023
There’s a place in the world where inflation has not been particularly rampant over the past year: the oil-producing nations of the Gulf Cooperation Council (GCC).
As our chart shows, annualised inflation is running at about 3.3 percent for the GCC as a whole, much slower than the rate in the US and eurozone. The year-on-year comparisons are enlightening, as well. While Saudi inflation has picked up, Oman and Kuwait have experienced disinflation since January 2022; Bahrain is in outright deflation.
Five of the six GCC economies peg their currencies to the dollar, which can help keep inflation in check. Governments have also tended to use their oil wealth to proactively manage food and energy prices using subsidies.
Interestingly, booming Dubai, whose role as a global hub makes its economy quite different from the rest of the region, is experiencing the steepest pickup in inflation.
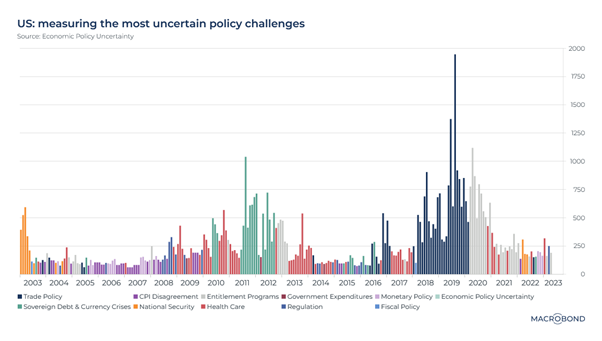
WHAT’S IN THE NEWS? MEASURING PERCEPTIONS OF TRADE, WAR AND PANDEMIC
Source: Macrobond Financial 2023
Economic Policy Uncertainty (EPU) is an academic group that uses newspaper archives to create indices relating to policy challenges ranging from budgets to geopolitics.
Effectively, by tracking headlines, EPU shows us the issue, or “dominant uncertainty,” that was top of mind at a given moment for the media, and, by extension, for the policy-making class.
We’ve previously charted their overall geopolitical risk index. This time, our chart examines EPU’s subindexes for the US, highlighting the issue that had the greatest risk perception over 20 years.
National security was top of mind in 2003, during the US invasion of Iraq, and again in the first half of 2022 as Russia invaded Ukraine. Europe’s sovereign-debt crisis rears its head in 2011-12. As the Trump and Biden administrations grappled with pandemic support and stimulus, “entitlement programs” are prominent in 2020-21.
Interestingly, Donald Trump’s 2018-19 trade war with China provoked a higher risk perception than any other issue tracked by EPU.
MORE AMERICANS STRUGGLE WITH CREDIT CARD DEBT AGAIN – RELATIVELY SPEAKING
As interest rates go up and the economy slows, figures from the New York Fed show us that more Americans – especially younger ones – are struggling with debt burdens.
This chart tracks the percentage of credit-card balances transitioning into “serious delinquency.” This figure jumped by 2.5 percentage points for the 18-29 age bracket in 2022.
However, a longer-term perspective shows that credit-card struggles are only just returning to their pre-Covid levels – after extraordinary levels of subsidy to consumers and businesses through the pandemic.
MONETARY TIGHTENING AND FALLING UNEMPLOYMENT
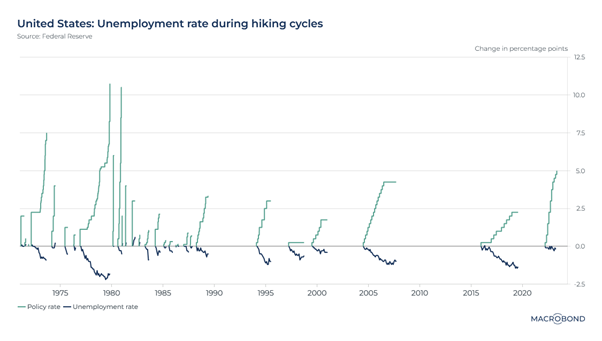
Source: Macrobond Financial 2023
Intuitively, one might expect to see unemployment shoot up when policy makers stamp on the monetary brakes. But as our chart shows, that confuses the cause-and-effect relationship in real time.
History shows that tightening cycles usually progress as an economy gathers pace and sometimes overheats. I.e.: the labour market strengthens, unemployment falls, the Fed hikes. In 1980, 1995 and 2007, the unemployment rate stopped falling or crept higher only as the Fed came to the end of a round of tightening.
The present cycle stands out; with the Fed hiking rapidly during a time of post-pandemic labour shortages, US unemployment did not have that much lower to go.
SELL IN MAY AND GO AWAY? ONLY IN EUROPE
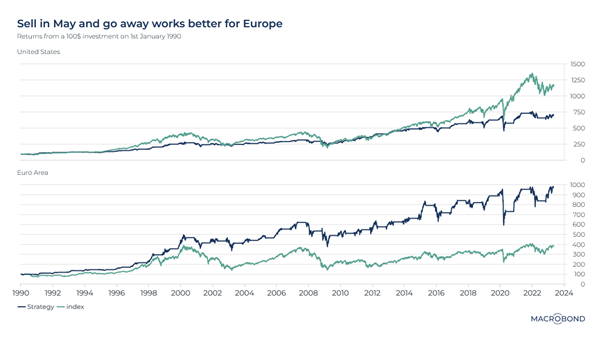
Source: Macrobond Financial 2023
A hoary stock-market cliché effectively advises investors to take the summer off. The theory goes that limited liquidity and slow news flow means there will be fewer bids for equities until most market participants return to their desks.
Using the Macrobond Investment strategy function, we examined the returns since 1990 for a hypothetical investor that exited the markets between May and October each year. We applied this test to the S&P 500 and the Euro Stoxx 50.
“Sell in May and go away” allegedly dates to the old-time London markets. If this strategy ever paid off on Wall Street, our chart suggests that it hasn’t since at least 1990. But in the EU, taking more time off isn’t just a cultural tradition; it can be profitable too.
ASSESSING COUNTRY-BY-COUNTRY RECESSION IN THE EU
This table measures quarter-on-quarter economic growth for the 27 nations in the European Union. Green means expansion; red means contraction. And a standard definition of recession is two consecutive quarters of negative growth.
As first-quarter 2023 figures trickle in, Lithuania has entered recession, joining Finland, Estonia and Hungary. Interestingly, some nations have already rebounded from recessions in 2022, such as the Czech Republic and Latvia.
Will more nations start flashing red as the ECB continues to tighten monetary policy? Christine Lagarde, who raised rates yesterday, signaled that there may be "more ground to cover" to control inflation.
Learn how the industry leaders are navigating today's market every morning at 6am. Access Livewire Markets Today.
Macrobond Financial synthesises macroeconomic and financial data. All prices and analysis at 8 May 2023. This information was produced by Macrobond Financial and published by Livewire Markets (ABN 24 112 294 649), which is an Australian Financial Services Licensee (Licence No. 286 531This material is intended to provide general advice only. It has been prepared without having regard to or taking into account any particular investor’s objectives, financial situation and/or needs. All investors should therefore consider the appropriateness of the advice, in light of their own objectives, financial situation and/or needs, before acting on the advice. This article does not reflect the views of WealthHub Securities Limited.