Why Silicon Valley Bank collapsed – and what it means
Chris Joye | Coolabah Capital
Our biggest themes since 2021 have been much higher interest rates hammering equities, bonds, property, and crypto, amongst others, and eventually triggering recessions and default cycles. We have also relentlessly asserted that illiquidity is concealing many hidden risks. All these dynamics have come strikingly into play with the collapse (and default on its deposits and loans) on Friday of the highly tech-centric US regional bank, Silicon Valley Bank (SIVB). The demise of SIVB follows on from the liquidation of the crypto-focused Silvergate Bank, which went into insolvency days prior.
SIVB has been placed in receivership and is now under the control of the Federal Deposit Insurance Corporation (FDIC). The FDIC has said that it will pay-out 100% of the value of SIVB's ~US$21 billion of insured deposits on Monday, and make a payment to the US$152 billion of uninsured depositors within a week (nb: all future $ references will be US$). SIVB also issued debt securities to brand-name institutional investors, which are presumably worthless right now. Given its very valuable and well-heeled tech clientele, it is likely that SIVB will be gobbled-up in part or whole by a much larger bank in the coming days/weeks.
This event has rocked financial markets with US stocks falling 3.9% and government bond prices soaring as long-term yields slump: the US 10-year government bond yield has fallen from 4.05% a few days ago to 3.70% today, which is a chunky move. Ironically, this reduction in yields would have materially boosted the value of SIVB's $116 billion securities portfolio, as we will explain later.
In this note, I will lift the lid on why SIVB died. While media have picked-up on pieces of the story, there have been few comprehensive explanations of all the moving parts aside from perhaps via ZeroHedge. The first-order triggers are very simple. The second-round effects are more complex. But it is worth quickly summarising. In short (excuse the pun), the collapse occurred because:
- SIVB was unusually concentrated on effectively one industry, and to some extent, geographic sector, which was the Silicon Valley tech industry (including tech, life sciences and healthcare). Tech provided almost all SIVB's deposit funding. And the vast bulk of SIVB's loans also went to tech. As the US Federal Reserve's hiking cycle smashed the tech industry, as we argued it would in late 2021 (see also here), SIVB started losing deposits at a very rapid rate. Over 2022, it lost ~$25 billion in deposits. By March 2023, this had accelerated to more than ~$30 billion in deposit outflows. On Thursday last week, depositors reportedly tried to pull ~$42 billion on that day alone. While this industry/geographic concentration was extreme, it is also an attribute of smaller US regional banks, which commonly collapse: since 2012, around 7 regional banks in the US have died, on average, each year. Large, diversified banks have the opposite problem right now: as investors exit riskier asset-classes, like listed equities, commercial/residential property, venture capital, private equity, and high yield debt, and start chasing attractive, 5-6% interest rates on cash, the bigger bank deposit inflows have surged while their balance-sheet growth is slowing.
- SIVB unusually appeared not to hedge any interest rate risk at all, which meant that it was not equalizing the very long-term interest rate risk on its ~$212 billion asset book with the very short-term interest rate risk on its ~$173 billion deposit (or liability) book. All large/sophisticated banks normally manage this interest rate risk (and are required to do so by regulators). Every bank on the planet runs a big asset-liability mismatch insofar as they borrow via issuing short-term (mostly at-call) deposits and lend this money out via 30 year home loans. In the US, most home loans are fixed-rate (in Australia, the vast majority are floating-rate). If interest rates increase sharply, the value of a fixed-rate debt (or loan) will fall such that the yield (coupon divided by its price) matches the new higher interest rate (the value of a floating-rate debt/loan does not change because its interest rate rises as outside yields climb). Sophisticated banks hedge their asset (or loan) books back to a typically very short-term, effectively floating, interest rate to match the interest rate profile of their deposits, which are also short-term. SIVB did not do this.
- SIVB was also remarkable because it did not lend out most of its $173 billion in deposits. Only 43% (or $74 billion) was used to fund normal loans. The remaining 57% was invested in financial market securities, most of which were ostensibly safe. The problem is that almost all these assets carried huge interest rate risks, which SIVB chose not to hedge to floating. Most bank assets are accounted for on a hold-to-maturity basis, which means they are not revalued daily: instead, they are held at their cost price. SIVB was not unusual in accounting for its assets this way. But it did mean that if it ever was subject to a run on its deposits, its assets might not be worth the original cost price that it was reporting---they might be worth materially less.
- In 2022 the Fed dramatically hiked its overnight policy rate from 0.25% to 4.75%, which lifted long-term government bond yields in the US from ~1% to ~4%. If you did not hedge your interest rate risk, this materially reduced the value of your assets. It is not a problem if you hold these assets until their maturity when you get repaid 100% of what you invested. But if you have to sell them at current, marked-to-market prices, it could be a big problem, as SIVB discovered.
- To make matters worse, SIVB actively exploited a regulatory change introduced by President Donald Trump in 2018. All large US banks have to deduct any unrealised losses on their hold-to-maturity assets from their reported regulatory equity capital ratios and are subject to tough liquidity tests (specifically, the LCR and NSFR requirements---see more below). This therefore provides investors with a clear picture of how much of an equity buffer they really hold and the liquidity that backs their liabilities (deposits and debt securities). The cut-off to be considered a large bank that is captured by this rule was $50 billion. This would have caught SIVB, which as at December 2022 had more than $200 billion in assets. But in 2018 when SIVB only had $50 billion in assets, Trump lifted the cut-off to $250 billion. This meant that SIVB's reported equity capital ratios could be artificially inflated if 1/ interest rates spiked and 2/ there was ever a run on its deposits: if SIVB had to sell assets to meet these outflows, it would incur losses, and its equity capital ratios would be reduced materially. This is precisely what happened in March 2023. SIVB announced a $2.25 billion equity raising to cover $1.8 billion in realised losses on a sale of a $21 billion fixed-rate debt portfolio. Investors then extrapolated that if there were more deposit outflows, there would be more realised losses. And the rest is history.
US regional banks regularly go bust
SIVB was a classic case of a US bank with extraordinarily concentrated geographic, credit and funding risks---amplified by exceptionally poor risk management practices---collapsing during a time of economic stress, which is an event that occurs with astonishing regularity in the US.
There are over 4,800 banks in the US, and prior to the 2008 global financial crisis that number was north of 8,000 banks. Several smaller regional banks tend to die each year due to their highly concentrated geographic/industry risks. Specifically, about 7 regional banks have died, on average, each year since 2012. If we go back to 2001, we find that about 25 banks die on average in the US each year. There was a spike in bank failures between 2008 and 2012, when 93 institutions went under each year on average. The chart below shows US bank failures by year from the FDIC.
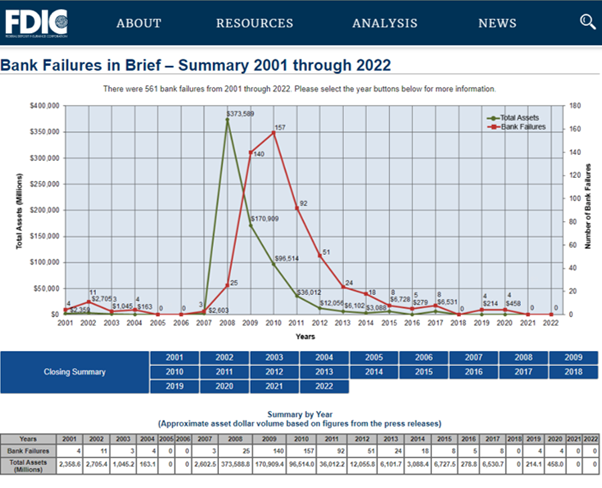
Source: Livewire Markets
SIVB was almost 100% dependent on Silicon Valley loans and deposits
About 91% of SIVB's $74 billion loan portfolio was to Silicon Valley venture capital and private equity funds, tech/life sciences/health care companies, and to the high net worth individuals running and investing in these funds. Put simply, SIVB was a major lender to the Silicon Valley tech industry---and that is pretty much all it did. There was zero diversification.
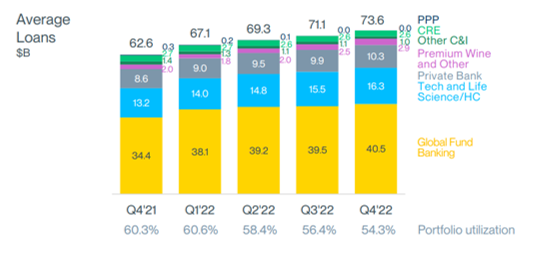
Source: Livewire Markets
This is an important lesson for investors: you want to focus on any concentrations to vulnerable industry sectors, the most obvious of which are any cyclical industries and zombie-like companies, which we discuss in greater detail below. Arguably the two biggest zombie sectors are tech and real estate, as you will see shortly.
The tech blow-up in 2022 drained ~$30 billion of deposits from SIVB
This geographic and industry concentration started to wreak havoc on SIVB in 2022 as the tech industry blew-up---with the Nasdaq slumping 36%---as the Fed began its process of lifting interest rates from 0.25% to 4.75% currently. SIVB reported that tech companies were burning through their cash deposits held at the bank while venture capital funds were understandably failing to attract new inflows, which collectively resulted in a staggering $25 billion of deposit outflows as at 31 December 2022. From Q1 2022 to Q4 2022, SIVB's deposit base shrunk from $198 billion to $173 billion. By March, it had fallen to $169 billion, representing almost $30 billion of deposit outflows. And then on Thursday last week, depositors tried to rip out another $42 billion...
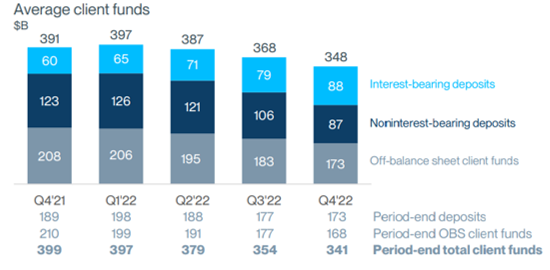
Source: Livewire Markets
Massive interest rate bets with no hedges
While SIVB was almost 100% dependent on the struggling Silicon Valley tech industry, its balance-sheet looked superficially safe if you ignored this huge industry concentration. As at 31 December 2022, SIVB had only made $74 billion of loans with its $173 billion of deposits.
This is very unusual---in fact, there was no other US lender like SIVB. Normally, banks lend-out 100% of their deposits, and then a lot more beyond this sum, which is funded by wholesale debt (ie, banks are typically funded by a combination of deposits and bonds). SIVB did have some debt securities on issue, which had been boldly bought by US, European, Asian and Australian fund managers. See the price of one below before SIVB's collapse.
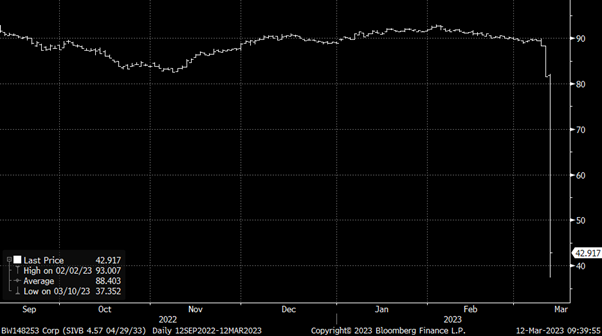
Source: Livewire Markets
In contrast to virtually all other banks, SIVB only lent about 43% of its deposits, and put the vast majority of the remaining money in other, ostensibly low risk, financial market assets. In particular, SIVB had a huge, $120 billion investment securities portfolio, which included:
- a smaller $24.6 billion (14.2% of its deposits) allocation to government bonds, and
- a larger, $75.5 billion holding of residential mortgage-backed securities (RMBS) combined with another $15.9 billion of commercial mortgage-backed securities (CMBS).
In total, SIVB allocated $91.5 billion (or 53%) of its depositors' money to RMBS and CMBS, which are, as an aside, asset-classes we have been very negative on since 2021. We have been negative simply because we have predicted large falls in residential and commercial property prices since late 2021, and a big increase in defaults. Both are toxic for RMBS and CMBS.
So SIVB had invested 67% of all its deposit money into government bonds, RMBS and CMBS instead of it lending it out. A normal US bank would have put this money into 30-year home loans, which are typically fixed-rate, rather than floating-rate, in the US.
This appeared safe, all else being equal. There was one very big problem: SIVB did not hedge the interest rate risk on these debt instruments. Now this is a fundamental and profound failing for a bank.
The first priority of any large bank is to hedge the interest rate risk on their asset book (ie, their loans) such that it matches the interest rate profile of their funding (or liability) book (ie, mainly deposits). All serious banks are 100% focussed on managing and minimising these interest rate risks.
Since most deposits are at-call, or very short-term in nature, banks hedge their assets (loans) back to a short-term floating-rate, which in turn eliminates---or radically reduces---their exposure to interest rate movements. SIVB appeared not to do this at all. I can find one small, $500 million interest rate hedge in their accounts. And because SIVB did not hedge, it was massively exposed to interest rate risk.
And almost all of its government bonds and RMBS and CMBS would have been fixed-rate rather than floating-rate. This in turn means that SIVB was vulnerable to any increase in interest rates, which would slash the value of its debt securities. According to ZeroHedge and short-sellers, the unrealised losses on these debt instruments as a result of the Fed lifting rates totaled as much as $16 billion in late 2022. This would have, in theory, completely wiped-out the $15.8 billion value of SIVB's shareholder equity if there was ever a need to liquidate all its assets to fund a deposit run...
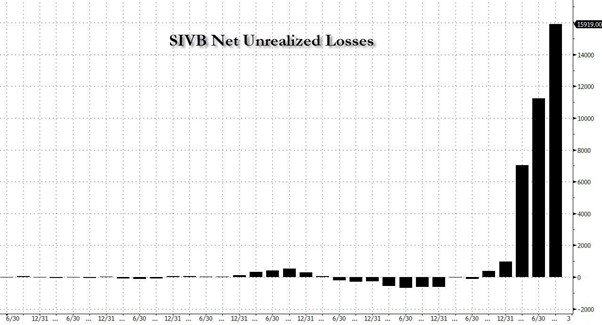
Source: Livewire Markets
Unrealised losses in a hold-to-maturity rather than a mark-to-market book
To be clear, these were unrealised, mark-to-market, or theoretical, losses on SIVB's security holdings. There has been some misconception that SIVB deliberately chose to hide these assets in its "hold-to-maturity" book, which was not marked-to-market, or revalued daily (as opposed to its "available-for-sale" and trading books, which are marked-to-market).
Pretty much every bank globally holds most assets in their hold-to-maturity books, which are not marked-to-market. If SIVB held its debt securities to maturity, it would have lost nothing. Yet SIVB assumed, incorrectly, that its $173 billion in deposits were going to be generally pretty stable, and that its circa $24.6 billion in available-for-sale government bonds and other cash would be enough to meet any deposit outflows.
SIVB's 100% dependency on the Silicon Valley tech network eviscerated this deposit stability assumption as tech began to blow-up in 2022, resulting in it losing $30 billion of deposits. To meet these outflows, SIVB had to sell down its debt instruments. And where these were not being marked-to-market, it was suddenly realising losses that it had not previously had to disclose to investors. Again, had SIVB hedged its interest rate risk, this would not have been a problem.
On 8 March 2023, SIVB announced its intention to raise approximately $2.25 billion of fresh equity capital to cover a realised $1.8 billion loss on the sale of $21 billion of unhedged government bonds and RMBS/CMBS.
By Thursday, SIVB's depositors had tried to withdraw more than $42 billion, fearing that a bank run would force SIVB to crystallise losses on its assets, resulting in a hair-cut on their deposits. One day later, the FDIC had been appointed SIVB's administrator.
In summary, SIVB was unusual because (1) it was 100% dependent on the Silicon Valley tech industry, (2) it did not lend out 57% of its deposits to fund normal loans, but rather put this money into financial markets (mainly RMBS and CMBS), (3) it appeared to take on huge interest rate risk by buying fixed-rate, rather than floating-rate, debt instruments and then did not hedge this risk, and (4) these losses were not deducted from its equity capital because of the regulatory hole described below.
Regulatory hole
The question is why would SIVB take these risks, and how did regulators let them get away with it? The answer could be partly related to a decision by President Donald Trump's administration to lift the threshold for classifying a bank as "systematically important" from $50 billion to $250 billion in 2018. SIVB's CEO reportedly lobbied for this change, amongst many others.
Conveniently, SIVB only had about $50 billion in assets in 2018, but by 2022 had exploded to $200 billion.
This regulatory change allowed non-systematically important banks in the US to avoid a range of tough liquidity, interest rate hedging, and capital rules that the big banks are subject to (including, technically, speaking either avoiding, or not being as restricted by, tough Liquidity Coverage Ratio (LCR) and Net Stable Funding Ratio (NSFR) requirements).
The LCR rules require banks to hold ultra-liquid assets to cover a 30 day run on a bank. The NSFR rules require banks to have stable, long-term funding, to reduce the risk of a sudden flight of money.
So SIVB got away with much more lax liquidity requirements. It also avoided having to deduct unrealised losses on its hold-to-maturity assets from its equity capital ratio, which larger, systematically important banks are required to do. (The 8 largest banks in the US fall into this systematically important bucket.)
And by not hedging its $116 billion in debt securities, SIVB benefited from the higher interest rates you normally earn on longer-dated debt securities. If it had hedged all its interest rate risk, the realised yield on these securities would have been a lot lower, all else being equal.
Further risks with Zombie tech and real estate firms
Higher interest rates will claim many other casualties: we have been forecasting a big default cycle since late 2021. We have been particularly focussed on "zombie" companies that are not earning enough profits to pay the interest bill on their debts. The charts below from our internal systems show the industry sectors with the largest proportion of zombie firms---in the US and Australia, real estate, tech, energy and healthcare lead---and the rise in the share of listed companies that are zombies, crucially only using FY2021 financial data. Obviously there were no interest rate hikes in FY2021: so the share of zombies will likely have sky-rocketed.
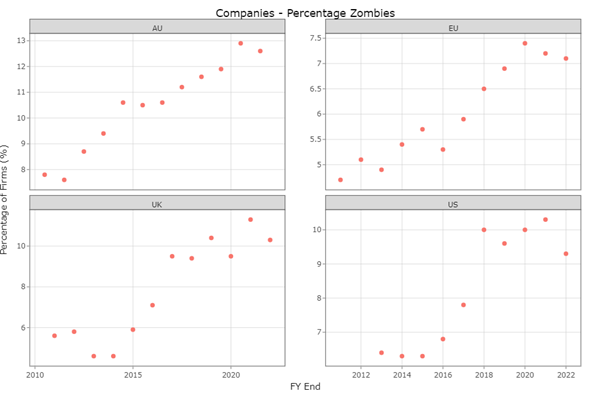
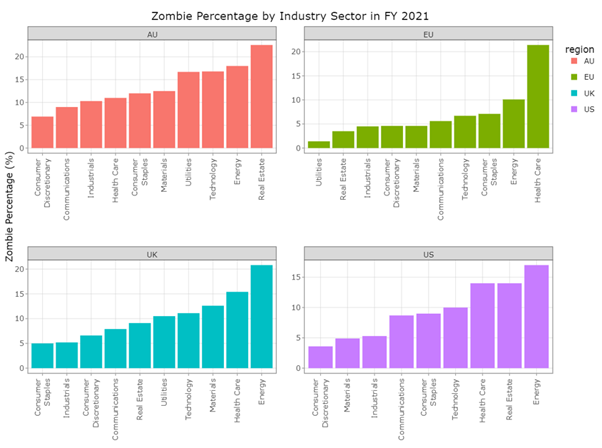
Source: Livewire Markets
Short-sellers in the US and media like ZeroHedge are very focussed on defaults amongst lenders to residential and commercial property in particular. One class of security they are targeting is securitised commercial property loans, or CMBS (which SIVB held). You can track the performance of CMBS via a series of indices called CMBX. ZeroHedge recently wrote:
According to a recent note from Goldman, the [CMBX] series to focus on is S 15, which has 33% of all loans exposed to the office sector (the BBB- tranche has traditionally been the most convex to underlying price changes, so that is probably the best security to short)...Similar to previous "big short" moments, the volume of distressed debt remains small for now, but the problems are expected to spread. Lenders have become increasingly wary of financing older offices...Sales of new commercial-mortgage backed securities in the US have dropped, as rising interest rates cut into lending volumes...While timing one's entry point in a CMBX short may be tricky, one thing is certain: for bears, there are no shortage of signs that trouble is mounting. "There are early indications that delinquencies on office property in CMBS are starting to tick up," Federal Deposit Insurance Corp. Chairman Martin Gruenberg said in a speech on Monday.
The chart below shows the dramatic decline in the value of CMBX S 15 in recent times. Since the global financial crisis, regulators have forced banks to radically reduce their lending to zombie sectors, and commercial property and residential developers in particular. These companies have, therefore, had to seek finance from the non-bank markets, including the high yield debt market and the private loan space, the latter of which has high exposures to real estate. We have, as a result, been very focussed on tracking global defaults, although many lenders will avoid having to report official defaults by restructuring their loans (eg, by swapping debt for equity, allowing borrowers to miss repayments, and generally extending and pretending)...
UPDATES:
Note I added some updates to the Regulatory Hole section to discuss LCRs, NSFRs, etc, and also to clarify the $250bn threshold.
Learn how the industry leaders are navigating today's market every morning at 6am. Access Livewire Markets Today.
All prices and analysis at 12 March 2023. This document was published in Livewire Markets on 12 March 2023. This information has been prepared by Coolabah Capital Investments Pty Ltd (ACN 153 327 872) and Coolabah Capital Investments is solely responsible for its issue. This material is intended to provide general advice only. It has been prepared without having regard to or taking into account any particular investor’s objectives, financial situation and/or needs. All investors should therefore consider the appropriateness of the advice, in light of their own objectives, financial situation and/or needs, before acting on the advice. This article does not reflect the views of WealthHub Securities Limited.