The growth outperformance myth
Andrew Mitchell | Ophir Asset Management
A recent narrative goes something like:
'Growth investing benefited from around the GFC (in 2007) to 2021 from the tail wind of declining interest rates, and now with rates heading higher, growth investing is dead.'
The inference is that growth managers who outperformed during this period were lucky rather than skilled. And now the circle has turned.
At Ophir, we invest in small caps with higher-than-market levels of earnings and revenue growth, but with a strong focus on not overpaying for that growth. Our style is more commonly termed “growth at a reasonable price” (GARP). Think of it as growth investing but with some value elements.
With that background, it's worth checking whether the conventional narrative about growth investing is true.
What are the facts?
Growth investing’s outperformance from 2007 to 2021 is usually attributed to the fall in longer-term interest rates, which decreased discount rates used for valuing shares. The theory is this benefited growth-orientated businesses because more of their cash flows are generated further out in the future.
But, as Einstein once said: “In theory, theory and practice are the same. In practice, they are not.”
Let’s see if the theory has borne out in practice.
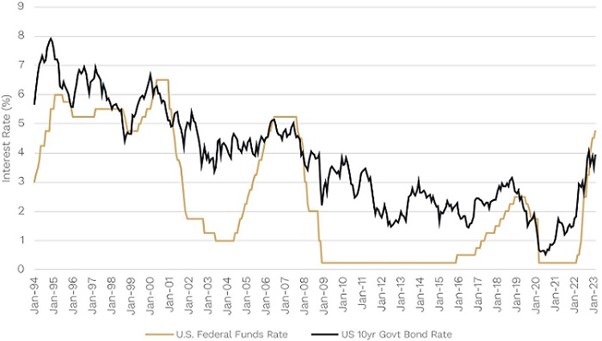
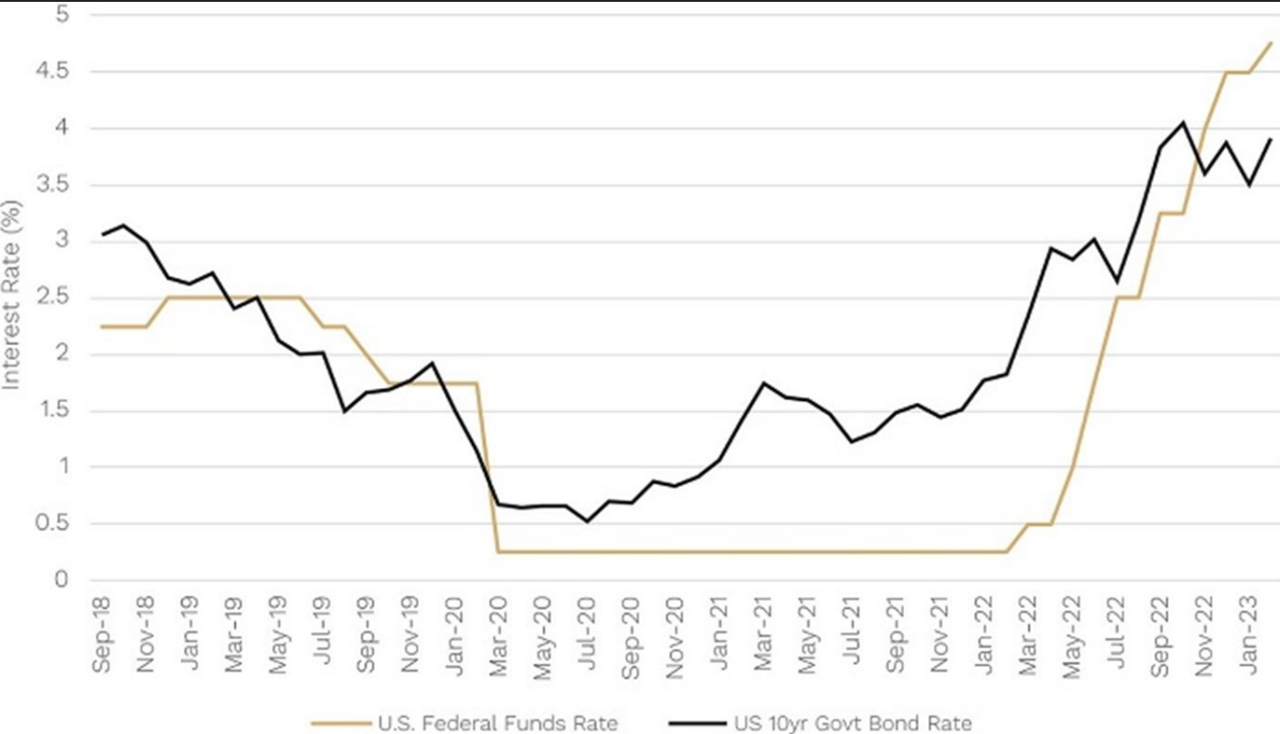
Source: Factset. S&P500, Russell 2000 and MSCI World data start at January 1994. Data to February 2023
In the chart above, the black line shows longer-term interest rates in the U.S. over the last three decades; the gold line shows shorter-term rates. Through to 2021 interest rates generally fell, particularly longer-term rates that form the discount rates for valuing equities.
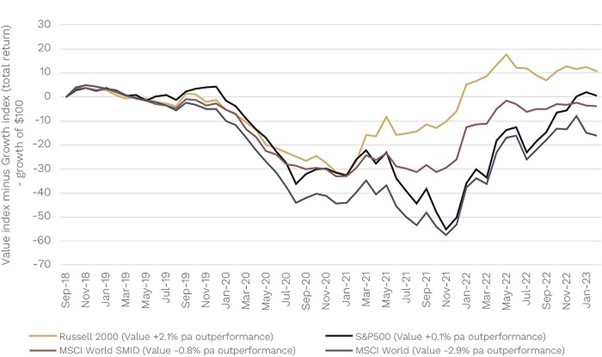
In the chart below, we show the relative performance of value investing versus growth investing for U.S. and global shares, including U.S. small caps.
Value v Growth around the World – Total Return Spread (local currency)
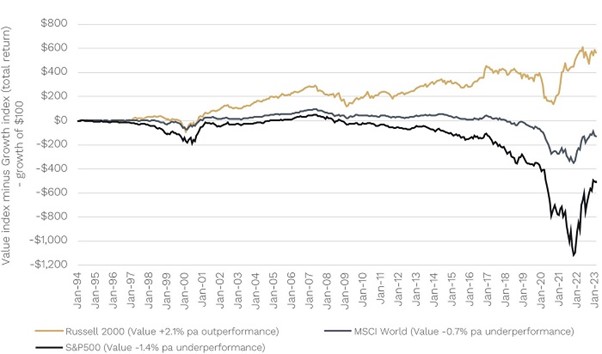
Source: Factset. S&P500, Russell 2000 and MSCI World data start at January 1994. Data to February 2023.
A couple of things stand out:
- The biggest outperformance of growth versus value over the entire 30 years has been in U.S. large caps where value underperformed growth by -1.4% per annum for the S&P500 (with most of the outperformance starting in 2007). Given U.S. large caps’ weight in global indices, this contributed to growth’s outperformance in global large caps too, with value underperforming growth by -0.7% per annum for the MSCI World.
- But value has actually outperformed in U.S. small caps over the entire circa 30 years by more than it underperformed in U.S. large caps. The Russell value outperformed Russell growth by +2.1% per annum compared to -1.4% per annum underperformance of S&P500 value to S&P500 growth.
This causes some problems for the simple narrative that falling longer-term interest rates is the primary cause of growth versus value outperformance.
The big growth outperformance of the last 15-odd years seems to be in U.S. large caps. How much of this is justified by fundamentals?
Was U.S. large-cap growth’s outperformance of value since the GFC speculatively driven by increases in valuations (P/E ratios), perhaps due to lower interest rates? Or were growth businesses simply better?
As the chart below shows, the outperformance of US large-cap growth stocks – which includes many household names like Apple, Microsoft, Google, Amazon, Tesla, and Visa – has mostly been driven by better earnings (EPS) growth.
Yes, they have seen their PEs expand by more than value stocks (and have had them compress significantly recently), but this has been a far less important driver overall.
U.S. Large Caps Return Drivers (July 2007 to Feb 2023)
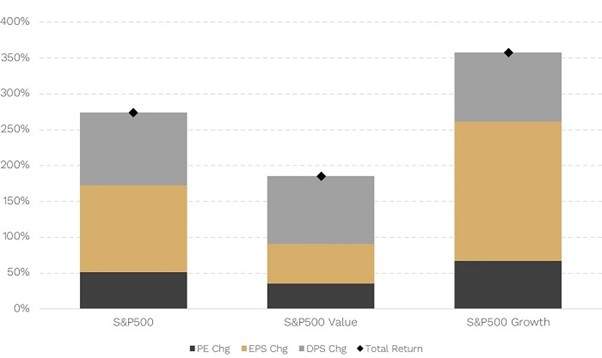
Source: Factset. “PE Chg” = Change in 1 year forward Price/earnings ratio, “EPS Chg” = Change in 1 year forward earnings per share, “DPS Chg” = Change in Dividends per share, “Total return” = price returns plus dividend return.
How big of a tailwind (if any) has growth investing delivered?
We have looked at the very long term above, but what if we look at just the period since we started Ophir in 2012?
In the top chart, we show the time from July 2012 to today (February 2023) for the Australian share market.
Value v Growth in Australia – Total Return Spread (local currency)
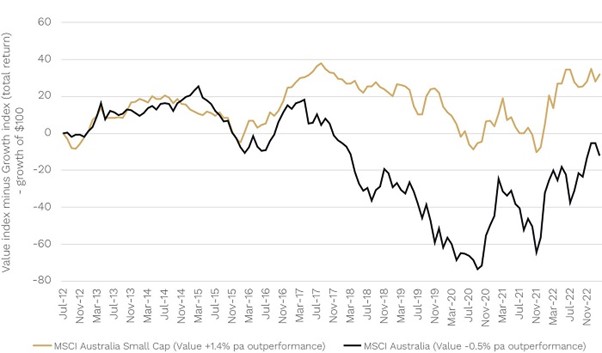
Source: Factset. Data to February 2023.
For Australian large caps (MSCI Australia), value underperformed growth by a relatively modest -0.5% per annum. But value outperformed growth by +1.4% in Australian small caps.
(Interestingly, on net, U.S. long-term bond yields have risen over this period. This is also true for Australian long-term bond yields, though to a lesser degree.)
While growth investing in Australia (both the large and small-cap variety) appears to have had a material tailwind for a few years from around 2017 leading in to 2021, this doesn’t appear to be the case, especially for small caps, over the last decade or so.
How big of a tailwind (if any) has growth investing had since we started investing in global small caps?
Some of the most violent moves in value-versus-growth performance occurred recently after central banks cut rates aggressively in early 2020 in response to COVID … then raised them even more aggressively in 2022 to fight inflation.
What, on net, has been the response of growth and value to all that cutting and hiking?
Value v Growth Recently – Total Return Spread (local currency)
Source: Andrew Mitchell, 2023
The top chart above shows the general underperformance of value (outperformance of growth) in the rate-cutting/ultra-low-rates phase.
But that underperformance has been partially, or in some cases fully, reversed in the subsequent phase when rates headed higher.
In small/mid caps (Russell 2000 and MSCI World SMID), value has outperformed by +2.1% pa and underperformed by -0.8% per annum respectively, highlighting a mixed picture.
There is no doubt late 2021 and 2022 has provided strong headwinds for growth investors after seeing strong tailwinds in late 2019 through early 2021. On net though, at least insofar as the U.S. is concerned, value has outperformed over this most recent period of rate cuts and rate hikes, driving big value and growth performance divergence along the journey.
What does it all mean?
Valuations of many growth companies have been hit hard as central banks have normalised interest rates over the last year or so, leading to a period of sharp growth underperformance in many market segments.
Several growth segments have now fully unwound their COVID valuation excesses while some have further to go.
But providing inflation is ultimately tamed, the race higher in longer-term interest rates is likely nearing the end, or perhaps already over. That means the big valuation headwind for many growth-orientated businesses may also be nearing an end.
Perhaps that means the market will go back to caring more about that boring old concept called company fundamentals. After all, macro forces like inflation and interest rates may play a big role in short term share market winners and losers, but in the long term it’s all about the businesses you own. Famed stock picker Peter Lynch said it best:
“Often, there is no correlation between the success of a company’s operations and the success of its stock over a few months or a few years. In the long term, there is 100% correlation between the success of the company and the success of its stock.”
First published on the Firstlinks Newsletter. A free subscription for nabtrade clients is available here.
Andrew Mitchell is Director and Senior Portfolio Manager at Ophir Asset Management, a sponsor of Firstlinks. Analysis as at 30 March 2023. This information has been provided by Firstlinks, a publication of Morningstar Australasia (ABN: 95 090 665 544, AFSL 240892), for WealthHub Securities Ltd ABN 83 089 718 249 AFSL No. 230704 (WealthHub Securities, we), a Market Participant under the ASIC Market Integrity Rules and a wholly owned subsidiary of National Australia Bank Limited ABN 12 004 044 937 AFSL 230686 (NAB). Whilst all reasonable care has been taken by WealthHub Securities in reviewing this material, this content does not represent the view or opinions of WealthHub Securities. Any statements as to past performance do not represent future performance. Any advice contained in the Information has been prepared by WealthHub Securities without taking into account your objectives, financial situation or needs. Before acting on any such advice, we recommend that you consider whether it is appropriate for your circumstances.