The banking crisis and your multi-asset portfolio
In this blog, we explore the implications of recent bank turmoil on our multi-asset views. For a more detailed background on what transpired at Silicon Valley Bank (SVB) and the actions that the Federal Reserve (Fed) took to mitigate the fallout, we recommend reading this piece.
Our key takeaways are as follows:
- The recent events at SVB and other global banks occurred due to a mixture of idiosyncratic problems at these institutions as well as macroeconomic forces that are a cause for broader concern.
- Our macroeconomic outlook remains bearish as we expect global growth to further weaken and policy to remain tight.
- We believe that valuations of risk assets are broadly expensive given our bearish macro outlook, which doesn’t appear to be priced in.
What happened? Don’t let the micro details hide the macro story
Idiosyncratic factors certainly played a role in SVB’s failure and the recent turmoil we’re seeing in US regional banks as well as overseas at Credit Suisse (CS). SVB had a glut of corporate customers that were tech startups (that have been drawing down their deposits), as well as a mismanaged asset and liability mix, particularly in an environment of rising interest rates (fixed-rate assets and floating-rate liabilities). CS has been engulfed in scandal over the last few months and has seen outflows and a steady decline in assets under management since this past October. However, we believe that even many of the micro stories of the last two weeks are not fully isolated from one another.
Fiscal and monetary stimulus following the onset of the COVID-19 pandemic in the United States and abroad spurred a hot global economy. With low financing costs, animal spirits were unleashed—booming private markets, unprofitable growth startups, digital assets and Reddit-fueled stocks like AMC and Gamestop saw their valuations soar. Animal spirits help produce strong growth, but they can also produce excesses in the economy that are concealed until policy tightens.
Witnessing a surge in inflation, global central banks embarked on the most rapid tightening cycle in decades. In the United States, Federal Reserve (Fed) policy rates have risen 450 basis points (bps) since the hiking cycle kicked off; 2022 alone saw the most bps of Fed rate hikes ever in a single calendar year. These rate hikes can take time to flow through the economy, and we are seeing the first few dominoes to fall with SVB, Signature Bank, and more recently, volatility at CS.
As a result of central bank liftoff, we saw yield curves around the world invert, which can hurt bank profitability. Banks invest customer deposits, fed funds and short-term instruments into longer-term loans, which under normal circumstances yields them a profit (assuming the loans they make do not default). However, when interest rates rise, the price of longer-dated securities falls in value. Further, when the yield curve inverts, new longer-dated loans are no longer higher yielding than short-term loans. While SVB in particular suffered from underwater carry trades, they’re not alone—banks are currently sitting on around US $620 billion of unrealized losses.1
Economic outlook
Bank lending standards across the United States and Europe were tightening before SVB’s collapse, and will likely only continue to tighten. These standards are important to watch, as they provide a reliable leading indicator to gross domestic product (GDP) growth and high-yield corporate credit default rates. Additionally, consumers are broadly still concerned about the safety of their deposits and the magnitude of the Fed’s backstop. Blue-chip, “too big to fail” banks like Bank of America and JP Morgan have seen billions of dollars in deposit flows over the last couple of days. The strain on small, regional banks may have a significant impact on economic growth. Loan growth has been shown to be a reliable leading indicator of economic activity, and when it slows, so too does the economy (Exhibit 1).
Exhibit 1: When Bank Loan Growth Slows, GDP Usually Follows
Lending Standards vs. US Real GDP (year-over-year % change)
March 1991–December 2022
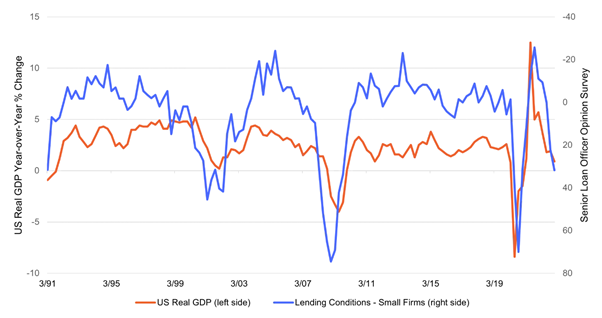
Sources: Federal Reserve, Bureau of Economic Analysis Bloomberg.
Unfortunately for central banks, a weak growth outlook is likely to take place alongside elevated levels of core inflation. The Fed, European Central Bank (ECB), and other developed market central banks are in a precarious position as there is now tension between their dual objectives of ensuring financial stability and reining in inflation. We wrote a series of papers last year cautioning that the Fed is walking a tightrope between hiking too much, risking recession, and hiking too little, allowing inflation to run too hot. Our concern was that with the Fed behind the curve, they might overdo it, and something would break. It is possible that moment is upon us, and the proverbial tightrope has been cut out from under them.
Market pricing for central banks’ policy rates have fluctuated dramatically over the first couple weeks of March. On March 8, market participants were expecting the Fed to hike rates to 5.70% before pausing. As of March 16, the market is pricing in rates at just 4.93%. What this tells us is that investors believe that the Fed may have been too aggressive, recession risk has crept up, and the central bank may need to reverse course sooner than expected. While these expectations may end up coming true, the repricing is noteworthy; this highlights the tension between inflation and financial stability.
We continue to expect the Fed to hike rates by 25 bps at its upcoming March 21-22 policy meeting, although this is a highly fluid situation. Likewise, we are not surprised that the ECB increased policy rates by 50 bps as it focuses its interest rate policy on inflation.
Exhibit 2: Have Central Banks Been Too Aggressive?
Market Expectations for December Policy Rates Have Fallen
January 2, 2023–March 16, 2023
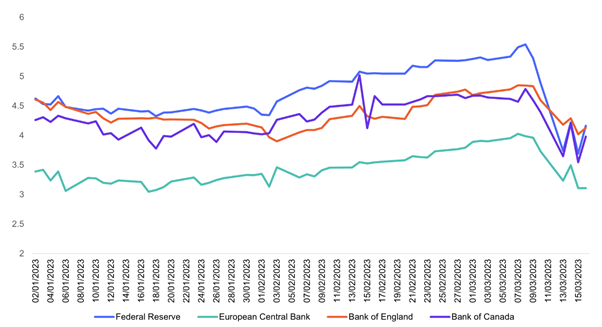
Source: Bloomberg Interest Rate Swaps Market. There is no assurance any estimate, forecast or projection will be realized. Information data provider notices and terms available at www.franklintempletondatasources.com
The mixture of a weak growth outlook, challenging inflation and tightening policy keeps our recession risk high, particularly in the United States and Europe where financial conditions have tightened. It also supports our regional preference for Asia, where inflation is a lesser issue and some economies are geared to China’s reopening.
Tail risk
CS is a much larger and more economically critical bank than SVB, with significant liquid assets and access to Swiss National Bank (SNB) credit lines to call upon in the event of rapid deposit withdrawals. The SNB backstop is a crucial development. While we continue to have some concerns, a full-scale SVB-like collapse in Europe, Japan, and other developed markets is unlikely given stricter liquidity and capital requirements than seen in the United States. We are monitoring these developments closely.
Multi-asset implications
Asset valuations are not reflecting our weak macro outlook. Equity risk premia and credit spreads are a far cry from levels we’ve seen in prior recessions (see Exhibits 3A and 3B). Similarly, corporate earnings expectations still appear too high, especially as profit margin pressures continue. To us, risky assets are not appropriately pricing in current macro fundamentals or recession possibility. Furthermore, if the Fed stays its hawkish course—against investor expectations—risk assets could suffer.
Exhibit 3A: Stocks Valuations Are Not Reflecting Imminent Recession
S&P 500 Equity Risk Premium
February 2003–February 2023
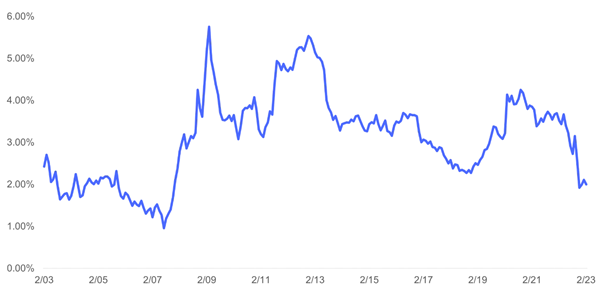
Sources: Standard & Poor’s/Robert Shiller, Federal Reserve US Treasury H15 Constant Maturity 10-Year Real Yield Curve Rates, Bloomberg. Equity Risk Premium, or inverse of the cyclically adjusted price-to-earnings (CAPE) ratio minus the US Treasury 10-year real yield, is defined as the average of 10 years of real earnings (adjusted for inflation) divided by the price, subtracting the real US Treasury yield. Earnings/price is a metric used to measure whether a stock is attractively priced given its inherent worth; when the risk-free rate is deducted, the measure suggests whether stocks are worth the extra risk beyond Treasuries. A lower inverse CAPE denotes equities are viewed as expensive, relative to the risk-free rate. Past performance is not an indicator or a guarantee of future results. Information data provider notices and terms available at www.franklintempletondatasources.com
Exhibit 3B: Yields Are Not Mimicking Past Crises
US Option-Adjusted Spreads (OAS)
January 31, 1994–March 16, 2023
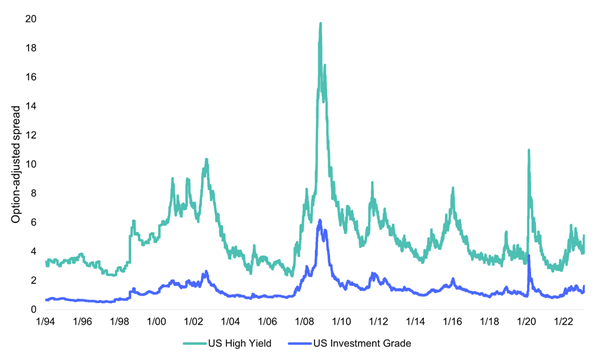
Source: Bloomberg US Aggregate Corporate Average OAS, Bloomberg US Corporate High Yield Average OAS, Bloomberg. OAS refers to the difference in yield between a security or index and the yield of a benchmark, other security or index, adjusted for options within the index. These options give rights to bond issuers and holders. One example is a call option, which allows a bond issuer to redeem a bond before maturity, affecting its yield output. A higher OAS denotes more risk as assigned by the market. Indexes are unmanaged and one cannot directly invest in them. They do not include fees, expenses or sales charges. Past performance is not an indicator or a guarantee of future results. Information data provider notices and terms available at www.franklintempletondatasources.com.
At this point, we remain defensively positioned. We favour fixed income over equity, with a preference for government bonds over credit. Even with the strong repricing in government bond yields, elevated concerns around a recession still support duration at these levels as they can provide material downside protection.
Finally, as mentioned above, we are tilting away from developed markets, where inflation remains highest and bank concerns are having the most material impact on confidence. These issues are less apparent in Asia, which is also buoyed by the growth impetus stemming from China’s reopening. This supports our preferencing for Chinese equities and Asia Pacific emerging market local debt.
Learn how the industry leaders are navigating today's market every morning at 6am. Access Livewire Markets Today.
Franklin Templeton Investment Solutions crafts asset allocation and quantitative equity strategies using proprietary risk mitigation modelling to create scalable and quantifiable investment outcomes. All prices and analysis at March 28 2023. This information was produced by Franklin Templeton Investment Solutions and published by Livewire Markets (ABN 24 112 294 649), which is an Australian Financial Services Licensee (Licence No. 286 531). This material is intended to provide general advice only. It has been prepared without having regard to or taking into account any particular investor’s objectives, financial situation and/or needs. All investors should therefore consider the appropriateness of the advice, in light of their own objectives, financial situation and/or needs, before acting on the advice. This article does not reflect the views of WealthHub Securities Limited.