Charting the Economy: Jobs, Markets & Entrepreneurial Women
This week’s charts visualise different effects of inflation: how high-inflation years are correlated with bad years for stocks and bonds, and how real wage growth is being wiped out in the US. We chart a survey of manufacturers that shows how shortages of labour and raw materials are constraining production. We created a model to measure Covid restrictions and reopening in China, and show how a PMI survey is a leading indicator of corporate profitability. We track deflating German house prices and the healthy labour market in Europe. Finally, as International Women’s Day approaches, we examine which nations combine innovation with female entrepreneurship.
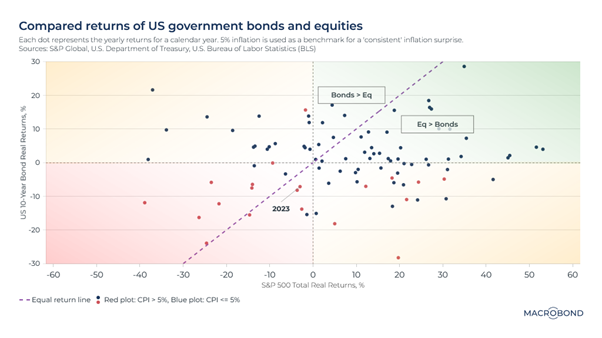
Mapping bond and equity returns in historic inflation regimes
Investment returns are highly sensitive to inflation. While the effects are more direct on bonds, equities are affected too, despite the flexibility that corporations have to react to inflationary environments.
This colourful scatterplot visualises historic US investment returns in eras of high or low inflation – choosing 5 percent CPI growth as the threshold. Plotting every calendar year going back more than a century, we charted whether returns for the S&P 500 and 10-year government bonds were positive or negative. This results in four quadrants.
Red dots indicate the high-inflation years.
Using these quadrants, one correlation is obvious: most years with negative returns for both government bonds and equities have corresponded to years of high inflation.
The dotted diagonal line separates years where equities did better than bonds and vice versa. There are more years of equity outperformance, as the conventional wisdom would suggest.
With inflation remaining stubbornly high so far in 2023, we’re near the dead centre of this chart.
Source: Macrobond, 2023
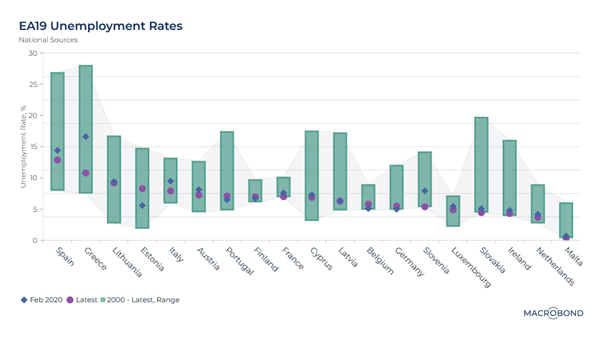
Eurozone unemployment eases in unison and unlike previous crises
European labour market conditions are unusually homogeneous.
This chart compares historic unemployment rates for 19 nations that use the euro (excluding Croatia, which adopted the currency this year).
The diamonds and bubbles compare the pre-pandemic readings in February 2020 with the present day. Most are back to the old normal.
Spain, Italy and Greece have a notably healthier job market today than they did three years ago.
The historic range for each nation, as shown with the green bar, reminds us that unemployment rates used to be wildly divergent in the eurozone; in the wake of the European sovereign-debt crisis a decade ago, Greek and Spanish unemployment surpassed 25 percent.
Source: Macrobond, 2023
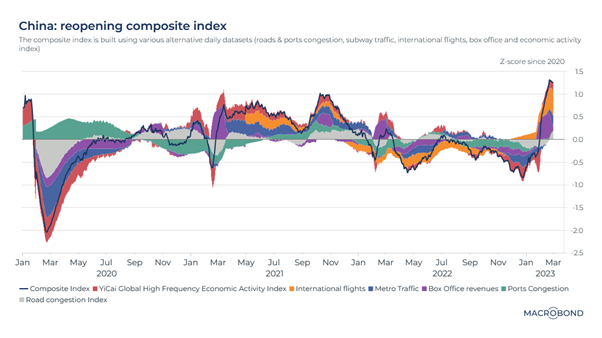
In search of a model to measure zero Covid and reopening in China
As the world focuses on China’s reopening, we’ve built a composite index to capture the waxing and waning of pandemic restrictions over the past three years.
Our index uses a broad range of daily alternative datasets, including port activity, road congestion, subway usage, international flights and box-office sales. The chart measures the z-score, or deviation from the historical mean (zero).
Throughout 2022, the composite index and most of its components were almost always below average. The strong shift since the start of 2023 is obvious; the most lively indicators are the rebound in box-office revenue and flights abroad.
Source: Macrobond, 2023
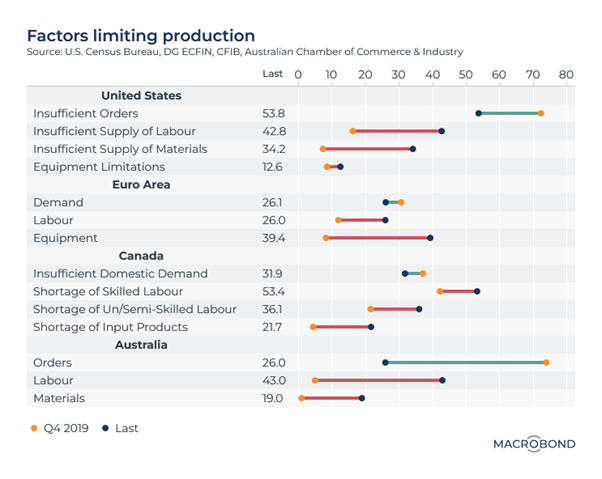
Manufacturers report the shortages holding back production
Labour shortages and supply-chain bottlenecks have been a constant theme over the past year. It’s a far cry from 2019, when companies were more concerned about weak demand.
This chart is based on surveys that ask companies in the US, Canada, Australia and the Eurozone about issues that are holding back production. Broadly, the factors measured are demand, the availability of labour and the ease of obtaining raw materials and equipment.
The red lines are trends that are getting worse; green lines show improvement from 2019.
These four economies are sharing the same struggles. It’s hard to recruit employees; supply of inputs can be tricky. While the worst of the supply-chain disruptions may be behind us, issues such as the semiconductor shortage continue to hamper the auto sector, for instance.
Source: Macrobond, 2023
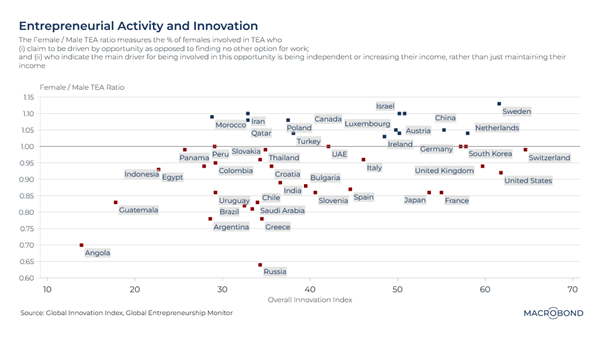
Entrepreneurial women around the world
Which nations produce the most female entrepreneurs? As International Women’s Day approaches, the Global Entrepreneurship Monitor offers insights.
GEM, an academic research project, calculates what it calls the “TEA rate” – an acronym for total early-stage entrepreneurial activity: the proportion of the population aged 18 to 64 that is an owner-manager of a new business. This data point aims to capture the proportion of entrepreneurs who are driven by a sense of opportunity, rather than people who can find no other option for work.
Quite a few nations – including Morocco, Canada, Israel and China – have a higher TEA rate for women entrepreneurs, as our chart shows.
When we chart this ratio against another measure of economic dynamism, the Global Innovation Index, Sweden stands out as a nation combining a positive environment for female founders with an entrepreneurial culture focused on high-value-added activities.
Source: Macrobond, 2023
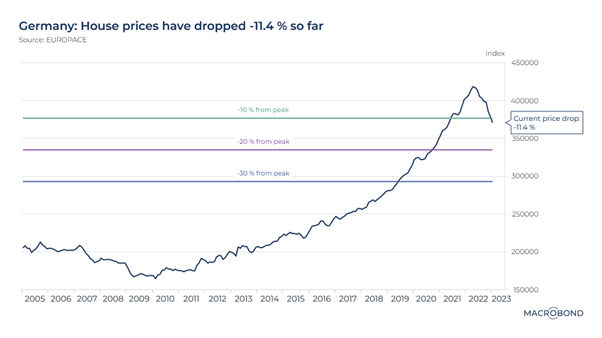
German house prices deflate
It’s no surprise that residential real estate is slumping as central banks raise rates, making it more expensive to finance a home purchase.
What might be a surprise is that German prices are down more from their peak than nations more notorious for expensive housing markets, like the UK and Sweden. Last year, UBS named Frankfurt and Munich as notable “bubble risk” markets on a global basis.
Since the peak in April 2022, German house prices have dropped more than 11 percent, according to Europace, a platform that handles property financing. Some analysts are predicting that prices will ultimately drop 25 percent from their peak.
As the European Central Bank has tightened policy, a 10-year fixed rate mortgage is now priced at 3.9 percent, compared with 1 percent at the start of last year.
Source: Macrobond, 2023
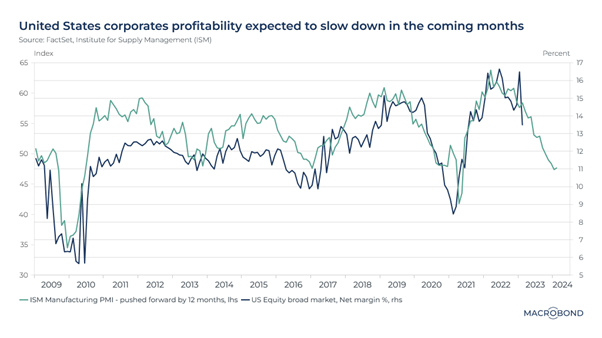
Anticipating a slump in corporate profitability
For this chart, we explored the relationship between US companies’ profitability and the Institute for Supply Management’s purchasing managers index (PMI) for manufacturers.
The closely watched PMI surveys are a measure of whether economic contraction is likely, based on whether supply-chain managers are expecting growth to pick up (readings above 50) or recede (below 50).
It appears that the ISM PMI is a leading indicator of corporate net margin – closely correlated with a 12-month lag, as our chart shows. Watch for corporate profitability to deteriorate.
Source: Macrobond, 2023
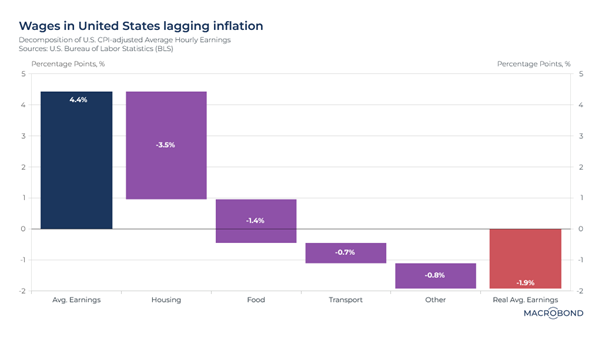
How different aspects of inflation are wiping out your wage gains
Real US wage growth has fallen below its pre-pandemic trend.
As our chart of January 2023 data shows, the headline year-on-year increase in average hourly earnings appears healthy at first, but is being more than offset by inflation in housing costs, food, transport and everything else. That results in shrinking real wages.
Central bankers and employers take heed: wages might have to play catch-up in coming years if this trend continues. As economists warn of a labour shortage, central bankers will be on the lookout for a wage-price spiral – and that’s another potential headwind for corporate profit margins.
Source: Macrobond, 2023
Learn how the industry leaders are navigating today's market every morning at 6am. Access Livewire Markets Today.
Macrobond Financial is a contributor to Livewire, delivering macroeconomic & financial data with unique insights. All prices and analysis as at 7 March 2023. This information was produced by Macrobonds Financial and published by Livewire Markets (ABN 24 112 294 649), which is an Australian Financial Services Licensee (Licence No. 286 531. This material is intended to provide general advice only. It has been prepared without having regard to or taking into account any particular investor’s objectives, financial situation and/or needs. All investors should therefore consider the appropriateness of the advice, in light of their own objectives, financial situation and/or needs, before acting on the advice. This article does not reflect the views of WealthHub Securities Limited.