Two steps forward, one step back for investors
David Booth | Dimensional Fund Advisors
Consider everything investors have been through in recent years: a global pandemic, rapid inflation, war in Europe, and volatile stock and bond markets. It’s reasonable to feel uneasy in the face of so much uncertainty.
Now imagine it’s the end of 2019 and you know what you know now. You’re asked to predict market returns over the next three years. Will stocks be up 25%? Flat? Down 25%?
Exhibit 1: Big Picture
Growth of $1 invested in S&P 500, January 1, 2020-December 31, 2022
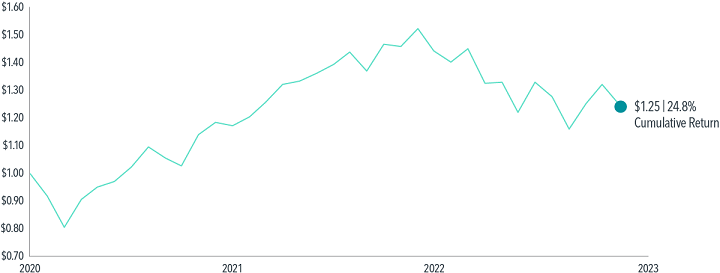
Source: Firstlinks. In US dollars. S&P 500 Index annual returns 2020–2022. S&P data © 2023 S&P Dow Jones Indices LLC, a division of S&P Global. All rights reserved. Indices are not available for direct investment; therefore, their performance does not reflect the expenses associated with the management of an actual portfolio.
As you can see in Exhibit 1, the market was up almost 25% from 2020 through 2022.1 That includes last year’s 19% decline. Too often, people look only at year-by-year returns and don’t look at the total history of returns, which can be informative.
Exhibit 2: Distribution of Returns
Distribution of calendar-year S&P 500 returns, 1926-2002
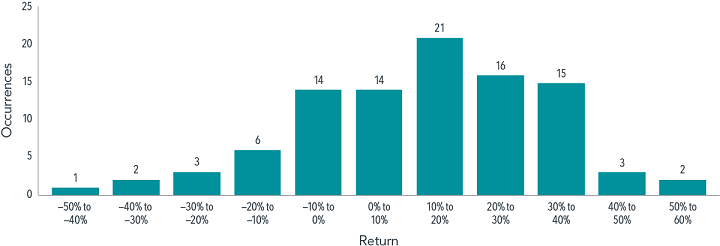
Source: Firstlinks. S&P data © 2023 S&P Dow Jones Indices LLC, a division of S&P Global. All rights reserved. Indices are not available for direct investment. Index returns are not representative of actual portfolios and do not reflect costs and fees associated with an actual investment. Decrease of 19.6% was from Jan. 1, 2020, to March 31, 2020.
We now have 97 years of research-quality data on stock returns. Exhibit 2 shows the distribution of annual returns over that time period, ranging from a year when the market lost almost 50% to two years when it gained more than 50%. The bulk of the returns are between –10% and +40%. When you look at a histogram like this, you get a sense of the distribution of returns, rather than a forecast of what any year’s return will be. The best prediction of what will happen next year is a random draw from one of these 97 years.
Exhibit 3: Two Up, One Down
Distribution of calendar-year S&P 500 returns, 1926-2002
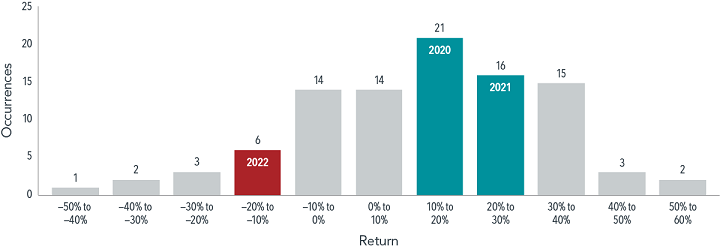
Source: Firstlinks. One-month Treasury bill data provided by Morningstar.
The past three years have been 'normal'
Let’s look more closely at the past three years. In Exhibit 3, the returns from 2020 and 2021 were positive, with 2022 negative. These three years to me seem representative of the history of stock returns: two steps forward and one step back. Two positive years and one negative. That’s about the way the world works.
But how do we explain the stock returns of these last three years, given the stress that people have felt with the pandemic? I think of it in terms of ingenuity and flexibility bailing us out. What happens when companies or individuals get hit with bad news? We don’t just sit there and take it—we try to figure out how to get back on track. That’s what happened here. The pandemic hit and markets dropped 20%.2 Then human ingenuity kicked in by the end of the year. We had a vaccine and started distributing it at incredible speed. That innovation continued as businesses adjusted into the next year.
Exhibit 4: In Line with History
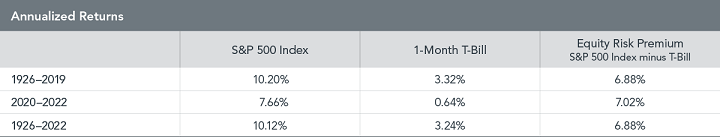
Source: Firstlinks
Let’s look at how the last three years compare with the previous 94. Exhibit 4 shows the returns on the S&P 500 index and US Treasury bills over the last 97 years. The first row is the 94-year period of 1926–2019. The S&P 500 index compounded at 10.2% per year. Treasury bills, which we think of as being the riskless asset, compounded at 3.32%.3 We think of the difference between 10.2 and 3.32, which is 6.88 percentage points, as the reward for taking the stock market risk. So that’s the equity risk premium, almost 7% a year.
The next row shows the last three years. The S&P 500 compounded at 7.66%. Treasury bills were basically flat (0.64%). The difference between those two is also about 7%—7.02 percentage points. So, for the last three years, the risk premium of 7% a year is almost precisely what it had been the previous 94, about 7% a year.
In other words, the last three years in terms of equity returns have been ‘normal’.
How best to prepare for the future
How can we explain normal returns when it seemed to some people that the world was falling apart? Think of public financial markets as a giant information-processing machine. When bad news comes in, prices drop. When good news comes in, prices rise. The stock market every day is trying to set prices to induce investors to come in to invest. If the stock market had a negative expected outcome, nobody would invest. The stock market is constantly adjusting prices so that investors have a positive expected outcome.
One of the most important principles of investing is being a long-term investor with an investment plan you can stick with. The stock market will go up and down. It always has; it always will. If during this three-year period you felt like you had to bail out of stocks for some reason, then you had probably invested too much in stocks to begin with. But if you had about the right amount, for you, invested in stocks, there was a good chance that you didn’t have to make any adjustments to your portfolio mix.
What will happen over the next three years? Who knows? The good news is, if you’ve planned for the range of outcomes, you won’t have to worry about relying on a prediction.
First published on the Firstlinks Newsletter. A free subscription for nabtrade clients is available here.
David Booth is a US businessman, investor and philanthropist. He is also the Chairman and founder of global asset management firm Dimensional Fund Advisors. Analysis as at 22 February 2023. This information has been provided by Firstlinks, a publication of Morningstar Australasia (ABN: 95 090 665 544, AFSL 240892), for WealthHub Securities Ltd ABN 83 089 718 249 AFSL No. 230704 (WealthHub Securities, we), a Market Participant under the ASIC Market Integrity Rules and a wholly owned subsidiary of National Australia Bank Limited ABN 12 004 044 937 AFSL 230686 (NAB). Whilst all reasonable care has been taken by WealthHub Securities in reviewing this material, this content does not represent the view or opinions of WealthHub Securities. Any statements as to past performance do not represent future performance. Any advice contained in the Information has been prepared by WealthHub Securities without taking into account your objectives, financial situation or needs. Before acting on any such advice, we recommend that you consider whether it is appropriate for your circumstances.