Seven reasons why Australian shares are likely to outperform global shares over the medium term
Shane Oliver | AMP
Since the March 2009 Global Financial Crisis (GFC) low in share markets, Australian shares are up 138%, compared to a 310% gain in global shares in local currency terms and a 500% gain in US shares.
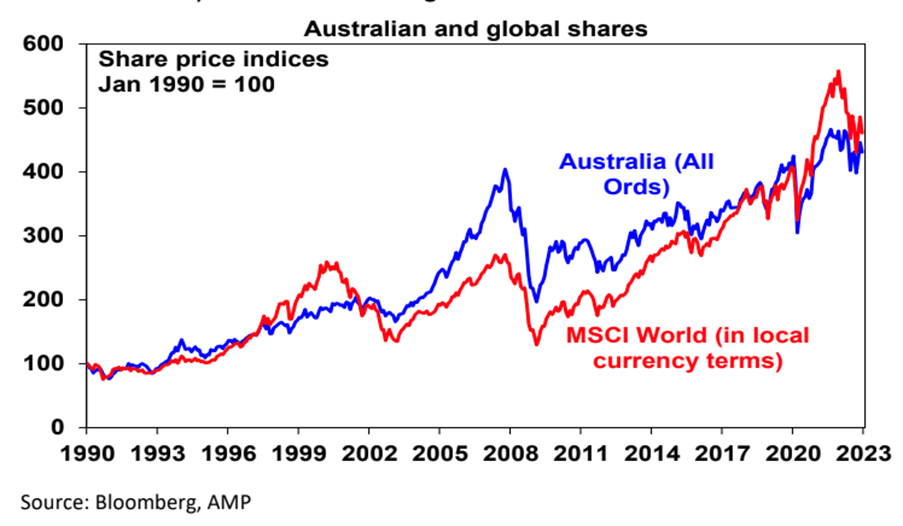
Last year though Australian shares outperformed global shares, helped by strong commodities and a less hawkish RBA. The big question is whether the structural underperformance by Australian shares since 2009 is over? Why have Australian shares underperformed?
To get a handle on the future, it’s useful to understand the past. The underperformance of Australian shares since 2009 reflects a mix of:
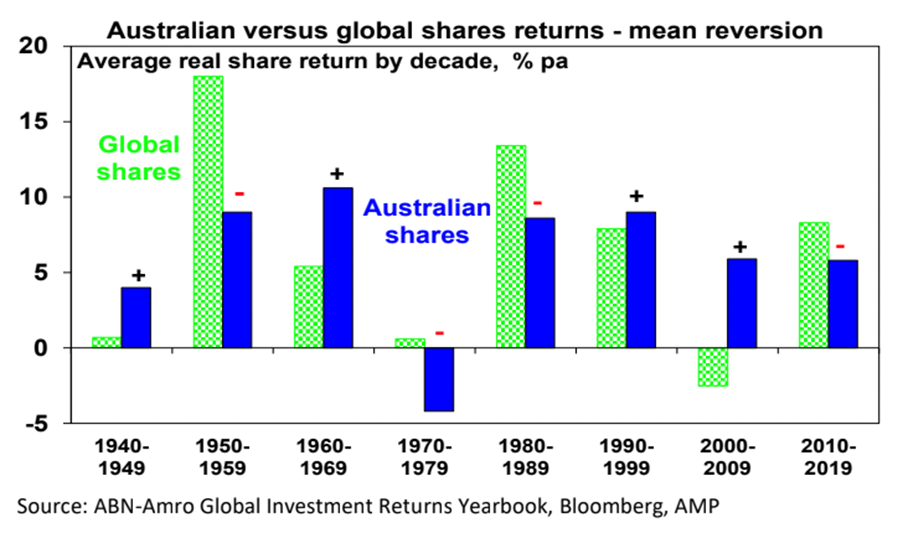
- Payback for its huge outperformance in the 2000s – Australian shares go through periods of relative out & underperformance. This can be seen in the next chart, which shows the relative decade by decade real returns of global and Australian shares since 1940. Australian shares outperformed in the 1940s, unperformed in the 1950s, outperformed in the 1960s resources boom years, underperformed in the high inflation 1970s and 80s, outperformed in the 1990s (although this was marginal and Australia underperformed in the second half of the 1990s when the tech boom raged), outperformed dramatically in the resources boom of the 2000s and underperformed in the 2010s.
The swings in relative performance can also be seen in the next chart which shows the ratio of Australian share prices to global share prices.
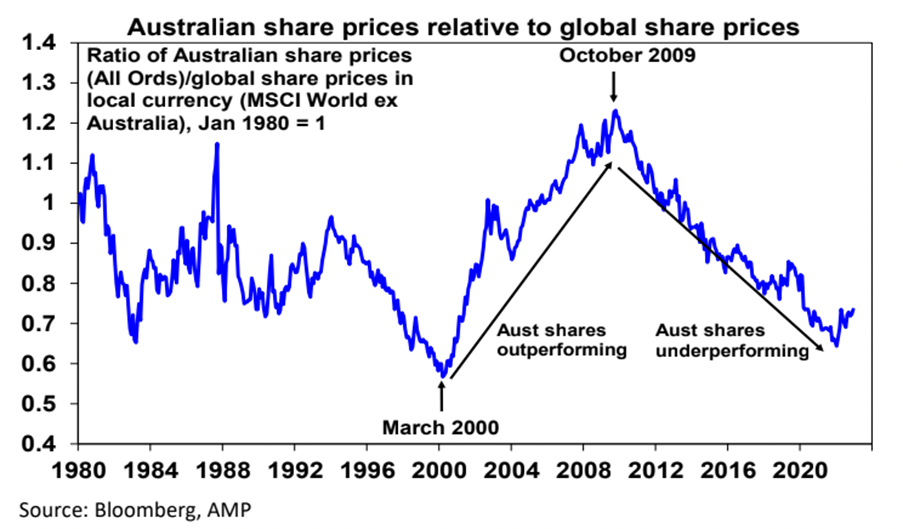
- After underperforming global shares in the tech boom in the second half of the 1990s, Australian shares came roaring back in the 2000’s resources boom. This meant the 2007 high for Australian shares was a much higher high than for global shares which spun their wheels in the 2000s. So, the poor relative performance of Australian shares since 2009 is partly payback for their outperformance in the 2000s.
- The slump in commodity prices from 2011 – this weighed heavily on Australian resources shares through much of last decade.
- Relatively tighter monetary policy in Australia for much of the post-GFC period – whereas the US, Europe and Japan had near-zero interest rates and quantitative easing, Australia has had much higher rates and no money printing until the pandemic. In fact, the relative underperformance started in October 2009 when the RBA raised rates post GFC which wasn’t followed by other major countries.
- The surge in the Australian dollar to $US1.10 in 2011 – this reduced the competitiveness of Australian companies which takes time to reverse.
- Property crash phobia – foreign investor fear of a crash in Australia’s expensive housing market has been a periodic theme over the last decade leading many foreign investors to be cautious of Australia.
- Worries about the deteriorating relationship with China – this started in 2018 with President Trump’s trade war but was accentuated through the pandemic. It arguably resulted in foreign investors demanding a risk premium to invest in the $A and Australian shares.
- A low exposure to pandemic winners – like tech stocks, which helped the US share market and hence global shares in 2020 & 2021.
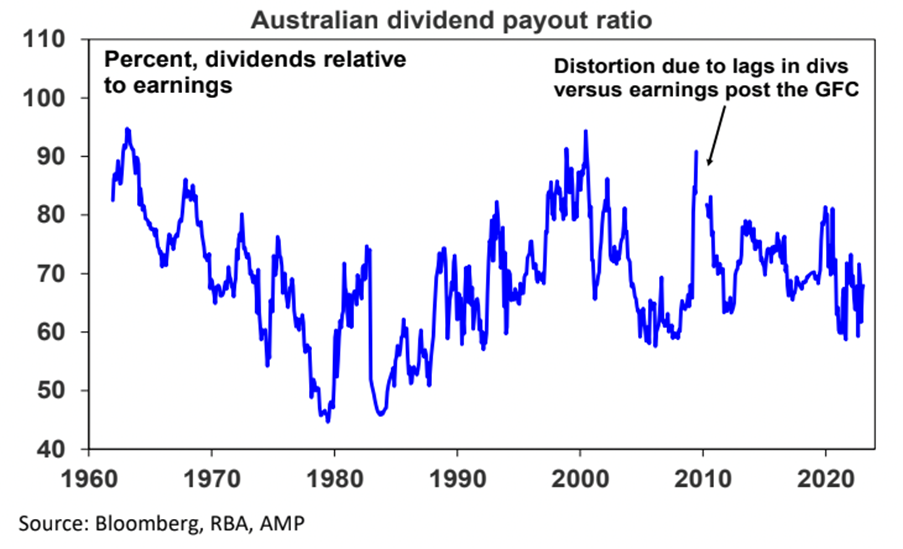
Are high dividend payouts to blame?
An often-expressed view is that Australian companies are not investing because shareholders want high dividends and this could be causing poor profit growth & share returns. This is unlikely. The dividend payout ratio (ie dividends relative to earnings) is not out of line with its historic norm.
Australia’s high dividend payouts are in fact healthy from a long-term perspective. There is evidence that high payouts actually drive higher earnings growth and share returns as: high dividend payouts mean less risk of poor investment decisions from retained earnings; they are
indicative of corporate confidence about future earnings; and they indicate earnings are real and not accounting fiction.
In fact, because Australian shares pay relatively high dividend yields (around 4.4%) compared to global shares (2.5%) they should be included in comparisons of Australian with global share market returns. The next chart compares the relative performance of Australian to global shares since 1970 in terms of: relative share prices in local currency terms (green line); relative total returns ie with dividends added in (blue line); and relative total returns with global shares in Australian dollars (red line).
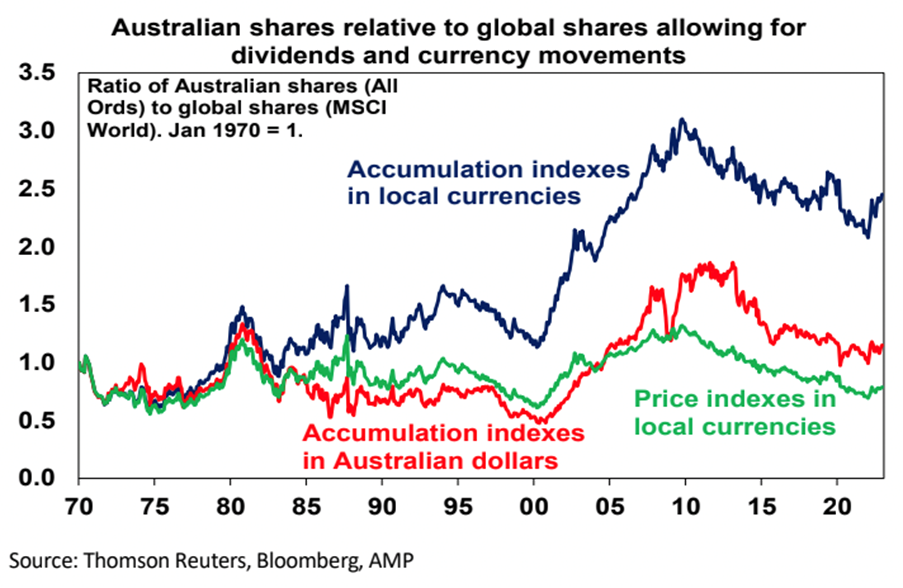
A rising ratio means Australian outperformance and vice versa. Several things stand out.
First over long periods of time and when dividends are allowed for Australian shares have had better returns than global shares.
Since 1970 Australian shares have returned (capital growth plus dividends) 10.1% per annum compared to 8.2% pa for global shares in local currency terms. The falling Australian dollar over this period has enhanced the return from global shares to 9.8% pa but they still underperformed Australian shares.
Second, the swings in the relative performance of Australian shares are apparent if dividends and currency movements are allowed for or not - in particular in the big outperformance in the 2000s and underperformance since 2009. Since October 2009, when Australian shares peaked relative to global shares, Australian shares have returned 7.7% pa compared to 9.7% pa from global shares in local currencies or 11.3% pa in Australian dollar terms.
Seven reasons Australia’s underperformance is likely over
Over the last year Australian shares have outperformed global shares and the various comparisons in the last chart have hooked higher. It could just be noise, but several fundamental considerations suggest that the structural relative underperformance since 2009 is likely to be over:
- Mean reversion – after 12 years of underperformance & the reversal of the 2000s outperformance Australian shares are due for a lengthy period of outperformance. Consistent with this, Australian shares are trading on a lower forward price-to-earnings multiple of 14.5 times than global shares on 15.3 times & US shares on 17.1 times.
- A new super cycle in commodities – the commodity price slump from their 2008-2011 highs looks to be over with commodities embarking on a new super cycle bull market driven by constrained supply after low levels of investment and low inventories for most commodities, decarbonisation driving increased demand for metals and increased defence spending on the back of increased geopolitical tensions which is metal intensive. This will benefit Australia’s resource stocks.
- The Australian Dollar is no longer expensive - the surge in the Australian dollar to $US1.10 of 2011 has long ago reversed with the $A hitting a low of $US0.57 in 2020 & $US0.62 last year making Australian companies more competitive.
- Stronger growth potential - Australia’s potential growth rate remains higher than the US, Europe & Japan due to higher population growth.
- Relatively high dividends - Australian shares pay a higher dividend yield than traditional global shares: 4.4% versus 2.5%. This is important because dividend payments are a big chunk of the return an investor will get and so the higher the better. Franking credits add around 1.3%pa to the post tax return for Australia-based investors.
- Less aggressive monetary tightening - RBA monetary policy is no longer relatively tight compared to other major central banks, notably the Fed. It has been taking a more balanced approach to returning inflation to target. Higher than expected December quarter inflation is a concern and is now likely to see the RBA hike rates by another 0.25% in February. But it's likely to be the peak in inflation as supply is improving, freight costs have fallen and demand is slowing and its unlikely to see the RBA adopt a more aggressive policy compared to other major countries.
- A thawing in the China relationship – the risk of a sharp deterioration in the trade relationship with China appears to be receding (at least for a while) helped by a change of Government in Australia.
Finally, while Australian property prices likely have more downside there is no sign of a property crash dragging down banks and the economy into recession. In the absence of much higher interest rates this looks unlikely.
Learn how the industry leaders are navigating today's market every morning at 6am. Access Livewire Markets Today.
Shane Oliver is Chief Economist and Head of Investment Strategy at AMP. All prices and analysis at 30 January 2023. This information was produced by Airlie Funds Management. Investment in Airlie Australian Share Fund (“Fund”) is offered by Magellan Asset Management Limited ABN 31 120 593 946 AFS Licence No. 304 301. This material is intended to provide general advice only. It has been prepared without having regard to or taking into account any particular investor’s objectives, financial situation and/or needs. All investors should therefore consider the appropriateness of the advice, in light of their own objectives, financial situation and/or needs, before acting on the advice. This article does not reflect the views of WealthHub Securities Limited.