Which Australian bank should investors pick following half-year results?
Over the last few days, three of the four major banks (ANZ, NAB, and Westpac) have reported their half-year profit results. On paper, they largely met expectations and surprises were at the margin. But there were key differences in operating performance.
The results were characterised by continuing interest margin pressure (although this will now ease with interest rates going up), some improvement in volumes, largely flat costs and extraordinarily low (or negative) bad debts. In a strategical sense; still a “stick to my knitting approach” – there is only a limited appetite to take on new risk.
Here is a review of their performance over a number of key attributes, and why NAB remains my top pick. And who do the brokers like?
Profit
ANZ: Cash profit $3.1bn, down 3% on 2H21
NAB: Cash profit$3.5bn, up 8% on 2H21
Westpac: Cash profit of $3.1bn, down 1% on 2H21
Operating Performance
ANZ: Excluding bad debts, discontinued operations, large notable items and tax, underlying profit of $4.1bn, down 10% on 2H21 and 14% on 1H21.
NAB: Underlying profit of $4.9bn, up 10.2% on 2H21 and 6.3% on 1H21.
Westpac: Underlying profit of $4.6bn, up 5.7% on 2H21 but down 10.4% on 1H21
Volumes
ANZ: Home lending portfolio grew by $0.4bn to $278.4bn. Business lending in Australia grew by $1.0bn. New Zealand loans grew by NZ$4bn.
NAB: Home lending portfolio grew by $13.0bn to $322bn. Business lending in Australia grew by $16.2bn. Lending to SMEs (small-medium enterprises) grew by $7.7bn. New Zealand loans grew by NZ$3.1bn
Westpac: Home lending portfolio grew by $2.7bn to $458.3bn. Business lending grew by $2.6bn. New Zealand loans grew by NZ$1.3bn
Margins
ANZ: Net interest margin fell from 1.65% to 1.58bp, down 7bp. Excluding treasury and markets, the decline was 6bp.
NAB: Net interest margin fell from 1.69% to 1.63bp, down 6bp. Excluding treasury & markets, the decline was 2bp.
Westpac: Net interest margin fell from 1.98% to 1.85%, down 13bp. Excluding treasury& markets, the decline was 17bp to 1.70%.
Expense Growth
ANZ: Expenses up 2% on 2H21. Excluding additional investment expenses, flat “run the bank” expense growth.
NAB: Operating expenses were flat on 2H21. NAB is forecasting expense growth for the full year of 2% to 3%, which includes work on its recently announced enforceable undertaking with AUSTRAC. It has abandoned its target of absolute cost reduction by FY23-25.
Westpac: Operating expenses fell 10% from $5,700 million to $5,135 million. This was partly due to lower investment expenses. Ongoing expenses fell by $170 million or 3.0%. Recommitted to reducing its absolute cost base to $8bn by FY24.
Bad debts
ANZ: Net negative credit impairment charge of -$284 million (i.e. a writeback of previously incurred charges).
NAB: Credit impairment charge of $2 million.
Westpac: Credit impairment charge of $139 million.
Capital
ANZ: CET 1 (Common Equity Tier One) ratio fell to 11.5%. Future capital management initiatives (such as buybacks) are off the agenda.
NAB: Capital ratio of 12.5%, but 11.7% on a Pro-forma basis after the acquisition of the Citigroup business is taken into account. A further $2.5bn on-market share buyback will commence in May.
Westpac: CET 1 ratio of 11.3%, but 11.5% on a Pro-forma basis after divestments in train are realised.
Return on Equity
ANZ: 10.0%
NAB: 11.3%
Westpac: 8.8%
Dividend
ANZ: Interim dividend unchanged at 72c per share.
NAB: Interim dividend up 13c to 73c per share.
Westpac: Interim dividend up 3c to 61c per share.
Strategy
ANZ: “Steady as she goes” is one way to describe it. The Bank has high hopes for its new retail banking platform, ANZ Plus.
NAB: A “back to basics” strategy, focused on better and faster experiences for the customer. Aiming for disciplined growth in all core businesses, with market leadership in business and private banking.
Westpac: Fixing and simplifying. Targeting an absolute cost base of $8bn by FY24 (after the sale of specialist businesses), down from an annualised rate of currently around $8.6bn.
What do the brokers say?
The major brokers are marginally positive on the banking sector. Within the sector, their pick is ANZ.
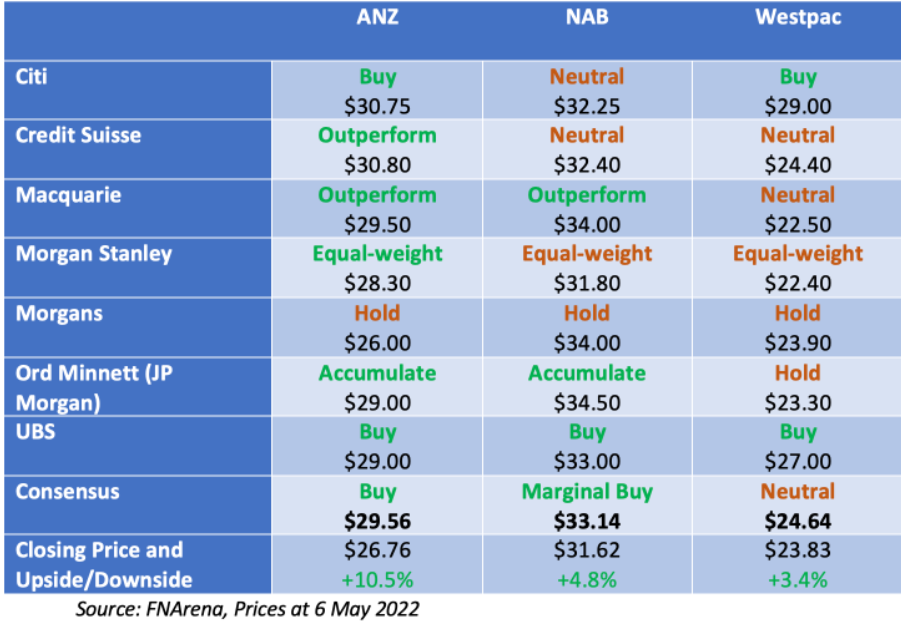
The following tables list broker recommendations and target prices, and consensus forecasts, for the 3 major banks (source: FNArena). It highlights that the differences between the banks are at the margin. While strong conclusions are hard to draw, the following statements can be made:
- ANZ is the most preferred bank, with upside potential to its target price of 10.5%;
- Citi, Credit Suisse and Morgan Stanley prefer ANZ Bank. UBS likes all banks but prefers Westpac. Macquarie and Ord Minnett prefer ANZ and NAB;
- On earnings and multiples, the brokers forecast the most improvement in earnings between FY22 and FY23 for Westpac. Looking at FY23 multiples, NAB is marginally more expensive than Westpac and ANZ; and
- Dividends are forecast to yield about 5%. ANZ has the highest forecast dividend yield.
Broker Recommendations and Target Prices
Consensus Forecasts: Earnings, PE, Dividends and Yield
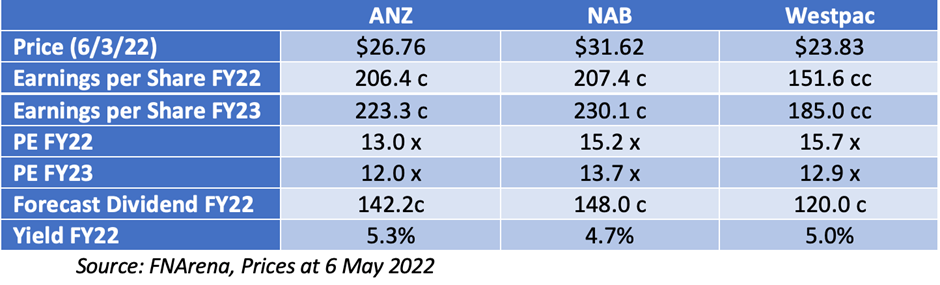
(Note: The broker forecasts for Westpac were made prior to the release today of its half-year profit result).
Bottom Line
The brokers prefer ANZ largely on the basis that it is cheaper. My read on ANZ is that it is “not doing that much”, although the ANZ Plus platform could prove to be a material development.
My preference is for NAB in that it has strong business momentum in all markets, is making sound progress in simplifying, digitising and streamlining its products and services, and is doing a reasonable job with costs.
Westpac remains the hard one to read. Still in “fix mode”, today’s result was better than expected largely due to strong cost control and higher markets income. However, it is not significantly cheaper on forward earnings multiples.
Although the differences appear to be narrowing, I am sticking with NAB.
All prices and analysis at 9 May 2022. This information was produced by Switzer Financial Group Pty Ltd (ABN 24 112 294 649), which is an Australian Financial Services Licensee (Licence No. 286 531This material is intended to provide general advice only. It has been prepared without having regard to or taking into account any particular investor’s objectives, financial situation and/or needs. All investors should therefore consider the appropriateness of the advice, in light of their own objectives, financial situation and/or needs, before acting on the advice. This article does not reflect the views of WealthHub Securities Limited.