Let’s look at Australia’s three big insurers: QBE, Suncorp & IAG
Insurance companies are unique beasts on the stock exchange, in terms of how they earn their money. An insurance company generates revenue by earning a margin, or the difference between what it takes in from the premiums customers pay for their insurance, and what it pays back to them as claims. The company also invests the money that it takes from customers before it is paid out for claims – this invested money is known as the “float”.
There are two components to profitability for an insurance company. First, there is the actual insurance business, the business of selling insurance policies and hopefully, bringing in more money in premiums than you pay out as claims. This is known as the “underwriting profit”. But many insurers are happy with a small profit, or to break even when it comes to underwriting.
The second, and often more important way that insurance companies make money is by investing their premium income float (that is, the policyholders’ funds) in areas such as high-quality shares, bonds and other interest-bearing assets, to make an investment profit. And as interest rates rise, that theoretically becomes far more achievable.
By adding the investment return earned on the float to the underwriting profit, you get the “insurance profit”. Investing the company’s shareholders’ funds, in the same way, can also add to profit.
At the top of the revenue-to-profit reconciliation is gross written premium (GWP), which is the revenue the insurer receives for selling its insurance policies. Then comes the net earned premium (NEP), which is the gross premium minus reinsurance costs. For earnings and valuation purposes the NEP is most important, but the GWP shows you how the company is growing.
Subtract from the NEP the claims received, as well as the expenses incurred in the course of business, and there’s the underwriting profit (or loss).
Of course, we’re hoping for the underwriting profit to be boosted by the investment profit – some analysts call this an “earnings multiplier”.
After the insurance profit, all the net corporate expenses of running the business, and any interest paid come out, and any investment income on the shareholders’ funds can be added, to arrive at net profit before tax. Then, after the company tax expense, you have the net profit after tax and before amortisation, any impairments, and paying any minority interests – then you have the net profit after tax attributable to the shareholders.
The major ratios to look at are:
- The loss ratio (or claims ratio), which is the ratio of the net claims expense to NEP; and
- The expense ratio, which is the ratio of underwriting expenses to NEP; in simple terms, this is the amount the company spends on its underlying expenses in order to run its business.
These two ratios together equal the combined ratio. The combined ratio plus the investment returns earned give the insurance profit margin. This margin is arguably the most important measure of an insurer’s performance and profitability; it’s the one that analysts watch most closely.
The ASX’s big three insurers – QBE (QBE), Suncorp (SUN) and Insurance Australia Group (IAG) – have struggled in recent years, hit by insurance losses on natural disasters and the struggle to generate investment earnings. Earnings can swing wildly on insurance claims. And all – particularly Suncorp and IAG – have flagged that rising natural disaster claims and surging inflation will push premiums higher, and there is a concern about the extent to which customers will accept that.
But at current share price levels, analysts are reasonably bullish on the prospects for the underlying businesses – and with robust dividend yields, I think investors are being offered very attractive total-return prospects by these stocks.
Here’s a closer look at the trio.
1. QBE (QBE, $12.10)
Market capitalisation: $17.9 billion
Expected FY23 (December) dividend yield: 5.7%, 10% franked (grossed-up, 6%)
12-month total return: 0.4%
3-year total return: 2.8% a year
Analysts’ consensus price target: $15.92 (Stock Doctor/Thomson Reuters, 11 analysts), $15.724 (FNArena, seven analysts)
QBE Insurance Group is a much more global and diversified business than the other two, comprising a general insurance and reinsurance group split into geographical business units – North America (32% of GWP), Asia-Pacific (29% of GWP) and International (39% of GWP). QBE is a calendar-year balance-date company, so its recent report was for the first half.
GWP rose by 17%, to US$11.5 billion, led by a 24% surge in its US business. QBE reported a statutory underwriting profit of US$1.19 billion compared with US$642 million in the first half of 2021, equating to a combined operating ratio of 82.5%, compared with 90.2%. Adjusted for various factors such as lower expense/commission ratios and lower catastrophe costs, the combined operating ratio, at 92.9%, was an improvement on the first half of 2021, which was 93.3%.
The insurance profit came in at US$644 million, down 4.4%, with the underwriting result down 6.9%, to US$407 million. But overall profit was affected by a negative return of –$US840 million on the company’s investment portfolio, a remediation program in Australia, and a $U$75 million provision for exposure to the Ukraine conflict.
This meant that the reported net profit, at U$151 million, was a sharp fall from $U$441 million last year, but the market expected a lot worse: the reported result came in well above the analysts’ consensus, which expected about US$100 million; and the half-year dividend also beat expectations, at 9 Australian cents (about 2 cents above consensus expectations, but down from 11 cents a year ago).
Reflecting a global trend toward rising insurance costs, QBE said its premium rates rose by 8.1% globally, and 9.1% in Australia, where disaster costs surged because of wild weather including this year’s severe floods.
QBE’s guidance for premium revenue and higher returns on its investment portfolio was upbeat. Broker Morgans points out that the positive impact of higher interest rates can be seen in the exit running yield (that is if sold now) on QBE’s investment portfolio, which was 2.49% in the half, compared to just 0.68% a year ago.
Analysts reacted reasonably positively to the company’s guidance, lifting 2023 earnings expectations in particular. Where QBE earned US47.2 cents a share in 2021, analysts expect about US53.9 cents in 2022 and a surge to about US97.5 cents in 2023.
The dividend expectations (on Stock Doctor/Thomson Reuters’ analysts’ collation) equate to a projected yield of about 3.4% for 2022 and 5.8% for 2023, but with a franking level of just 10%. Still, that would have QBE, at a share price of $12.10, paying close to 6% grossed-up in 2023 – not bad for a stock with a consensus price target of close to $16.
QBE Insurance Group Limited (QBE)
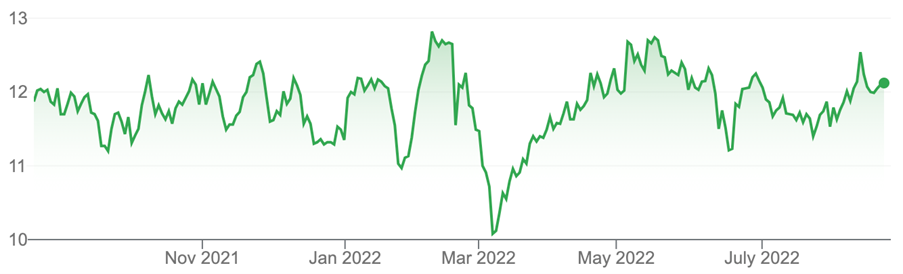
Source: nabtrade
2. Suncorp (SUN, $10.98)
Market capitalisation: $13.9 billion
Expected FY23 dividend yield: 6.2% fully franked (grossed-up, 8.9%)
12-month total return: –7.7%
3-year total return: –1.6% a year
Analysts’ consensus price target: $13.20 (Stock Doctor/Thomson Reuters, nine analysts), $13.108 (FNArena, six analysts)
The Queensland-based Suncorp Group is not only an insurer – it also has a Banking & Wealth operation, but earlier this month it struck a $4.9 billion cash deal to sell its banking business to ANZ. The banking operation contributed to the FY22 result, but once the Suncorp Bank sale is approved, the company will be a pure-play insurer, with a stable of brands including AAMI, GIO, Bingle, Apia, Shannons, Vero and AA Insurance.
Suncorp generates most of its income through its insurance business in Australia and New Zealand, but the company has always said that its banking operation provides a defensive aspect to the business. But Suncorp’s major institutional investors have been pushing for some time for the company to unload its banking business and capitalise on the strong rerating it would receive as a pure-play insurer.
In what will probably be its last result including the banking operations, GWP increased by 9.2%, to $9.25 billion, which was a strong performance; but natural hazards savaged the company’s bottom line. 35 separate weather events during the year cost Suncorp $1.08 billion in insurance claims, from about 130,000 affected customers – that was a $101 million blowout to its provision for natural hazards. As a result, Suncorp has lifted its natural hazard allowance for FY23 from $960 million in FY22 to $1.16 billion.
On top of this, market volatility saw the investment operation – which manages a $13.7 billion portfolio – deliver a $190 million loss, but this was an improvement on the $453 million loss in the previous year. About 90% of Suncorp’s portfolio is invested in investment-grade (rated at ‘BBB’ or higher) fixed-income assets. Because Suncorp holds its fixed-interest investments to maturity, these reported losses in the portfolio are accounting losses and can be expected to return to profitable holdings in time.
Overall, net profit dropped by 34%, to $681 million, while cash earnings were down by 37%, to $673 million. The final dividend was 17 cents a share, well short of the 46 cents that consensus analyst estimates expected. But Suncorp reiterated its FY23 earnings targets and forecasts – the company expects GWP growth to be in the “mid to high single-digits”.
Again, analysts are positive on Suncorp. Stock Doctor/Thomson Reuters’ analysts’ collation expects earnings per share (EPS) of 92.2 cents a share in FY23, compared to 51.3 cents a share in FY22, and a further increase to 98.4 cents a share in FY24. From that, the expected full-year dividend per share rises from 40 cents in FY22 to 69 cents in FY23 and 76.5 cents in FY24.
On FNArena’s collation of analysts’ estimates, the EPS expected for FY23 is 90.5 cents and for FY24 it’s 99.3 cents, leading to dividend forecasts of 68.7 cents for FY23 and 77.2 cents for FY24. (There’s a high likelihood as well of a special dividend. In FY23, a capital return from the sale of the Suncorp Bank.)
Suncorp Group Limited (SUN)
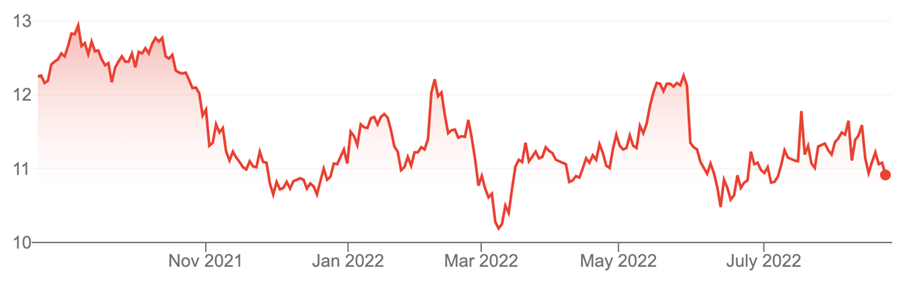
Source: nabtrade
3. IAG (IAG, $4.53)
Market capitalisation: $11.1 billion
Expected FY23 dividend yield: 5.5%, 31.8% franked (grossed-up, 6.2%)
12-month total return: –13.8%
3-year total return: –14.1% a year
Analysts’ consensus price target: $5.18 (Stock Doctor/Thomson Reuters, nine analysts), $4.966 (FNArena, seven analysts)
IAG operates mostly in Australia and New Zealand – on a 70:30 profit split – but it also has investments in Malaysia and India. Its stable of household and business insurance brands includes NRMA, RACV, SGIO, CGU and State Insurance NZ.
In FY22, the insurance heavyweight reported a net profit of $347 million – a rebound from last year’s $427 million loss – and GWP growth of 5.7% to $13.3 billion, an improvement from the 3.8% growth in FY21. But cash earnings (which strip out the one-off items such as changes to provisions) slumped from $747 million a year ago, to $213 million. That saw the full-year dividend cut from 20 cents to 11 cents.
The net insurance profit was down 41.8% from FY21, at $586 million: the net insurance margin was weaker than expected, at 7.4% — the company’s guidance had foreshadowed a 10-12% range — mainly resulting from (like Suncorp) the natural disasters cost ballooning from an allowance of $765 million to an actual cost of $1.11 billion. Claims relating to extreme weather events more than doubled across Australia and New Zealand. IAG reacted by lifting its provision for natural disaster claims in FY23 by about 19%, to $909 million, its largest-ever allowance. The underlying insurance margin was 14.6%, down from 14.7% in FY21.
Guidance was on the positive side, with IAG expecting to see “mid-to-high single-digit” GWP growth this year, and a 14-16% insurance margin. Over the medium term, the insurer is aiming to pull its margins higher, to 15-17%.
Insurance Australia Group Limited (IAG)
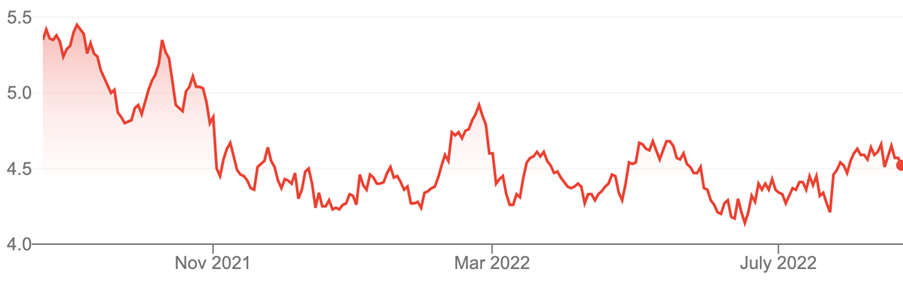
Source: nabtrade
All prices and analysis at 22 August 2022. This information was produced by Switzer Financial Group Pty Ltd (ABN 24 112 294 649), which is an Australian Financial Services Licensee (Licence No. 286 531This material is intended to provide general advice only. It has been prepared without having regard to or taking into account any particular investor’s objectives, financial situation and/or needs. All investors should therefore consider the appropriateness of the advice, in light of their own objectives, financial situation and/or needs, before acting on the advice. This article does not reflect the views of WealthHub Securities Limited.