


Q2 CPI raises the bar to additional tightening further
Taylor Nugent | Senior Economist
Key points
- Q2 trimmed mean was 3.6% yoy (NAB and consensus 3.7%)
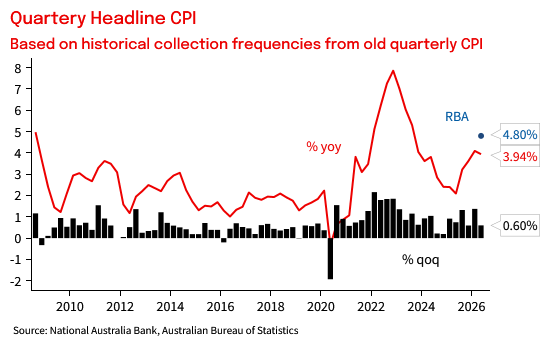
- June headline CPI was 3.8% (NAB and consensus 4.0%)
- The June month showed some encouraging deceleration in New Dwellings inflation
- Relative to the RBA forecasts, headline inflation was sharply lower than earlier forecast due to lower fuel prices, and quarterly trimmed mean was a tenth below their forecast
- NAB continues to expect the RBA will leave rates on hold before a gradual normalisation next year.
RBA Implication
Q2 headline inflation was sharply lower than what the RBA had forecast in May due to the sharp fall in fuel prices and softer than anticipated travel prices. Low quarterly outcomes for those volatile components also flattered the quarterly trimmed mean, but today’s data is still encouraging.
Governor Bullock said yesterday that underlying inflation outcomes had “evolved broadly as we expected back in May.” That assessment will shift favourably today, if only marginally. The Q2 data feels a bit more dated than usual. Cost pressures have re-emerged over recent weeks, but at the same time, indicators of domestic capacity pressures have eased a little. Ongoing conflict in the Middle East remains a threat to inflation, inflation expectations and hence the policy rate outlook, but today’s data will allow the RBA to watch and see the impact of the competing influences from the Middle East, the slowing in the housing market and the 75bps of cash rate increases this year. Importantly, some of the most explicit signs of cost passthrough in May look to have faded in June. This is consistent with paused progress on underlying inflation since the beginning of the conflict being a narrow consequence of cost push dynamics rather than a reflection of broader domestic conditions.
NAB continues to expect the RBA will hold policy rates at their current somewhat restrictive level of 4.35% this year, before a gradual normalisation beginning from May 2027.
Q2 Quarterly Trimmed Mean
Q2 trimmed mean was 0.81% qoq and 3.65% yoy, a little below our and consensus forecasts for 0.9/3.7. Relative to our forecast, about half the surprise came from component-level misses (softer domestic travel and clothing and footwear), with the rest coming from shifting seasonal factors (Q1 2026 was revised 3.5bp lower). That tempers the good news a little. Year-ended trimmed mean at 3.65% is a tenth below the RBA’s 3.76% yoy May SoMP forecast and the surprise fallback in fuel prices is worth 8bp of that surprise.
June Monthly CPI
In the month, headline inflation was 3.8% (NAB and Consensus 4.0%) and trimmed mean was 3.64% (NAB and consensus 3.7%). Across components of interest, the deceleration in New Dwelling inflation (0.4% mom in June) is encouraging. Many retail goods were soft, although market goods inflation was supported by surprising strength in volatile vehicle prices in the month. Restaurant and takeaway inflation was a little cooler than May but remains stronger than the benign outcomes earlier in the year. Broader market services inflation slowed a little.
New Dwelling inflation slowed to 0.4% mom, after 0.7% and 0.9% in April and May. The size and frequency of price rises for inputs have cooled, and a softer housing market means passthrough of cost pressures may become more challenging. New Dwelling inflation is softer in Melbourne than Sydney, and is softer in Sydney than the mid-sized capitals, where the demand backdrop is firmer. The rebound higher in diesel leaves pressure elevated in the near term, but the housing demand environment means that as the cost shock fades new dwelling inflation is likely to support the path back to at target inflation next year. Rents inflation was 0.3% mom, continuing its recent run rate, but low vacancy rates and elevated advertised rents growth suggests that may move a little higher looking forward.
Our measure of Markets Services inflation excluding rents and travel was 0.27% mom, back to where it was in March and April before the jump in May. Takeaway food inflation remained higher than its pace earlier in the year, and other financial services inflation was firm at 0.9% over the past three months, although elsewhere in the market services basket inflation was more benign.
Market Goods inflation was supported by a surprise monthly rise in motor vehicles, but elsewhere across market goods end of financial year sales activity and clothing discounting due to warmer weather won out over input cost pressures. Those have moved higher over recent weeks with fuel, although the broader demand environment means that will at least partly be reflected in margin pressures. The NAB survey margins measure fell in Q2. Grocery price inflation remained somewhat elevated in June.
Electricity rebates have now fully unwound, and the contribution of electricity to annual headline inflation has fallen due to base effects as earlier increases drop out of the annual comparison. Electricity was up 22% over the year to the June quarter, down from 32% yoy in Q1. Electricity is still adding around 40bp to year-ended inflation, but that is down 20bp from the previous quarter. We pencil in a small fall in electricity prices in Q3. Default offers are lower this financial year by about 5% on average. But higher supply charges mean average prices won’t fully reflect the decline in usage charges.
Based on historical collection frequencies from old quarterly CPI
Chart 1: Quarterly Trimmed Mean CPI
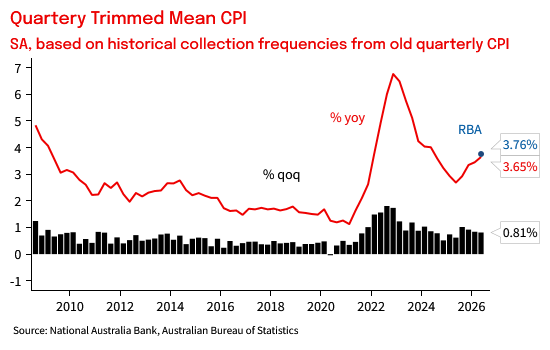
Chart 2: Quarterly Headline CPI
Monthly CPI
Chart 3: Trimmed mean inflation, thin line is quarterly, thick line is monthly
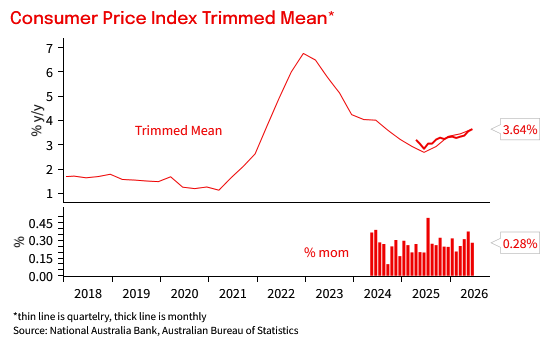
Chart 4: Headline inflation, thin line is quarterly, thick line is monthly
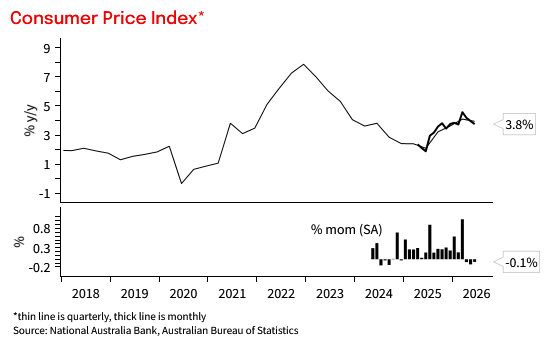
Chart 5: Core measures
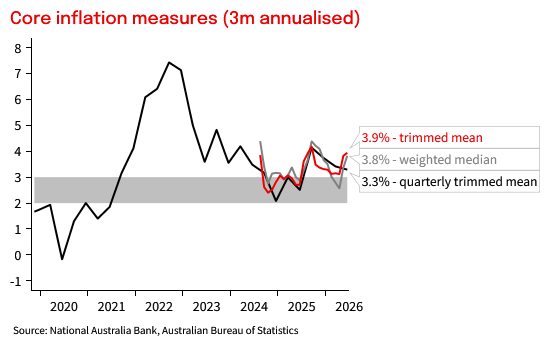
Chart 6: Contributions to Headline CPI
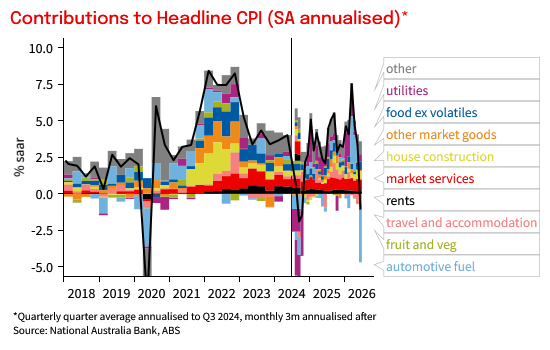
Table 1: CPI heat map. Shows 1- 3-, 6- and 12m annualised outcomes. Shading reflects how far inflation is above or below a benchmark of the 6 years to 2015 when inflation averaged around the mid-point of the target
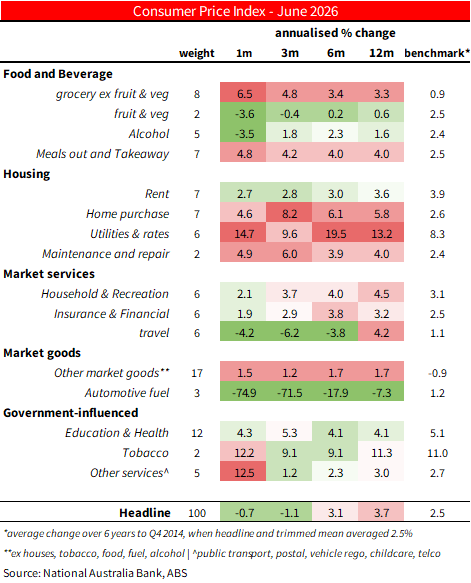
Table 2: CPI heat map. Shows 1- 3-, 6- and 12m annualised outcomes. Shading reflects how far inflation is above or below a benchmark of the 6 years to 2015 when inflation averaged around the mid-point of the target
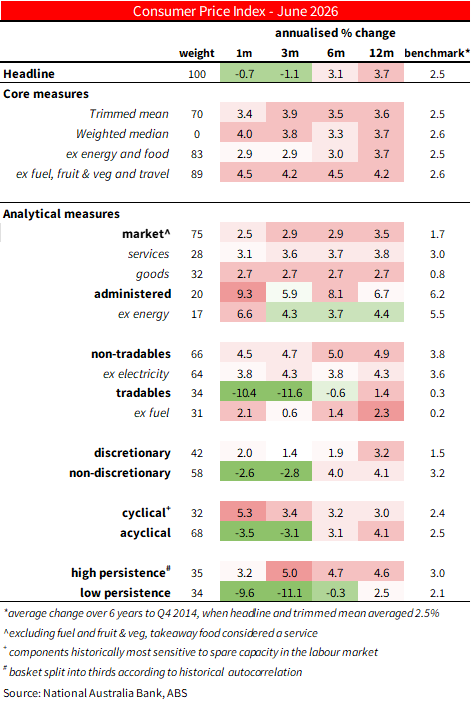
Chart 7: Market Services Inflation
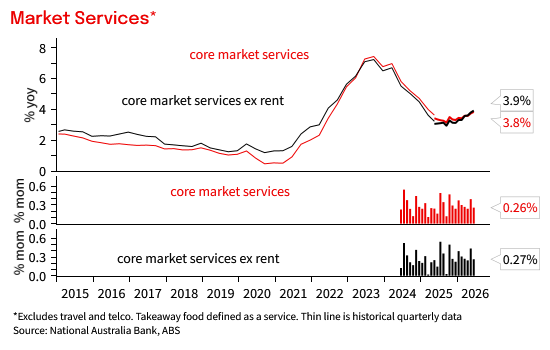
Chart 8: Tradable and non-tradable inflation
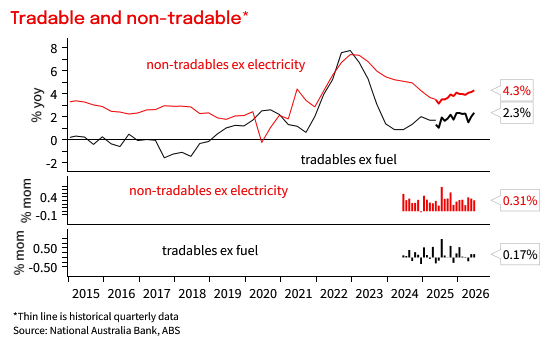
Chart 9: Administered prices
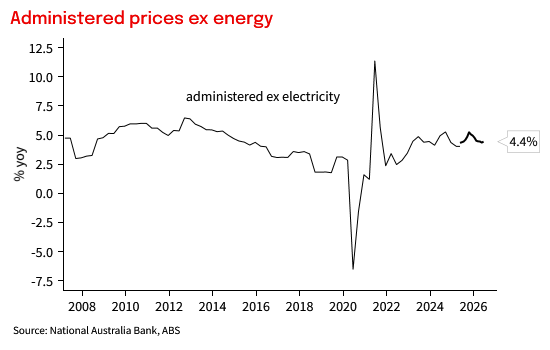
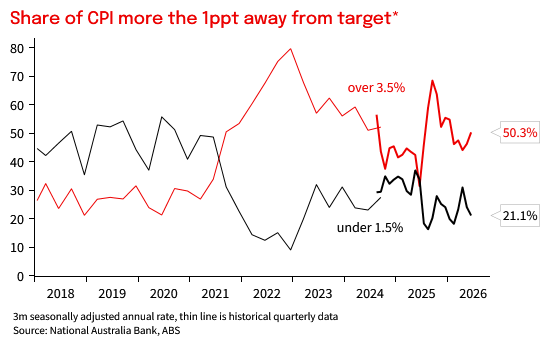
Chart 10: Share of CPI more than 1ppt away from target
This document has been prepared by National Australia Bank Limited ABN 12 004 044 937 AFSL 230686 ("NAB"). Any advice contained in this document has been prepared without taking into account your objectives, financial situation or needs. Before acting on any advice in this document, NAB recommends that you consider whether the advice is appropriate for your circumstances. NAB recommends that you obtain and consider the relevant Product Disclosure Statement or other disclosure document, before making any decision about a product including whether to acquire or to continue to hold it. Please Click Here to view our disclaimer and terms of use. Please Click Here to view our NAB Financial Services Guide.
All prices and analysis at 29 July 2026. This information has been prepared by National Australia Bank Limited ABN 12 004 044 937 AFSL 230686 ("NAB"). The content is distributed by WealthHub Securities Limited (WSL) (ABN 83 089 718 249)(AFSL No. 230704). WSL is a Market Participant under the ASIC Market Integrity Rules and a wholly owned subsidiary of National Australia Bank Limited (ABN 12 004 044 937)(AFSL No. 230686) (NAB). NAB doesn’t guarantee its subsidiaries’ obligations or performance, or the products or services its subsidiaries offer. This material is intended to provide general advice only. It has been prepared without having regard to or taking into account any particular investor’s objectives, financial situation and/or needs. All investors should therefore consider the appropriateness of the advice, in light of their own objectives, financial situation and/or needs, before acting on the advice. Past performance is not a reliable indicator of future performance. Any comments, suggestions or views presented do not reflect the views of WSL and/or NAB. Subject to any terms implied by law and which cannot be excluded, neither WSL nor NAB shall be liable for any errors, omissions, defects or misrepresentations in the information or general advice including any third party sourced data (including by reasons of negligence, negligent misstatement or otherwise) or for any loss or damage (whether direct or indirect) suffered by persons who use or rely on the general advice or information. If any law prohibits the exclusion of such liability, WSL and NAB limit its liability to the re-supply of the information, provided that such limitation is permitted by law and is fair and reasonable. For more information, please click here.