


Unemployment rate rises; rate hike bets slide
Michael Hayes & Taylor Nugent | Markets Research
Key points
- The unemployment rate rose 0.1ppts to 4.7% in September alongside a 39k fall in employment
- That is a softer outcome than NAB and consensus expectations for 4.6% and +20k
- The participation rate unwound last month’s rise to be back at 66.8%
- The unemployment rate is tracking above the RBA August SoMP forecast for unemployment at 4.5% in Q4
- Trend employment growth had been showing still robust hiring, but looks more subdued at +16k
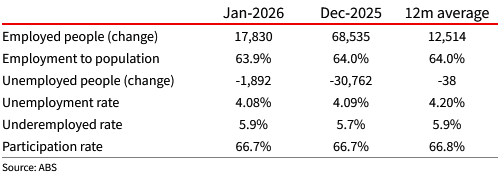
Labour Force Summary Table
Assessment
The September labour market print saw a further 0.1ppt rise in the unemployment rate to 4.7% off the back of a 39k fall in employment. Participation fell to 66.8% from 67.0%. We have been noting over recent months that rising participation has been contributing to the gradual uptrend in unemployment even as trend employment growth remained robust. Today’s data points to slowing employment gains playing a larger role, with trend employment growth now at a much more subdued +16k.
The RBA in September noted that "considerable caution" was warranted when assessing the August labour force data, but with today’s data in hand, they will have to confront more clearly that unemployment has outpaced their August forecast for 4.5% in Q4. We think this is enough to keep the RBA cautious, and continue to expect policy to remain on hold, though we still acknowledge the risk sits with a hike. The rise in the unemployment rate remains gradual, and the more challenging trade-off between inflation and employment means they are likely to be a bit more tolerant of modestly higher unemployment.
Detail
The 39k fall in employment growth this month was driven by a 74k fall in part-time employment which was only partially offset by a 34k rise in full-time employment. The part-time split is very volatile but part-time employment has fallen noticeably over the past 3 months while full-time employment has continued to grow. Trend employment growth is now +16k, revised down from +32k only three months ago, suggesting labour demand has softened. The employment-to-population ratio fell 0.3ppts in the month and underemployment was a tenth higher at 6.3%. Youth unemployment has continued to move higher, rising 0.2ppts in September to 11.1%, but remains below its 2010s average of 12.2%.
By state, trend unemployment rose 0.1ppt across NSW and Queensland and remained flat across the rest of the country. Despite the tick higher in NSW and Queensland trend unemployment in the month, they remain clustered with WA and SA at around 4.3-4.5% while Victoria and Tasmania continue to underperform sitting just above 5%.
We noted last month that residual seasonality may have partially contributed to the August rise in unemployment, but that wasn’t enough to drive today’s outcome. The seasonal factors for September did normalise after August’s adjusted the unemployment rate down less than in previous years due to end of an additional adjustment because of changes to the survey. The ABS has continued to note that their Labour Force Modernisation project may have had some “residual influence” on the seasonally adjusted data. Working in the other direction this month was upward pressure on unemployment from a very low unemployment rate among the one eighth of the sample that exited. There is always uncertainty around monthly employment prints, but there is nothing from these technical factors that leaves a directional bias ahead of next month’s print.
Chart 1: Employment and unemployment
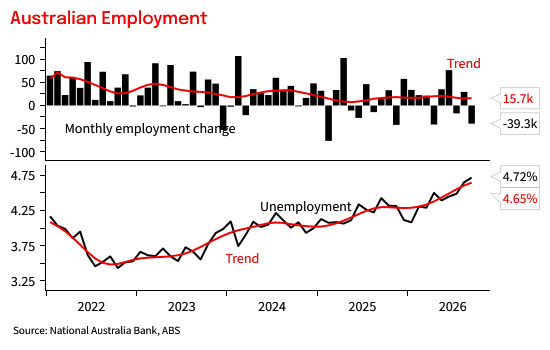
Chart 2: The unemployment rate rose to 4.7% in September
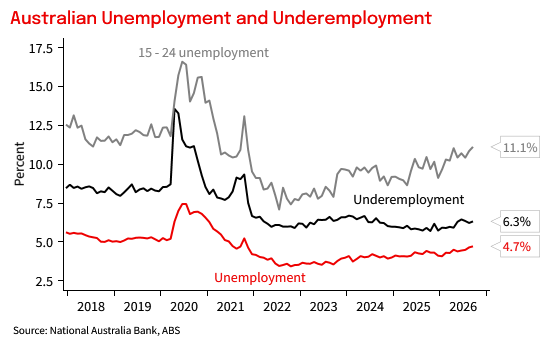
Chart 3: Participation and employment rates fell
Chart 4: RBA unemployment rate forecasts
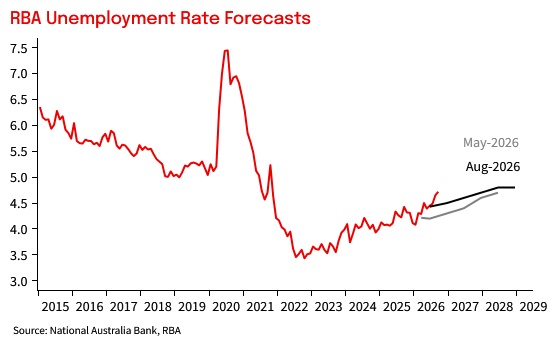
Chart 5: Trend unemployment by state
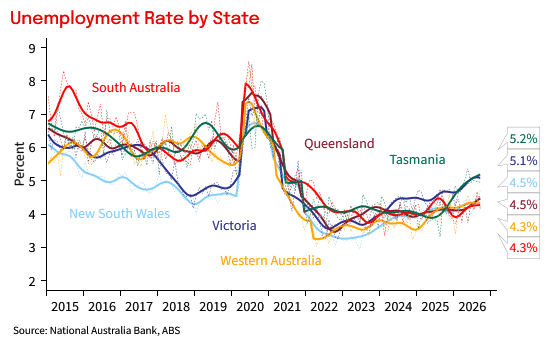
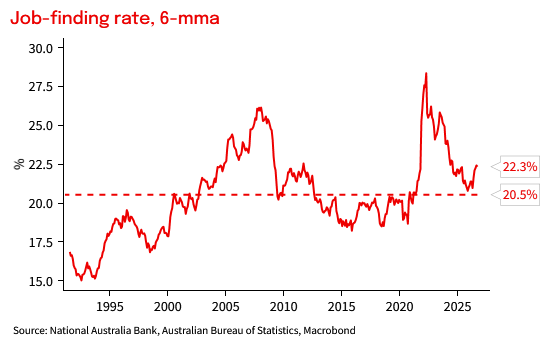
Chart 6: Job-finding rate
This document has been prepared by National Australia Bank Limited ABN 12 004 044 937 AFSL 230686 ("NAB"). Any advice contained in this document has been prepared without taking into account your objectives, financial situation or needs. Before acting on any advice in this document, NAB recommends that you consider whether the advice is appropriate for your circumstances. NAB recommends that you obtain and consider the relevant Product Disclosure Statement or other disclosure document, before making any decision about a product including whether to acquire or to continue to hold it. Please Click Here to view our disclaimer and terms of use. Please Click Here to view our NAB Financial Services Guide.
All prices and analysis at 15 October 2026. This information has been prepared by National Australia Bank Limited ABN 12 004 044 937 AFSL 230686 ("NAB"). The content is distributed by WealthHub Securities Limited (WSL) (ABN 83 089 718 249)(AFSL No. 230704). WSL is a Market Participant under the ASIC Market Integrity Rules and a wholly owned subsidiary of National Australia Bank Limited (ABN 12 004 044 937)(AFSL No. 230686) (NAB). NAB doesn’t guarantee its subsidiaries’ obligations or performance, or the products or services its subsidiaries offer. This material is intended to provide general advice only. It has been prepared without having regard to or taking into account any particular investor’s objectives, financial situation and/or needs. All investors should therefore consider the appropriateness of the advice, in light of their own objectives, financial situation and/or needs, before acting on the advice. Past performance is not a reliable indicator of future performance. Any comments, suggestions or views presented do not reflect the views of WSL and/or NAB. Subject to any terms implied by law and which cannot be excluded, neither WSL nor NAB shall be liable for any errors, omissions, defects or misrepresentations in the information or general advice including any third party sourced data (including by reasons of negligence, negligent misstatement or otherwise) or for any loss or damage (whether direct or indirect) suffered by persons who use or rely on the general advice or information. If any law prohibits the exclusion of such liability, WSL and NAB limit its liability to the re-supply of the information, provided that such limitation is permitted by law and is fair and reasonable. For more information, please click here.