


Q3 CPI confirms too-strong inflation and a November rate hike
Sally Auld, Gareth Spence & Taylor Nugent | Group Economics
Key points
- We now expect the RBA to hike in November.
- Inflation was broadly as expected, but RBA commentary today suggests they have reassessed domestic capacity pressures prior to the CPI release
- Q3 trimmed mean was 1.0% qoq and 3.7% yoy (NAB and consensus 1.0%/3.6%).
- September headline inflation was 4.3% yoy (NAB and Consensus 4.2% yoy)
- The Q3 quarterly data confirms underlying inflation was tracking materially above the RBA’s August forecast
- The September month saw large contributions from volatile fuel, fruit and travel prices
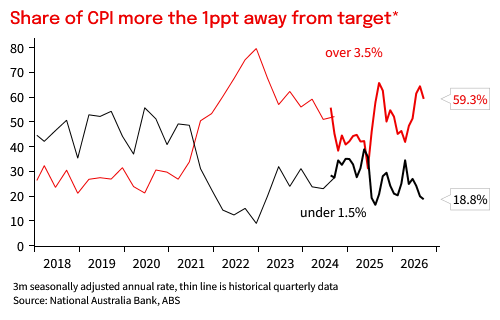
- The rest of the basket continues to show inflation remains high and broad-based, with 59% of the basket rising more than 3.5% in 3m annualised terms
RBA Implication
We now believe that the RBA will deliver a 25bp hike in November. While inflation has printed broadly in line with our prior expectation, two things are now clear. First, it looks likely that the updated forecasts in the November SoMP, released next week, will reveal an upward revision to the staff’s estimate of NAIRU. It is instructive that the Governor noted today that “Despite the unemployment rate recently rising a little more than we had expected, the labour market seems a little tighter than we had previously judged. The evidence for this is elevated underlying inflationary pressures.”
Effectively this implies that despite the unemployment rate sitting 60bp above where it was at the start of the year, the Bank no longer believes this reflects as much of a loosening in the labour market as previously thought. And it follows that a higher unemployment rate is now required to generate the requisite disinflationary pressures on domestic prices. This will require an ongoing slowing in GDP growth, and more restrictive monetary policy to forecast inflation back to target by early 2028.
Second, the broader inflationary backdrop continues to present challenges for the RBA. Both oil and refined product prices are elevated, cost push inflation is evident in domestic inflationary dynamics and Bank officials have stressed of late that global forces appear to be supporting higher inflation outcomes too. Moreover, they remain concerned about the potential for inflation expectations to move higher the longer inflation remains above target.
Further, today’s data continue to show a broad breadth of inflationary pressure, with almost 60% of the CPI basket now running at an annual rate of 3.5% or higher over the past 3 months. Beyond the very near term, the next key test for the RBA will be the October monthly CPI (released on 25 November). This will be complicated by price adjustments related to the change to surcharging arrangements, which look to have led to more price rises in October and will support October and Q4 CPI. The combination of much higher energy costs and the reassessment of domestic capacity pressures will drive an upward revision the RBA’s underlying inflation forecasts over the next few quarters and further push out the expected return to target in next week’s updated forecast set. That makes a November hike likely.
A 25bp hike in November will see the cash rate at 4.85% in November, 150bps above the RBA’s estimate of neutral (~3.4%) and 50bps above the previous peak. Based on historical experience, a gap of this magnitude should be consistent with restrictive monetary policy and thus leave the balance of risks to domestic monetary policy more balanced from here. Still, powerful structural forces are at play, and all of these are working in the direction of higher short- and long-end rates. As such, we expect that the RBA will likely pause post November but will nonetheless remain a long way from declaring victory on inflation and the end of the tightening cycle.
CPI outcome
In terms of today’s inflation data, Q3 CPI came in near expectations, confirming inflation in the quarter was materially stronger than the RBA had forecast back in August. Q3 trimmed mean was 1.0% qoq and 3.7% yoy (NAB and consensus 1.0/3.6), above the RBA’s dated August SoMP forecast, but likely close to their most recent nowcast. Q3 headline inflation was 1.3% qoq and 3.9% yoy. (NAB 1.2/3.9)
In the September month, headline inflation was 4.3% (NAB and consensus 4.2%), and trimmed mean inflation was 0.26% mom, in line with our forecast for 0.25% mom/3.6% yoy. Inflation is elevated and broad-based, with the share of the basket with price annualising above 3.5% over the past 3 months at 59%. Looking forward, fuel prices are set to rise another 7% in October, and make a large contribution to Q4 quarterly outcome. The end of card surcharging will also support measured inflation in the October month, muddying the underlying inflation signal for the RBA.
The key driver of the September outcome was the expected strength in fuel prices, up 9.4% mom and 24% yoy. Other volatile categories were also strong in September, with domestic travel, international travel, and fruit prices all rising by more than usual seasonality. Elsewhere in the basket, grocery price inflation continued to cool in year-ended terms, market services components were generally benign in the September month, and New Dwelling inflation was flat.
Q3 Quarterly Trimmed Mean
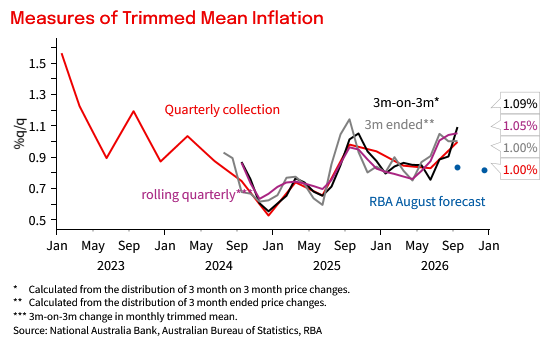
Q3 trimmed mean was 1.00% qoq and 3.66% yoy. Our forecast was for 0.97% qoq. Relative to our forecast, the stronger outcomes than we had forecast for volatile fruit and travel components and revisions to seasonal adjustment factors drove much of the (marginal) difference. Alternate versions of the trimmed mean based on the full monthly data (rather than the historical collection timing) were also strong. 3m-on-3m trimmed mean inflation was 1.09% qoq, and 3m ended trimmed mean was 1.0% qoq.
September Monthly CPI
In the month, headline inflation was 4.3% yoy (NAB and Consensus 4.2%) and trimmed mean was 0.26% mom and 3.59% yoy, as expected. The September monthly outcome was characterised by strength in volatile components, with the marginal month of data not further fuelling concerns about strength in more persistent parts of the basket, even if inflation remains strong on a trend basis.
New Dwelling inflation slowed further at 0.0% mom (1.0% qoq), with cooler demand conditions driving increased promotional activity even as some project home builders continued to pass through cost pressures. Rents inflation was 0.2% mom, as expected, with semi-annual rent assistance indexation subtracting 0.1ppt.
Our measure of Markets Services inflation excluding rents was just 0.15% mom (NAB 0.16% mom), but that still saw the year-ended outcome tick higher to 4.2%. Residual seasonality looks to have boosted market services CPI in July and weighed in September. In a quarterly sense, market services inflation strengthened in Q3 relative to Q2, but many categories including restaurant and takeaway and personal services categories were not as strong in September. Other financial services is measured once per quarter and showed a 1.0% increase over the past 3 months, a bit stronger than expected. Looking ahead, the end of card surcharging has resulted in a higher frequency of price rises in October, which is likely to boost the October outcome, particularly in some market services categories where surcharging is common.
Market Goods inflation was 0.12% mom and 1.5% yoy, as expected, with some softer outcomes for clothing and footwear offsetting a stronger monthly outcome for new vehicles (0.2% mom) than we had pencilled in. Grocery price inflation (ex fruit and veg) remained subdued in September, with the year-ended rate cooling to 2.2% yoy. That’s consistent with the signal on output prices from the NAB Business Survey, although looking forward there are risks to food inflation. Fuel accounts for 3% of the final price of groceries, and 4-5% of the final price of fruit and veg, and El Niño is likely to result in more challenging growing conditions.
Across other components of interest, property rates and charges, which are measured annually in September, cooled from last year but were a little stronger than expected at 5.6%.
Based on historical collection frequencies from old quarterly CPI
Chart 1: Quarterly Trimmed Mean CPI
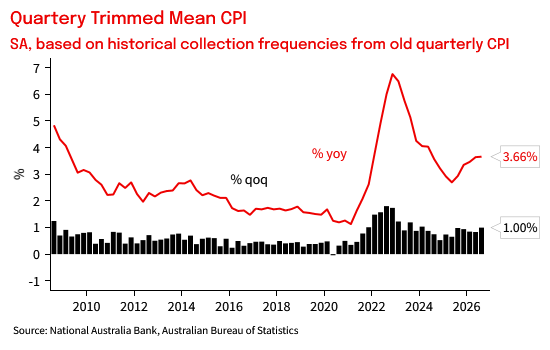
Chart 2: Quarterly Headline CPI
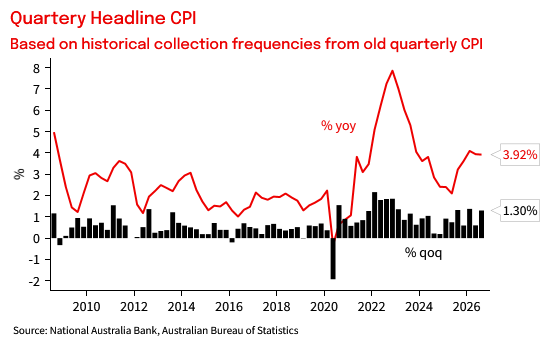
Chart 3: Measures of Quarterly Trimmed Mean CPI
Monthly CPI
Chart 4: Trimmed mean inflation, thin line is quarterly, thick line is monthly
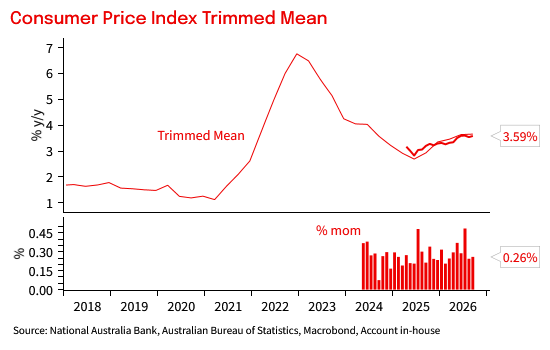
Chart 5: Headline inflation, thin line is quarterly, thick line is monthly
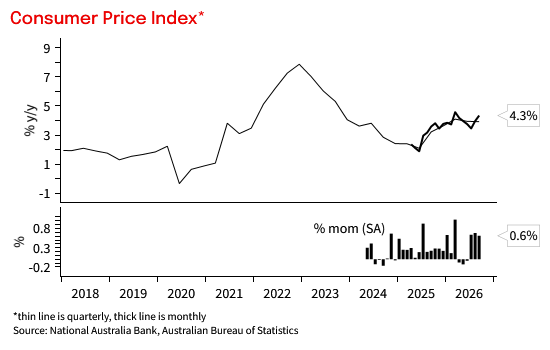
Chart 6: Core measures
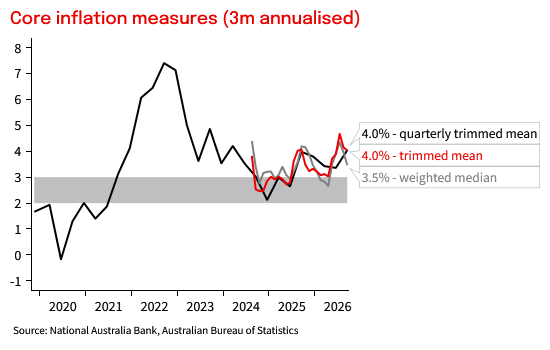
Chart 7: Contributions to Headline CPI
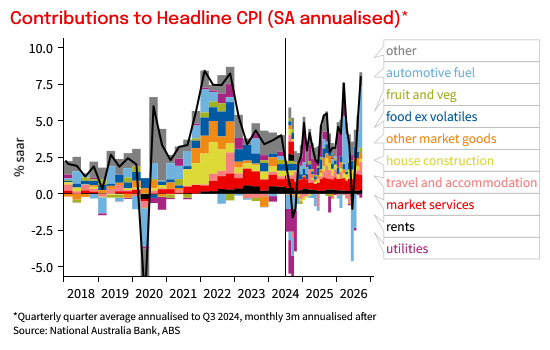
Table 1: CPI heat map. Shows 1- 3-, 6- and 12m annualised outcomes. Shading reflects how far inflation is above or below a benchmark of the 6 years to 2015 when inflation averaged around the mid-point of the target
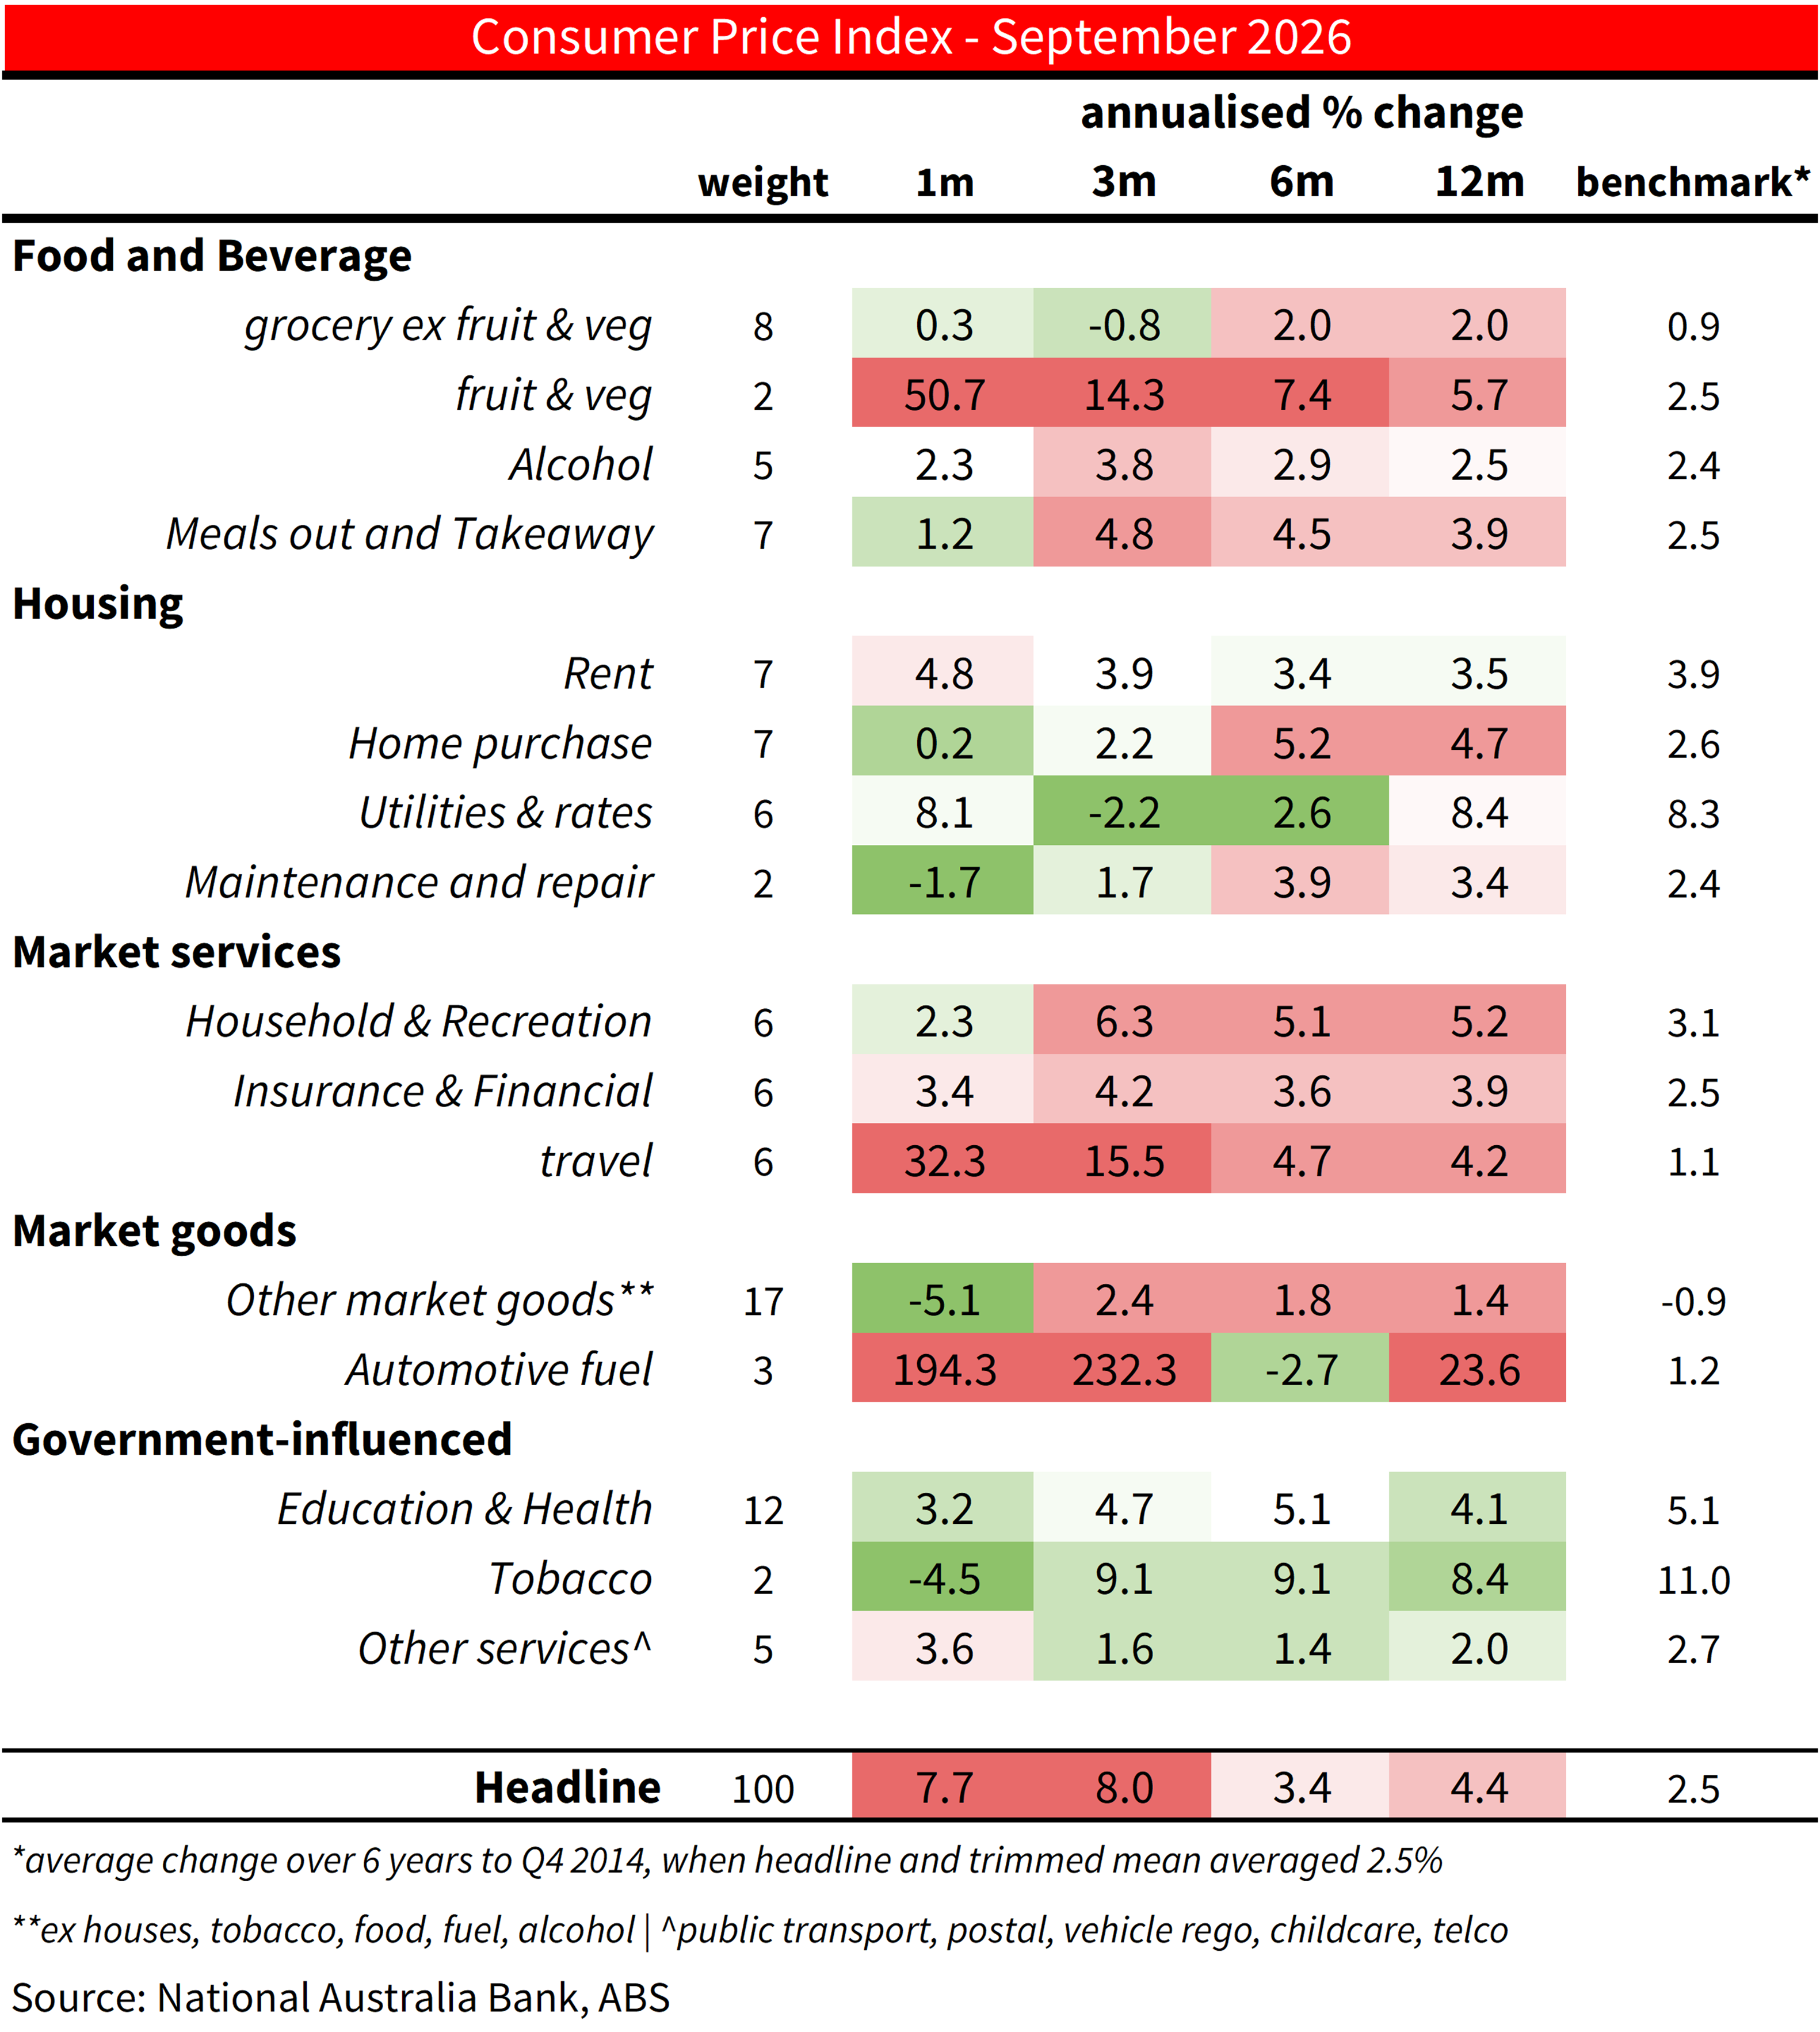
Table 2: CPI heat map. Shows 1- 3-, 6- and 12m annualised outcomes. Shading reflects how far inflation is above or below a benchmark of the 6 years to 2015 when inflation averaged around the mid-point of the target
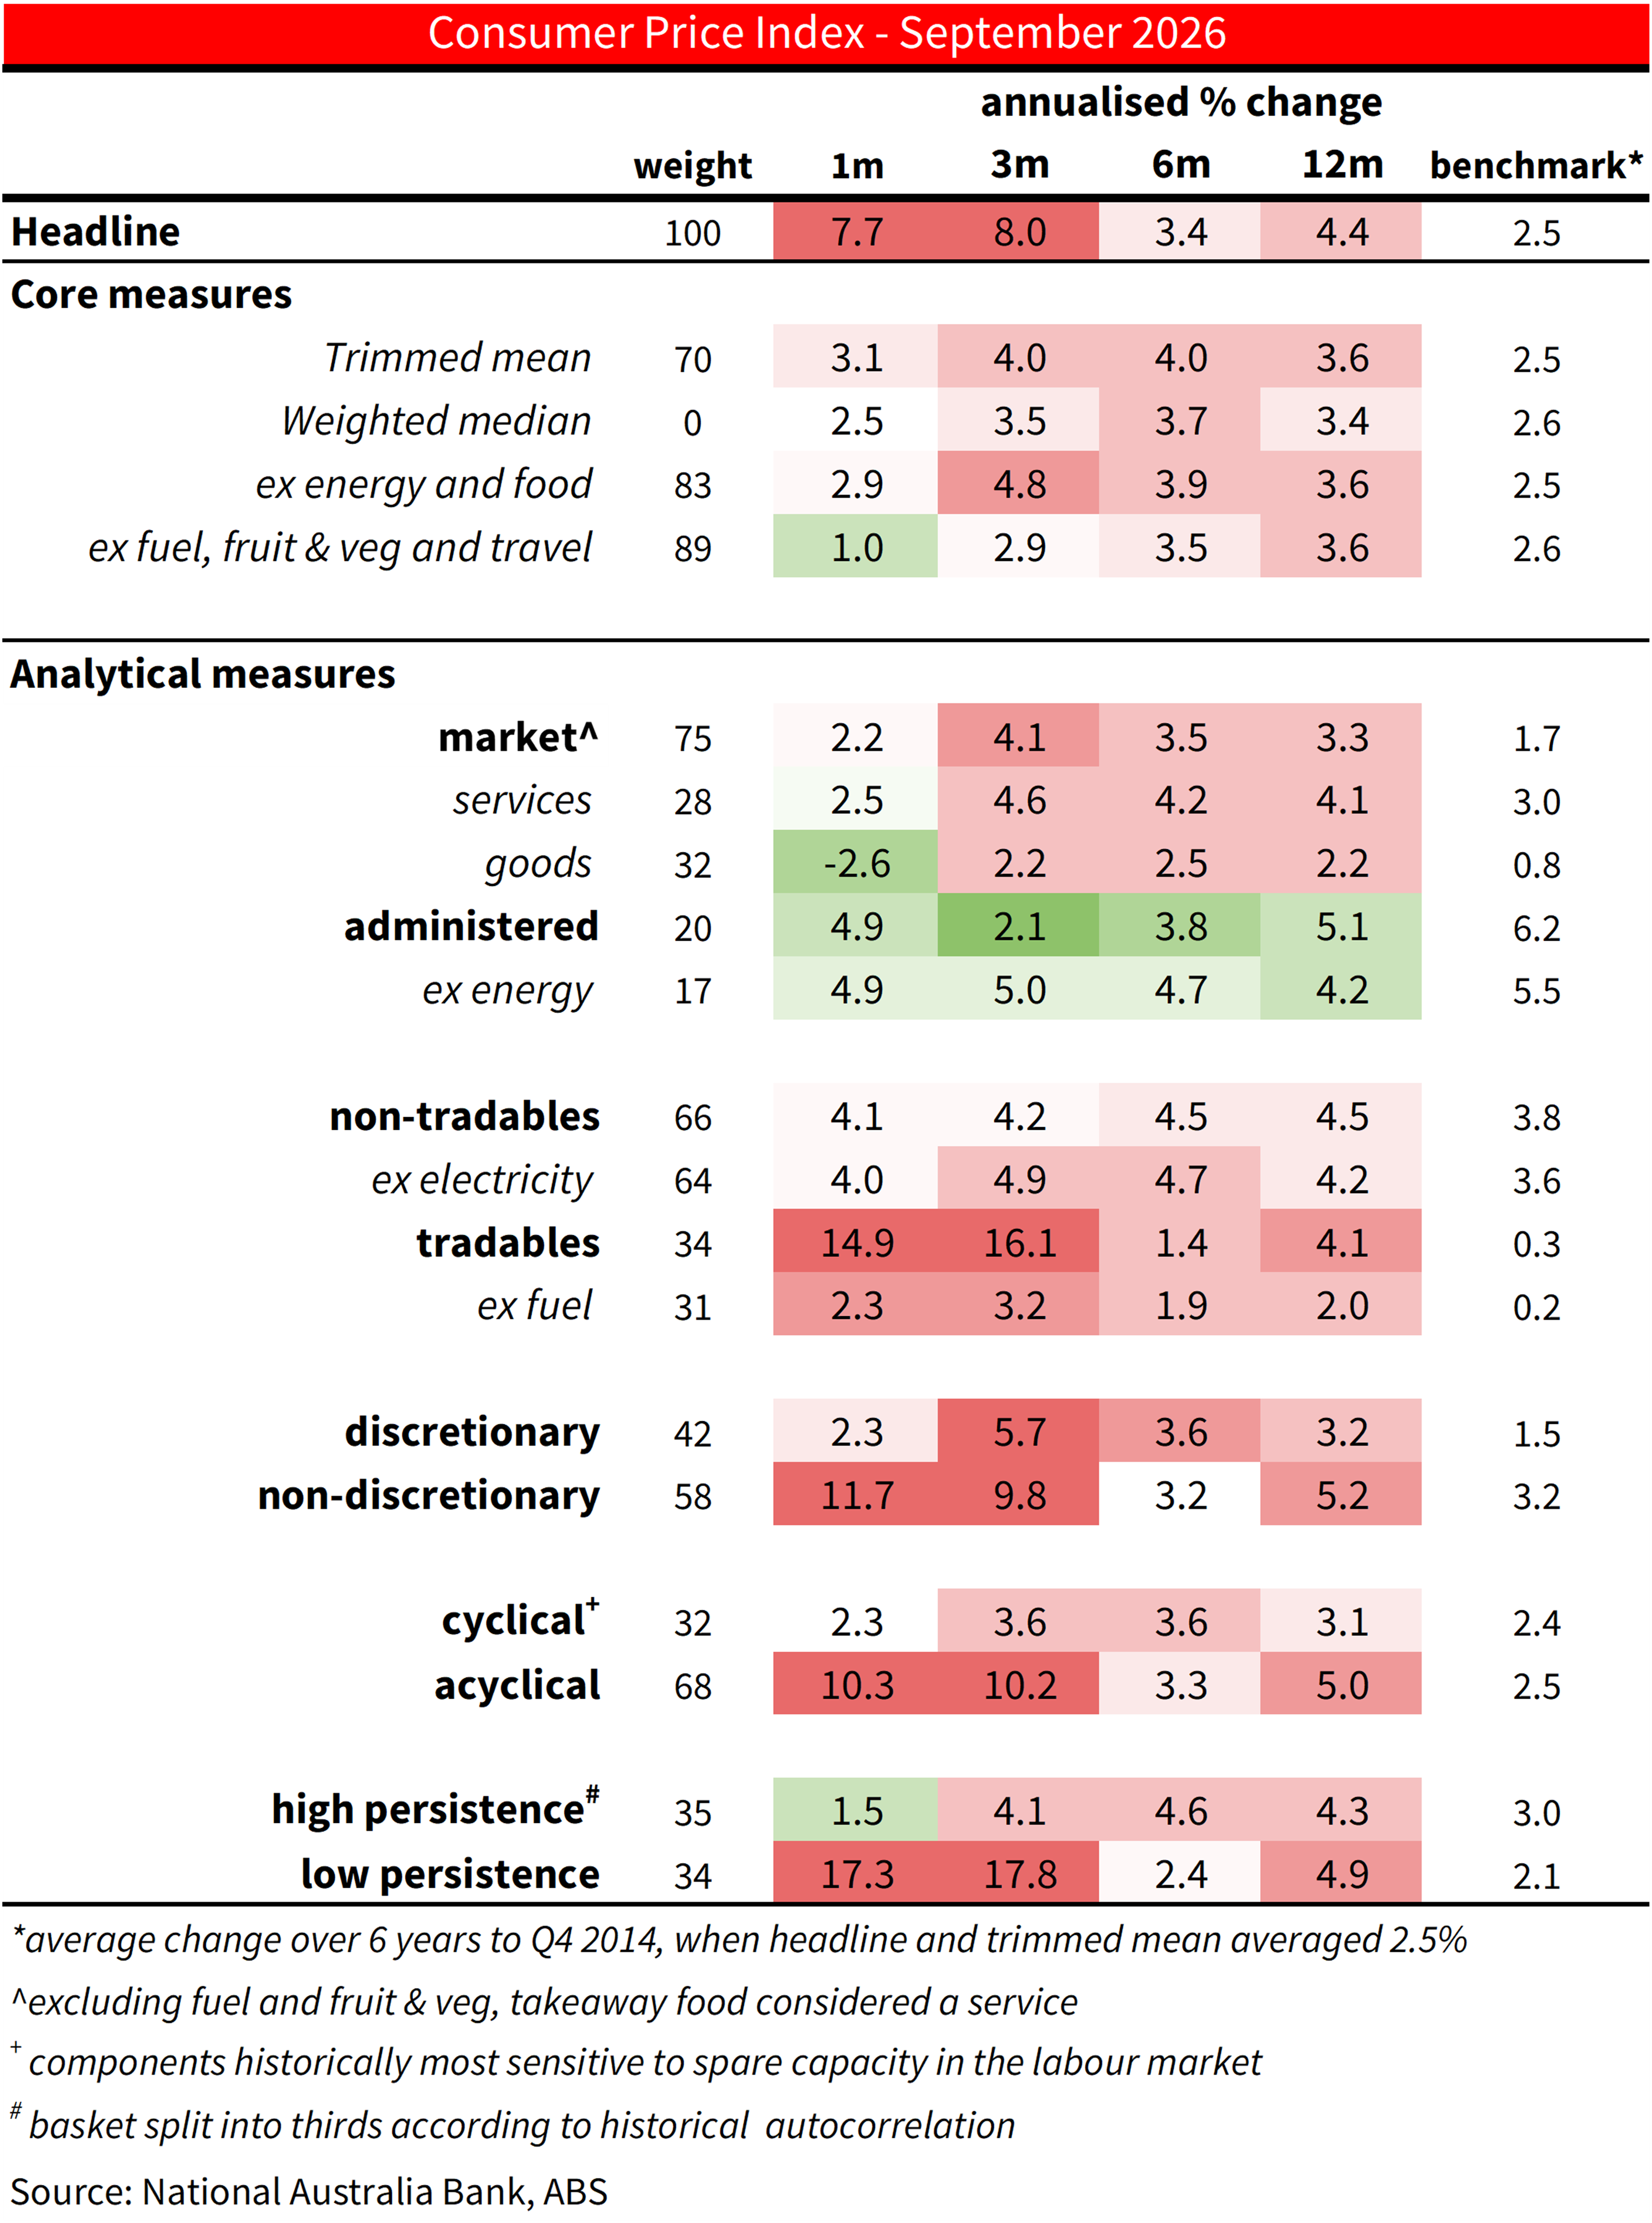
Chart 8: Market Services Inflation
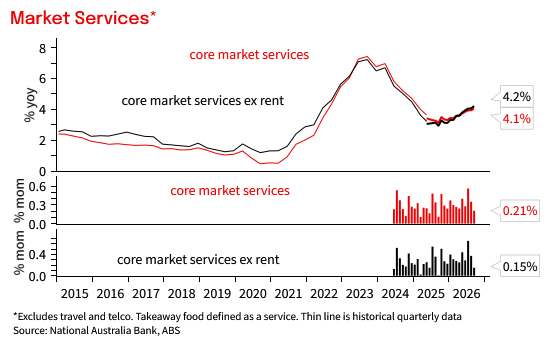
Chart 9: Tradable and non-tradable inflation
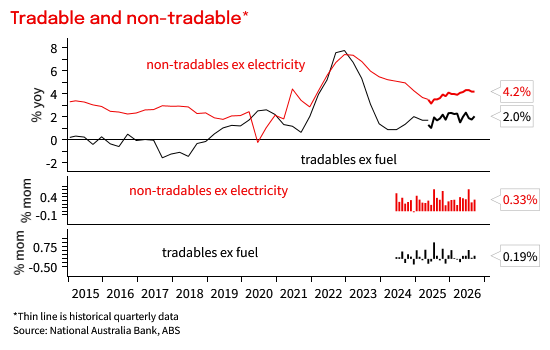
Chart 10: Administered prices
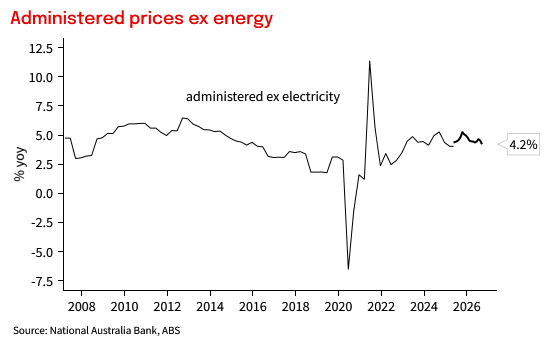
Chart 11: Share of CPI more than 1ppt away from target
This document has been prepared by National Australia Bank Limited ABN 12 004 044 937 AFSL 230686 ("NAB"). Any advice contained in this document has been prepared without taking into account your objectives, financial situation or needs. Before acting on any advice in this document, NAB recommends that you consider whether the advice is appropriate for your circumstances. NAB recommends that you obtain and consider the relevant Product Disclosure Statement or other disclosure document, before making any decision about a product including whether to acquire or to continue to hold it. Please Click Here to view our disclaimer and terms of use. Please Click Here to view our NAB Financial Services Guide.
All prices and analysis at 28 October 2026. This information has been prepared by National Australia Bank Limited ABN 12 004 044 937 AFSL 230686 ("NAB"). The content is distributed by WealthHub Securities Limited (WSL) (ABN 83 089 718 249)(AFSL No. 230704). WSL is a Market Participant under the ASIC Market Integrity Rules and a wholly owned subsidiary of National Australia Bank Limited (ABN 12 004 044 937)(AFSL No. 230686) (NAB). NAB doesn’t guarantee its subsidiaries’ obligations or performance, or the products or services its subsidiaries offer. This material is intended to provide general advice only. It has been prepared without having regard to or taking into account any particular investor’s objectives, financial situation and/or needs. All investors should therefore consider the appropriateness of the advice, in light of their own objectives, financial situation and/or needs, before acting on the advice. Past performance is not a reliable indicator of future performance. Any comments, suggestions or views presented do not reflect the views of WSL and/or NAB. Subject to any terms implied by law and which cannot be excluded, neither WSL nor NAB shall be liable for any errors, omissions, defects or misrepresentations in the information or general advice including any third party sourced data (including by reasons of negligence, negligent misstatement or otherwise) or for any loss or damage (whether direct or indirect) suffered by persons who use or rely on the general advice or information. If any law prohibits the exclusion of such liability, WSL and NAB limit its liability to the re-supply of the information, provided that such limitation is permitted by law and is fair and reasonable. For more information, please click here.